Intel DC P3520 Enterprise SSD Review
Why you can trust Tom's Hardware
8KB Random Read And Write
To read more on our test methodology visit How We Test Enterprise SSDs, which explains how to interpret our charts. The most crucial step to assuring accurate and repeatable tests starts with a solid preconditioning methodology, which is covered on page three. We cover 8KB random performance measurements on page four, explain latency metrics on page seven, and explain QoS testing and the QoS domino effect on page nine.
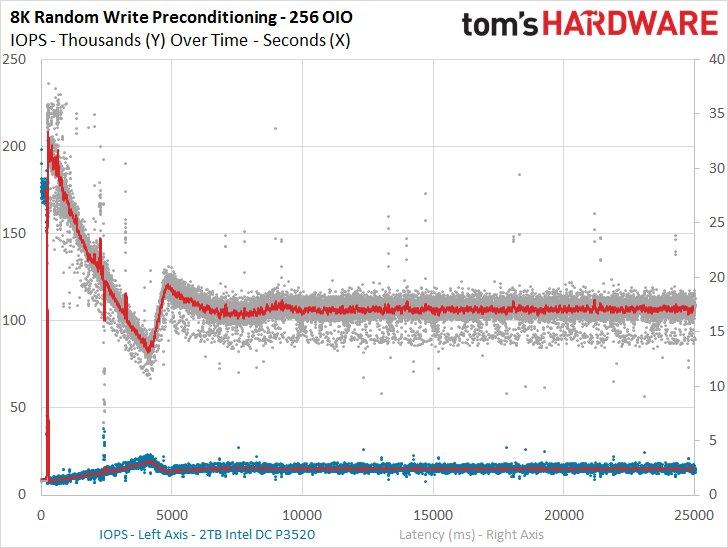
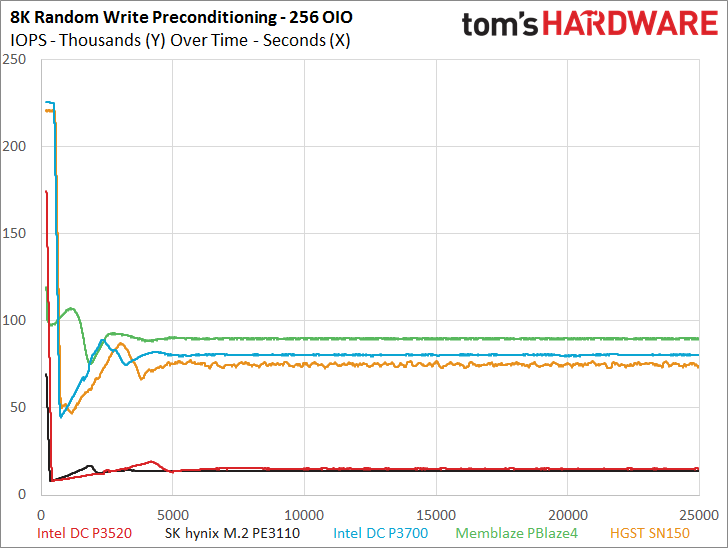
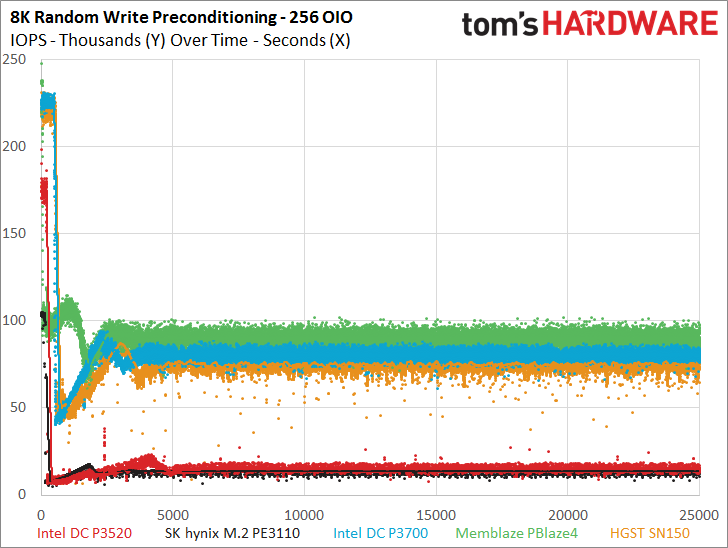
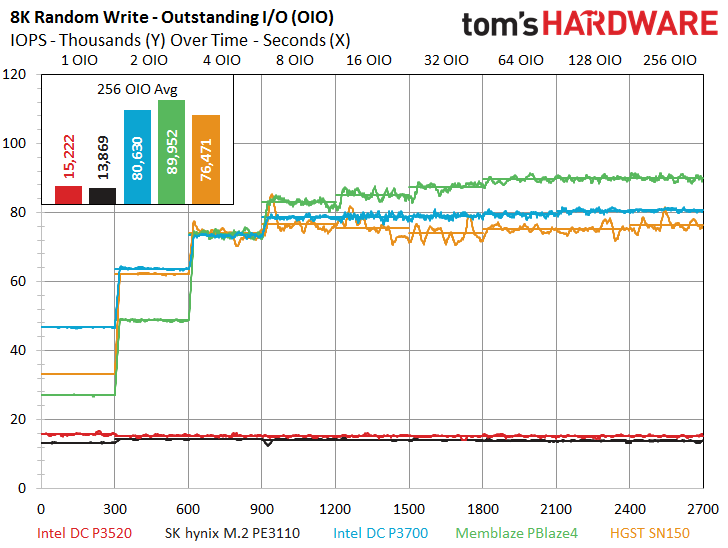
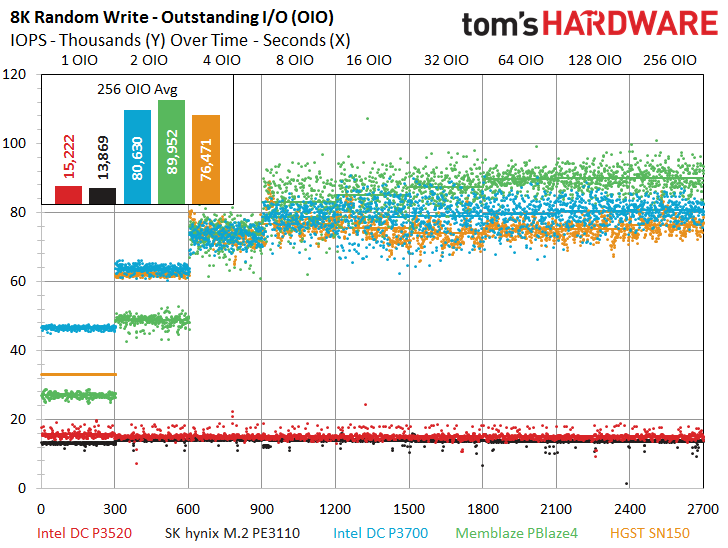
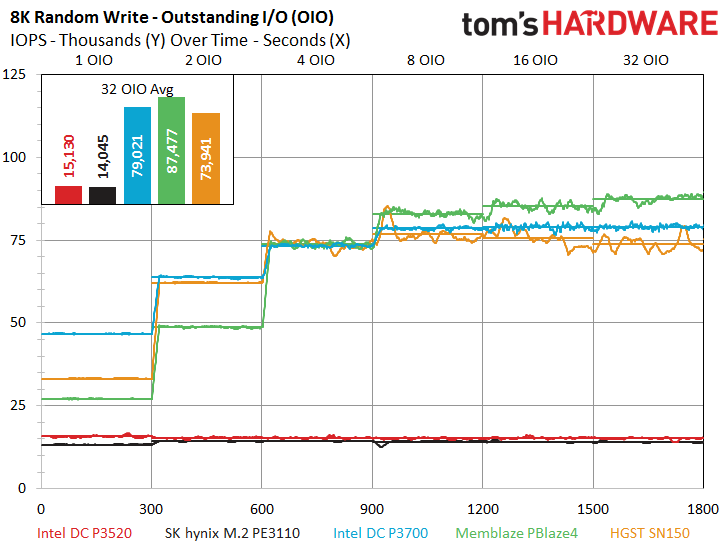
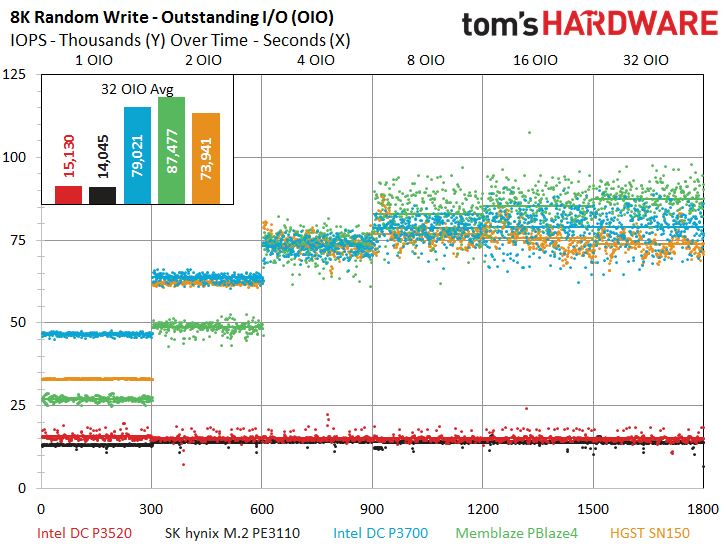
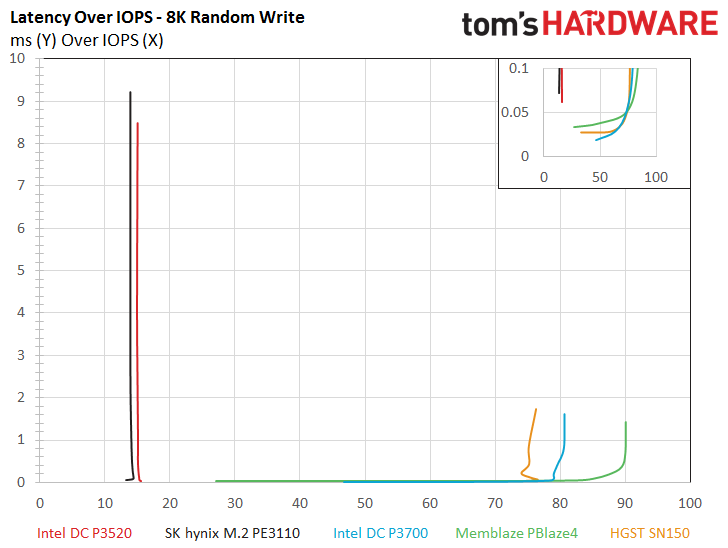
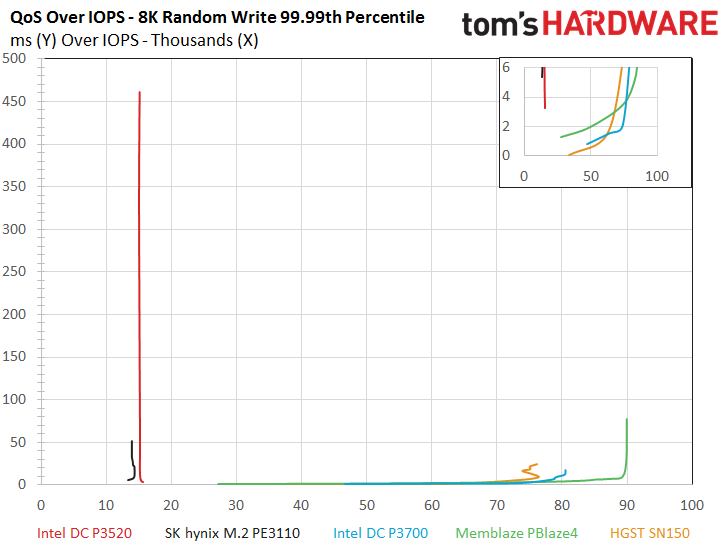
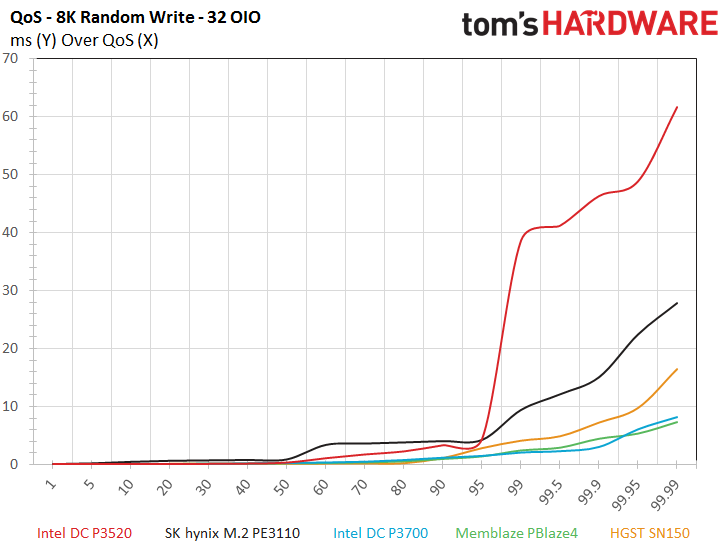
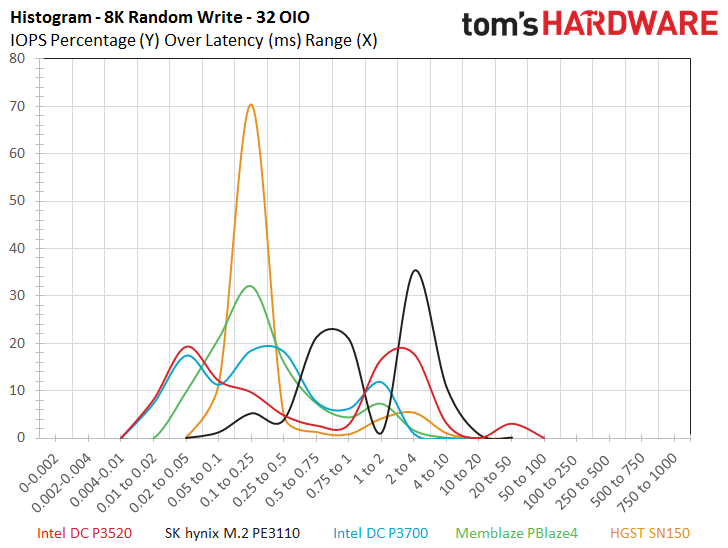
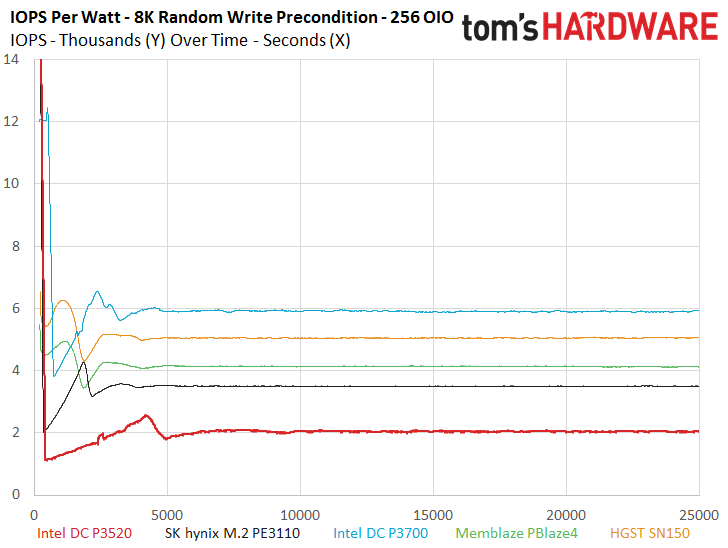
The 8k random write tests follow a similar pattern and the two value entrants fall to the bottom of the tests. The Intel DC P3520 QoS measurements top 450ms under the heaviest load, while the PE3110 reaches a top latency measurement of 50ms. The increased QoS measurements only come during very heavy workloads, which isn’t the DC P3250’s intended environment. We also note a higher DC P3520 QoS envelope during the 32 OIO 8k random write breakout. The histogram reveals a broad range of latency distributions for the DC P3520 and the PE3110, though we do note that the PE3110 begins with higher latency.
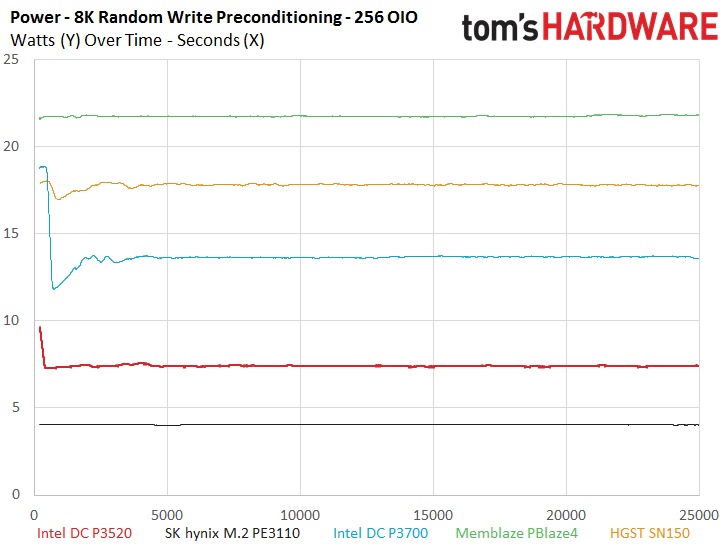
Power consumption continues to be a very encouraging story for the value models. The DC P3520 requires nearly half the power of its P3700 flagship predecessor, which illustrates how much of an advantage that IMFT 3D NAND provides. This is likely due to the reduced power consumption of each die, but density also helps eliminates some die, as well - density is just a win-win for power consumption.
The DC P3520 and PE3110 still lag the test filed in IOPS-per-Watt efficiency metrics, but it is important to note that we derived these metrics while the device is under full load, which is a rare encounter for even a heavy workload, let alone a mainstream read-centric application. This reality diminishes some of the perceived gains of the higher IOPS-per-Watt metrics, and the value parts will provide a tangible gain on both fronts during mainstream workloads.
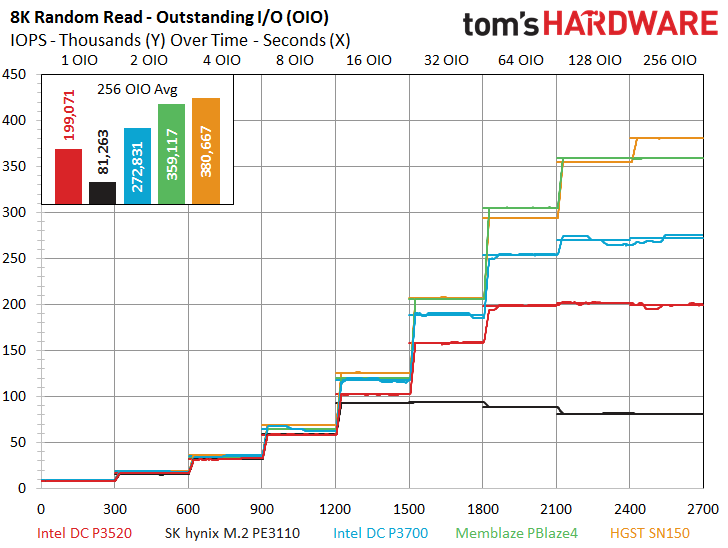
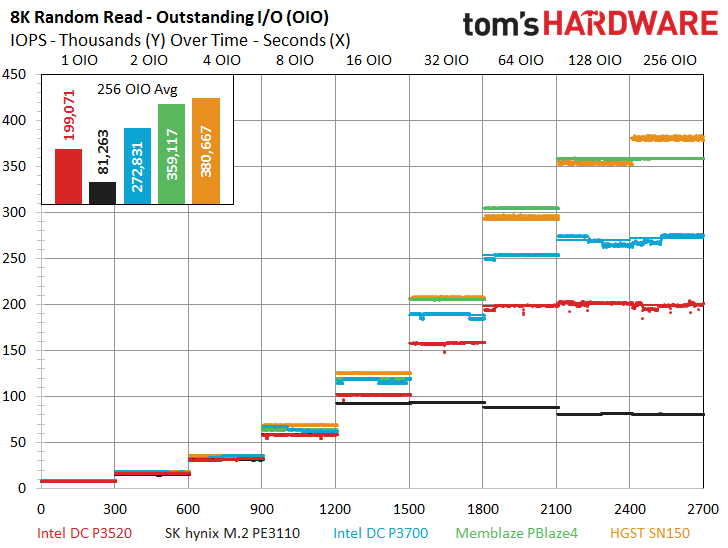
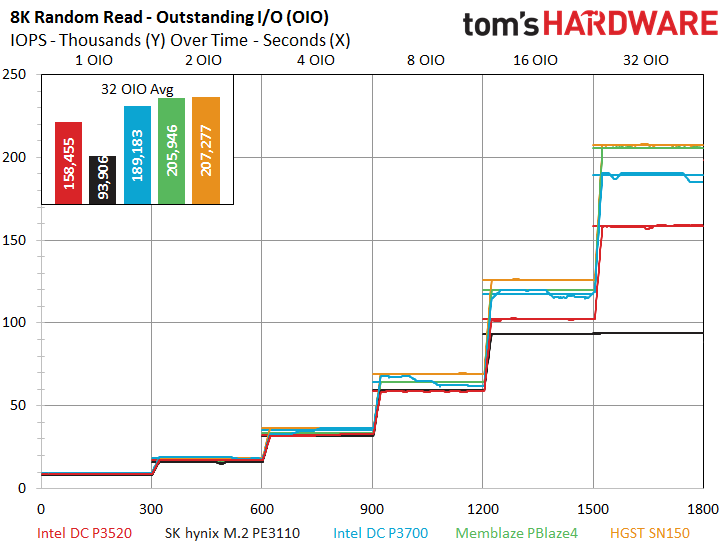
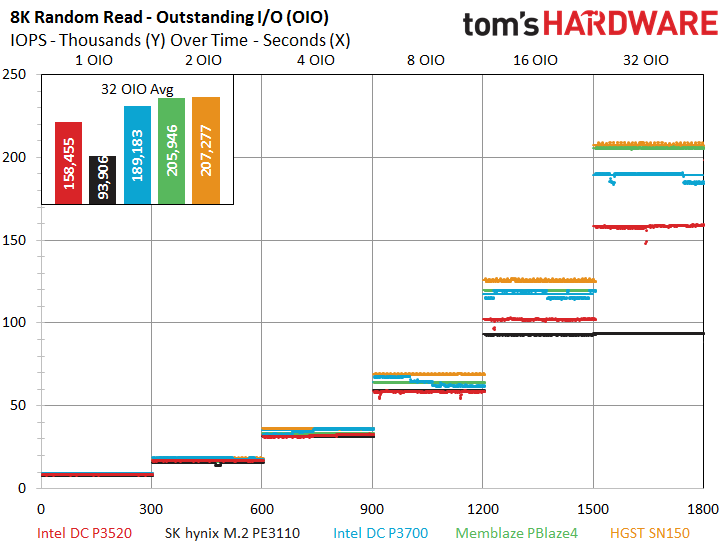
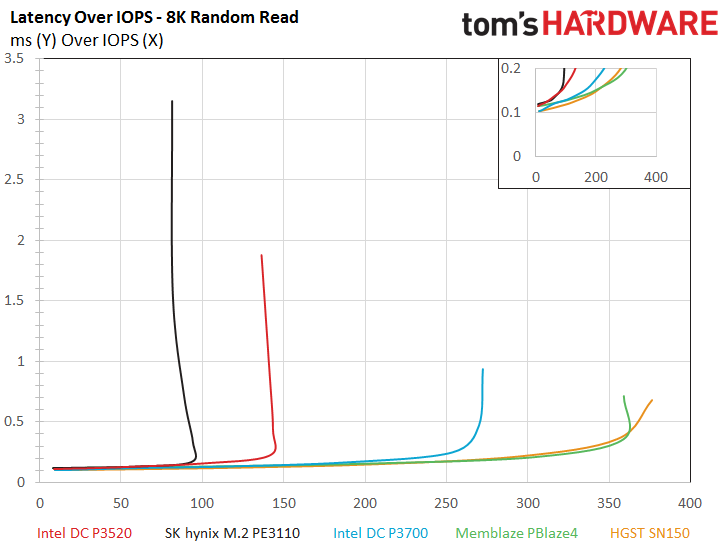
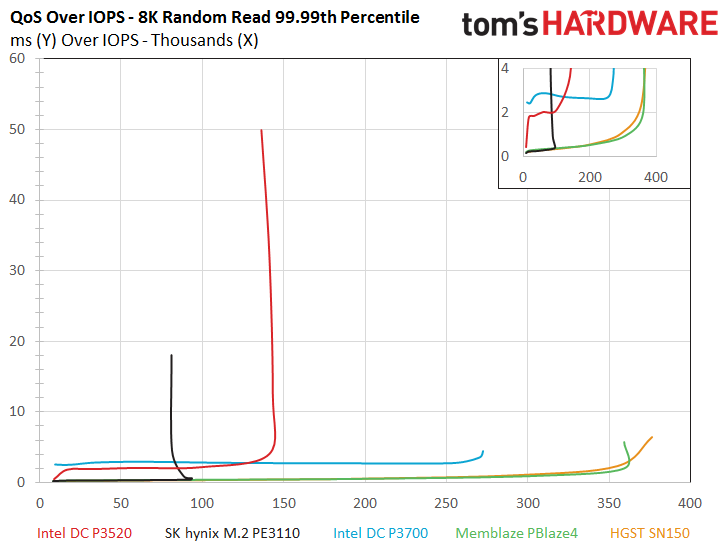
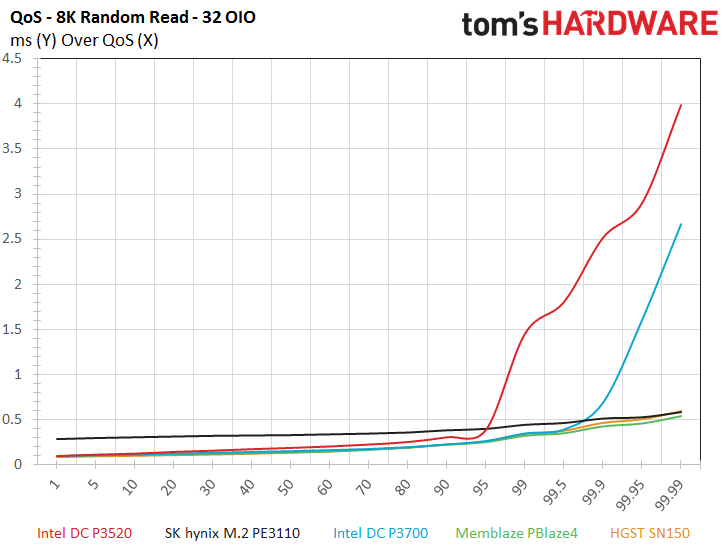
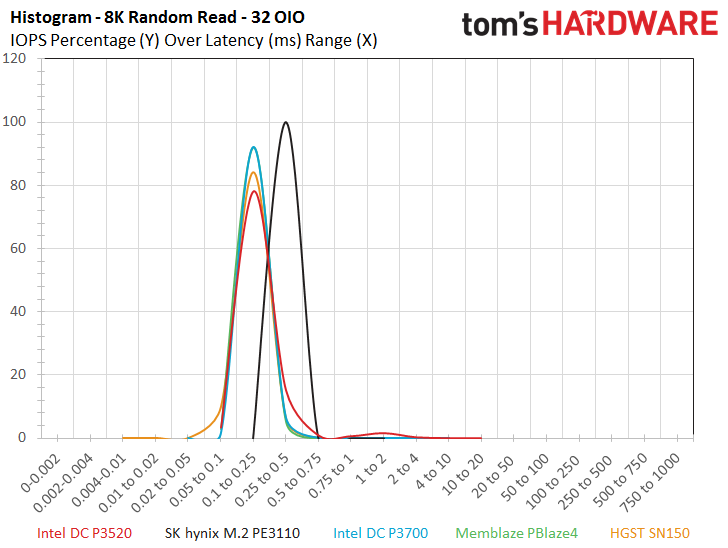
Once again, the low end of the scaling tree reveals great performance from the DC P3520 under 32 OIO. The SSD scales well with increased intensity, and both the latency and QoS-over-IOPS charts reveal a great performance profile, especially when we cast the DC P3520 in the light of reduced cost. The QoS breakout at 32 OIO reveals the same somewhat odd envelope during the read workload. On a brighter note, we were able to come within a mere 1,000 IOPS of the random read specification.
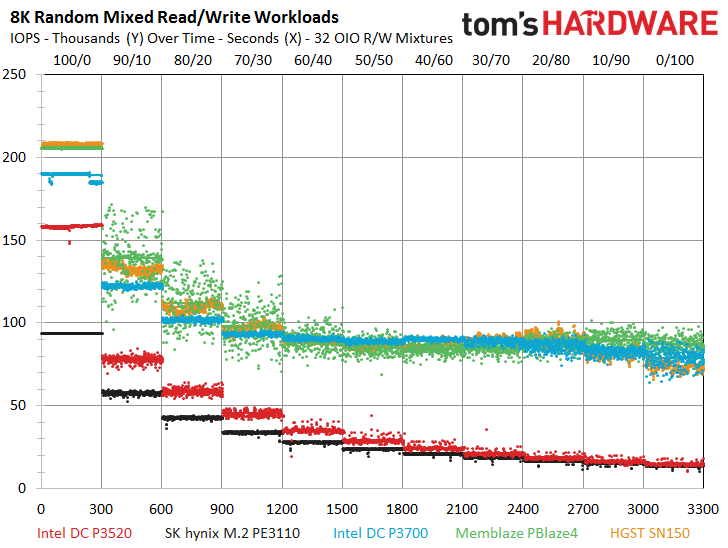
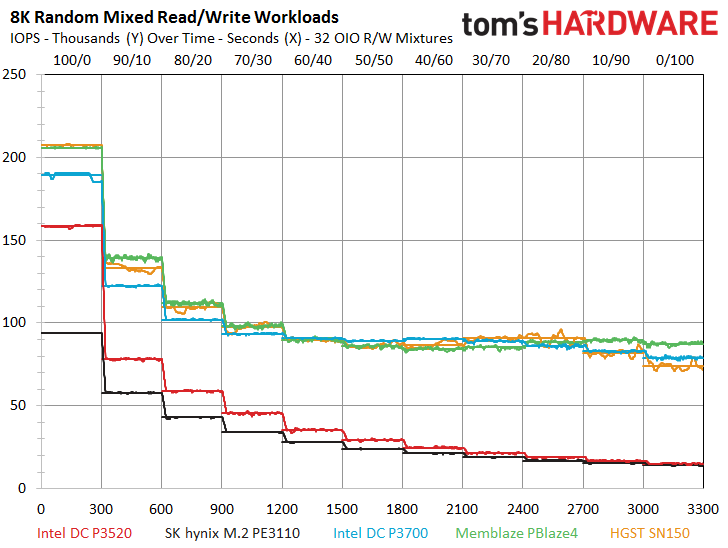
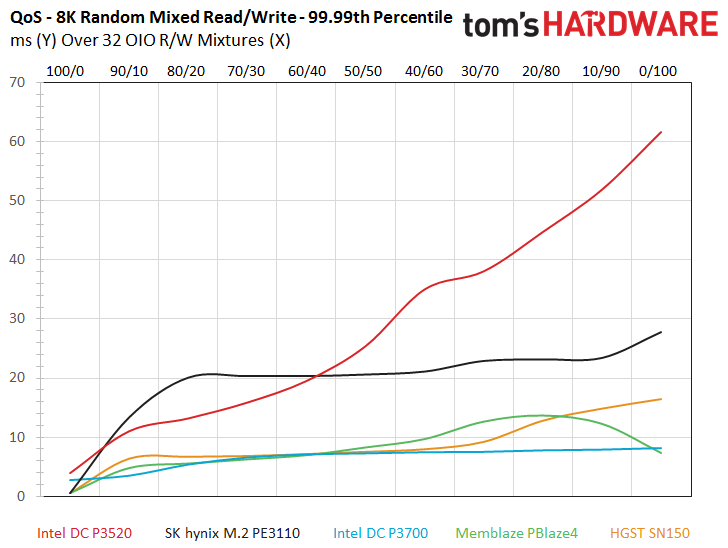
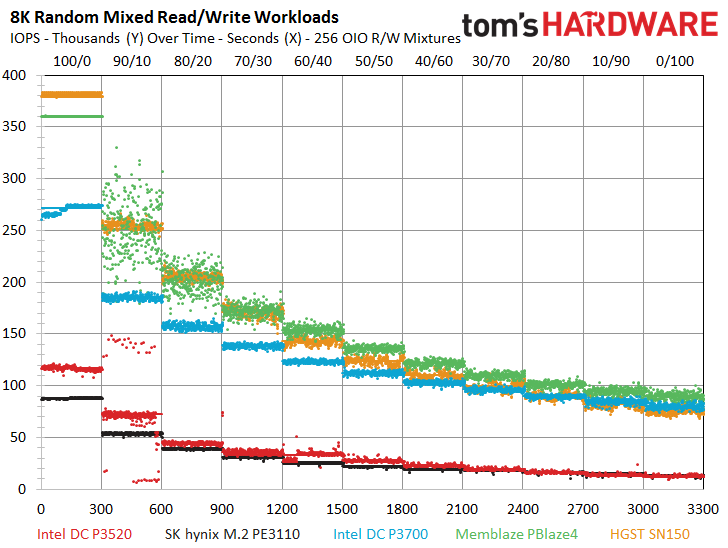
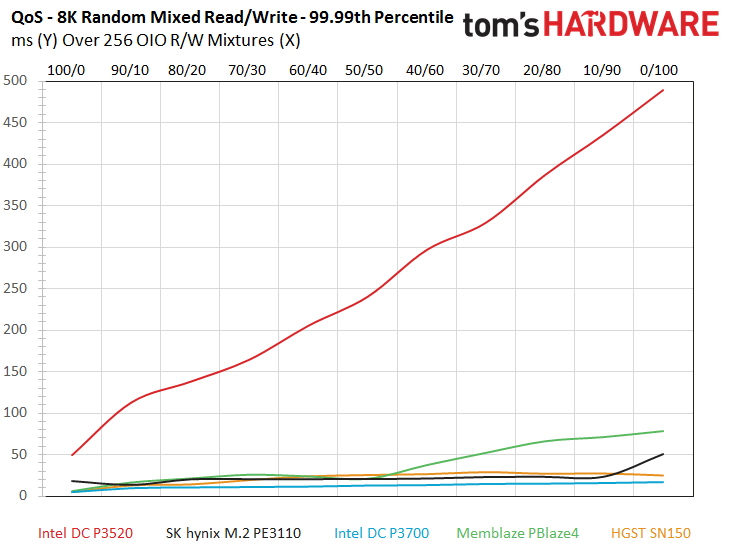
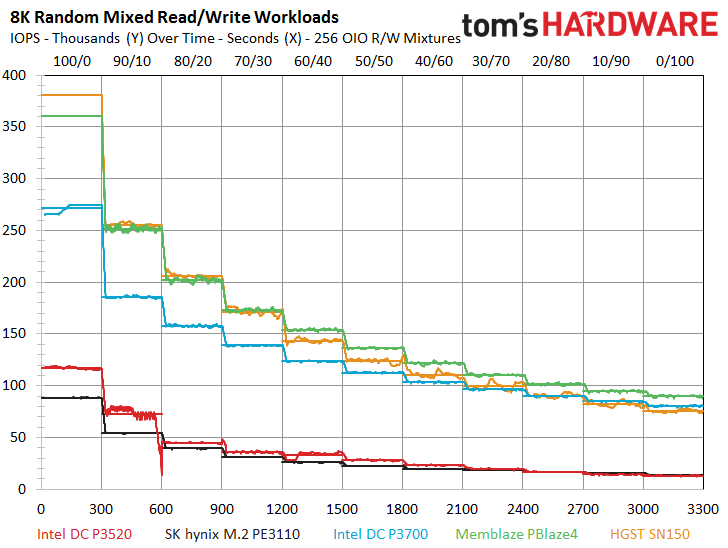
The 8k mixed workload finds the DC P3520 continuing to leverage its superior channel count to lead the PE3110 for the majority of the test, but the two SSDs achieve near parity after the 30/70 read/write workload. Both of the value entrants continue to provide exceptional performance consistency. Flagship high-endurance SSDs couldn’t muster such consistent performance even a few short years ago. The DC P3520 might have a bit of a firmware tuning issue under heavy load at the 90/10 mixed read/write workload, as the same erratic performance that we encountered during the 4K mixed tests crops up again at this mixture. We also noticed the increased QoS latency during the mixed tests at 256 OIO, but the heavy workload is beyond Intel’s QoS specifications, which stop (appropriately) at QD128.
MORE: Best Enterprise Hard Drives
MORE: Best Enterprise SSDs
Get Tom's Hardware's best news and in-depth reviews, straight to your inbox.
Current page: 8KB Random Read And Write
Prev Page 4KB Random Read And Write Next Page 128KB Sequential Read And Write
Paul Alcorn is the Editor-in-Chief for Tom's Hardware US. He also writes news and reviews on CPUs, storage, and enterprise hardware.
-
Game256 Paul, Chris, any updates regarding possible release dates of Samsung 960 EVO/PRO? Have you received the samples already?Reply -
DocBones Glad to see more u.2 formats, really dont like m.2 for desktops. That 2mm screw is a pain.Reply -
Tom Griffin Am I am idiot but should this be on Tom's IT Pro? Aside from that the M.2 for an enterprise drive simply does not jive on current motherboards look at PCIe lane allocation. 4x lanes one drive even the high end CPUs with 40 lanes will choke with more than 4.Reply -
bit_user Reply
You might be right, but I'm glad it's not. It represents superb read-oriented SSD performance. Especially for the price.18682745 said:this be on Tom's IT Pro?
It's not M.2. They have PCIe add-in cards and U.2 form factors. M.2 wouldn't fly, due to the power dissipation, if not also the board area needed.18682745 said:Aside from that the M.2 for an enterprise drive
How many of these are you planning to use? This is for read-intensive workloads, so you'd hopefully just need one, which could be paired with cheaper storage for everything else. I guess at the high end, you might pack a machine full of them, but then you might have more than one CPU (which adds yet more PCIe lanes).18682745 said:simply does not jive on current motherboards look at PCIe lane allocation. 4x lanes one drive even the high end CPUs with 40 lanes will choke with more than 4.
BTW, did you know that M.2 is a popular form factor for high-end desktop SSDs? It supports up to 4-lanes. So, it would seem that some people think such performance is worth the resource footprint. -
bit_user ReplyThe P3520 actually takes a step back on the performance front in comparison to the previous-generation DC P3500, which featured up to 430,000/28,000 read/write IOPS.
Given the deals out there to be had, the real star of the show is the DC P3500. If you can live with the lower endurance than the P3520, it offers a compelling alternative to the 750-series. Here's how they compare:
http://ark.intel.com/compare/86740,82846
Update: snagged a 400 GB DC S3500 at $225. Price is now back up to $275. Worth keeping an eye on, if you're interested. Supposedly, a full-height bracket is included in the box. I'll update again, to confirm. -
bit_user I'm just interested in the read performance, but I noticed two pairs of images that are nearly identical. I loaded them in different tabs and flipped back and forth. The only difference seems to be whether the lines from different queue depths are connected.Reply
http://media.bestofmicro.com/ext/aHR0cDovL21lZGlhLmJlc3RvZm1pY3JvLmNvbS9leHQvYUhSMGNEb3ZMMjFsWkdsaExtSmxjM1J2Wm0xcFkzSnZMbU52YlM5R0x6WXZOakV3T1RZeUwyOXlhV2RwYm1Gc0x6QXpMbkJ1Wnc9PS9yXzYwMHg0NTAucG5n/rc_400x300.png
http://media.bestofmicro.com/ext/aHR0cDovL21lZGlhLmJlc3RvZm1pY3JvLmNvbS9leHQvYUhSMGNEb3ZMMjFsWkdsaExtSmxjM1J2Wm0xcFkzSnZMbU52YlM5R0x6a3ZOakV3T1RZMUwyOXlhV2RwYm1Gc0x6QTBMbkJ1Wnc9PS9yXzYwMHg0NTAucG5n/rc_400x300.png
And:
http://media.bestofmicro.com/ext/aHR0cDovL21lZGlhLmJlc3RvZm1pY3JvLmNvbS9leHQvYUhSMGNEb3ZMMjFsWkdsaExtSmxjM1J2Wm0xcFkzSnZMbU52YlM5R0x6Y3ZOakV3T1RZekwyOXlhV2RwYm1Gc0x6QXhMbkJ1Wnc9PS9yXzYwMHg0NTAucG5n/rc_400x300.png
http://media.bestofmicro.com/ext/aHR0cDovL21lZGlhLmJlc3RvZm1pY3JvLmNvbS9leHQvYUhSMGNEb3ZMMjFsWkdsaExtSmxjM1J2Wm0xcFkzSnZMbU52YlM5R0x6Z3ZOakV3T1RZMEwyOXlhV2RwYm1Gc0x6QXlMbkJ1Wnc9PS9yXzYwMHg0NTAucG5n/rc_400x300.png
Not really a complaint - just an observation. As long as the data is accurate, no harm done.
Then, at the end of the read graphs, it seems like some AMD slides crept in? Oops?
BTW, the Latency vs. IOPS is now officially my second favorite SSD performance graph (after IOPS vs. queue depth, of course).