Intel 3D XPoint Optane SSD DC P4800X Performance Preview
8K Random Read & Write
To read more on our test methodology visit How We Test Enterprise SSDs, which explains how to interpret our charts. The most crucial step to assuring accurate and repeatable tests starts with a solid preconditioning methodology, which is covered on page three. We cover 8KB random performance measurements on page four, explain latency metrics on page seven, and introduce QoS testing and the QoS domino effect on page nine.
Many enterprise-oriented applications lean heavily on 8KB random performance, so we include those measurements to highlight trends found in them.
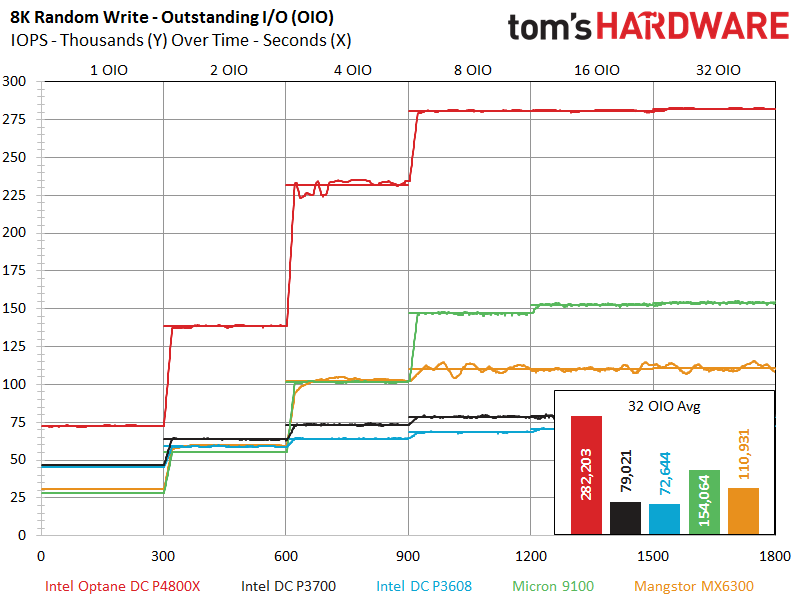
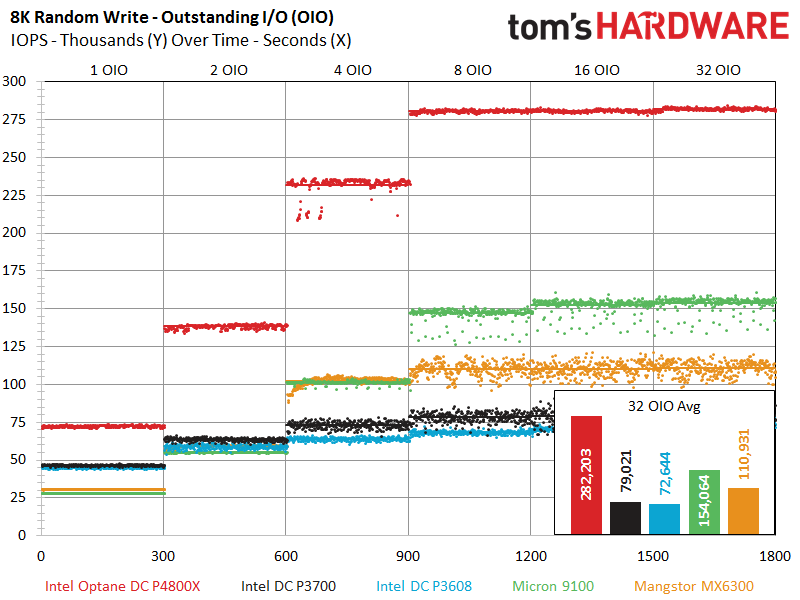
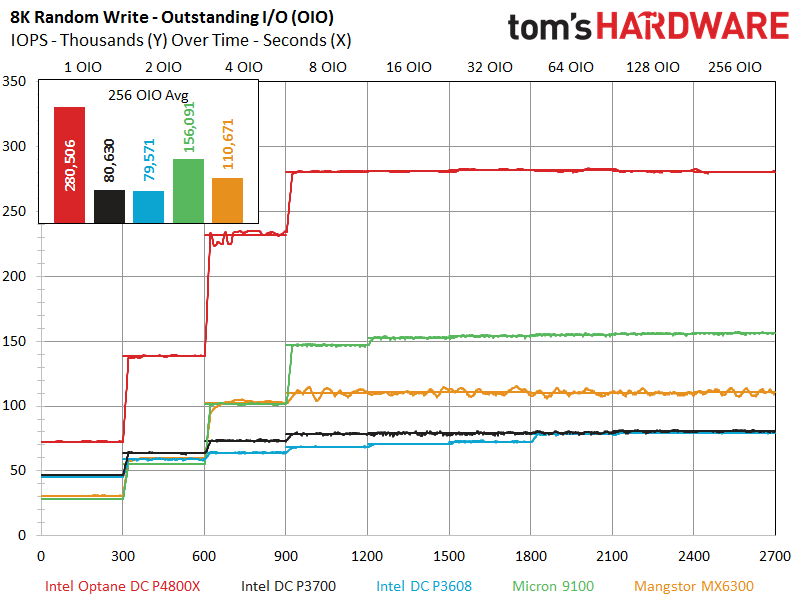
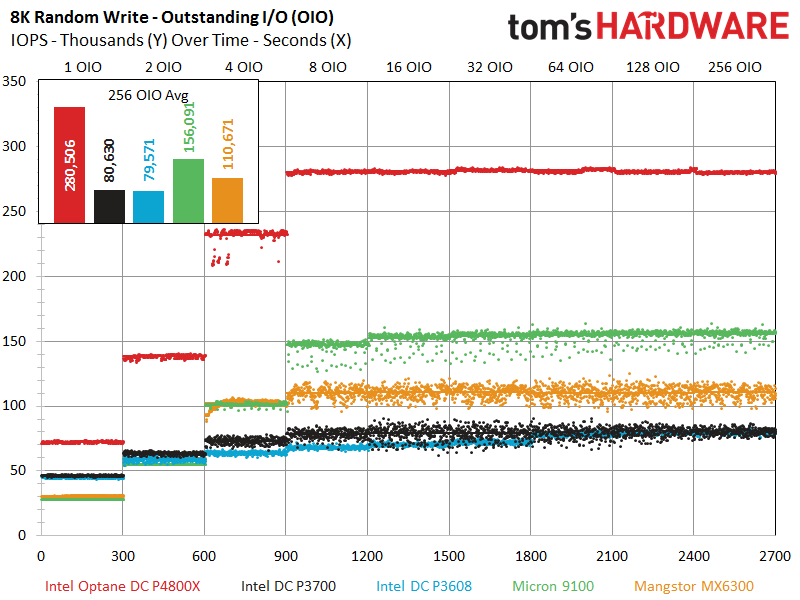
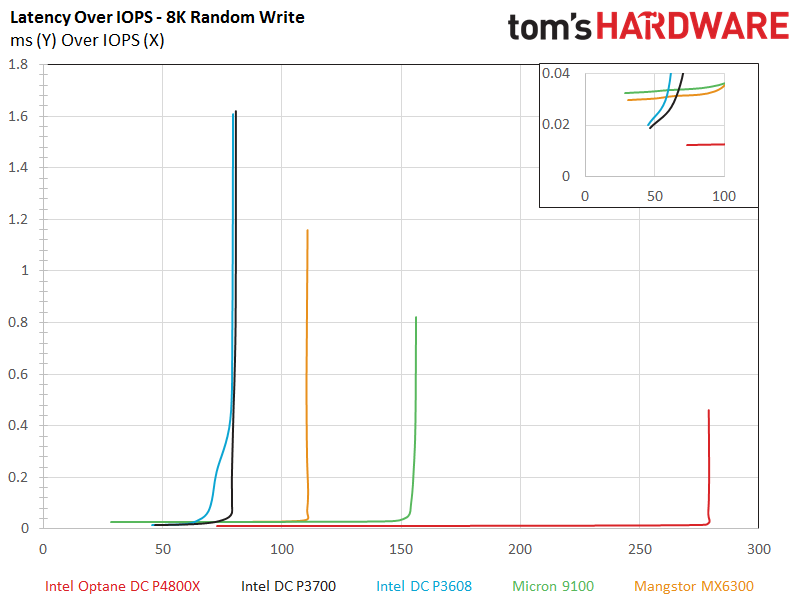
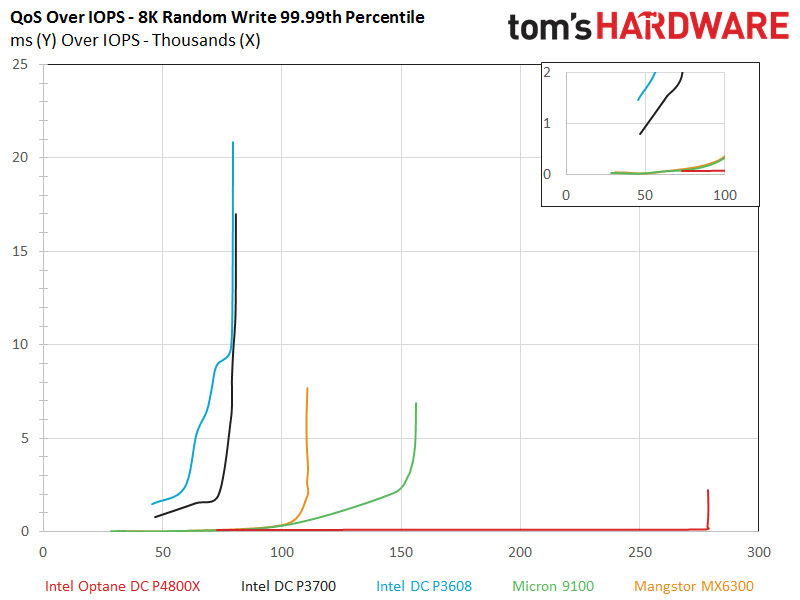
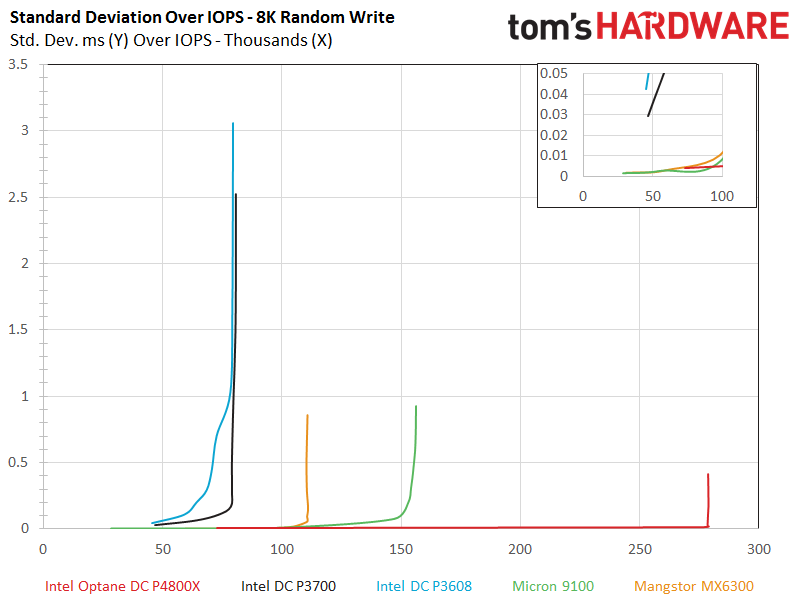
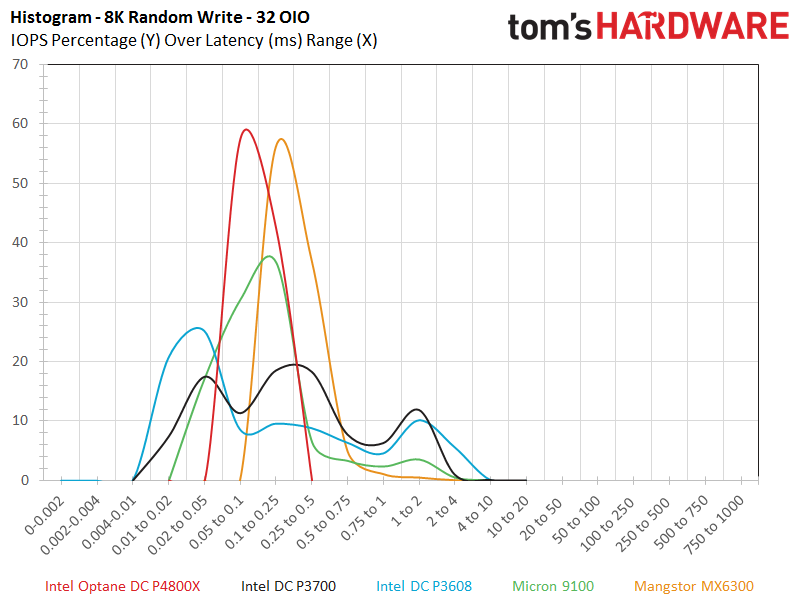
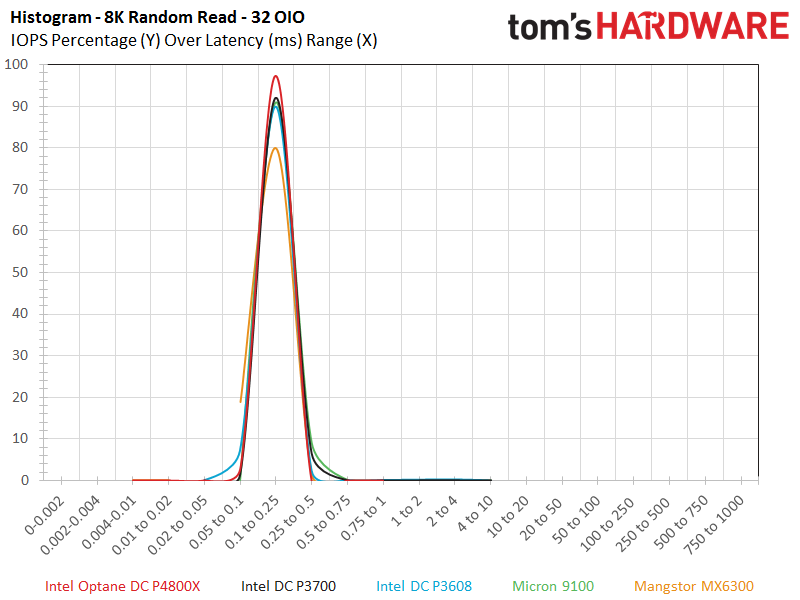
The 8K random results tell much the same story as the 4K random measurements, albeit with lower IOPS figures due to the larger transfers. The DC P4800X hits 280,000 IOPS at eight OIO, so it's pushing 2166 MB/s of random data. It also offers a much more refined profile than competing SSDs. The histogram also shows the hallmarks of admirable consistency. Mainly, nearly all of the DC P4800X's commands complete within a four-bin span. The other SSDs have long tails (hence, the term long-tail latency) that span a wide array of bins, suggesting less consistent performance.
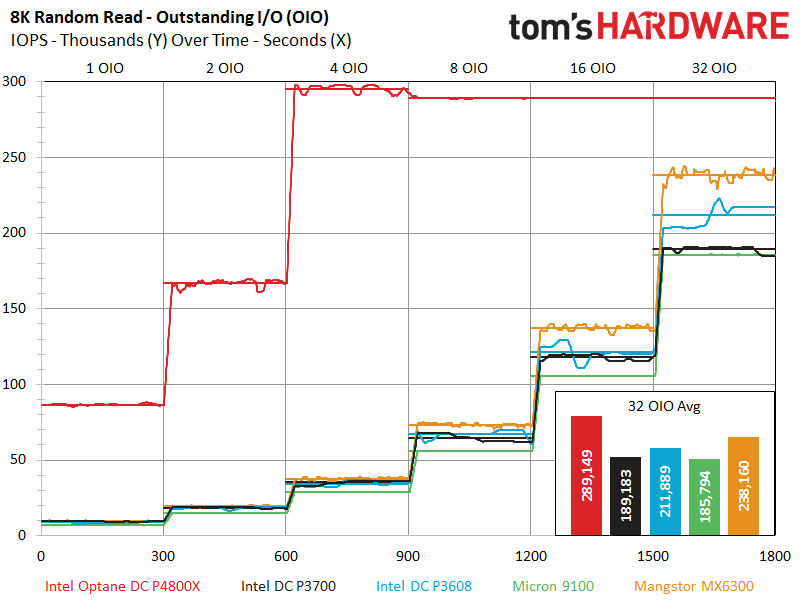
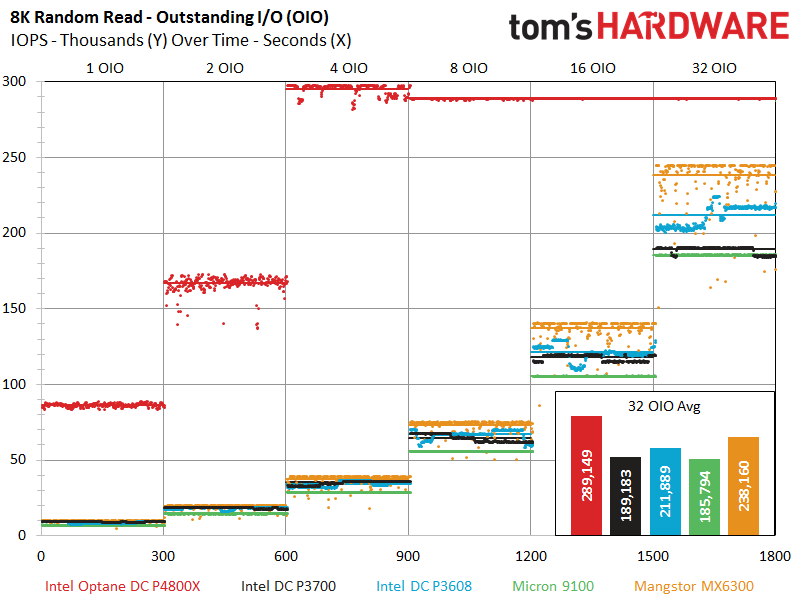
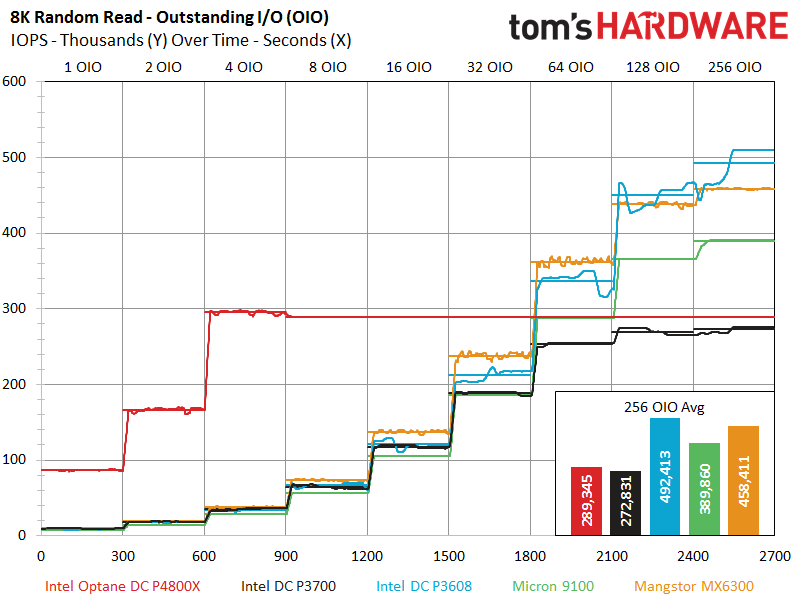
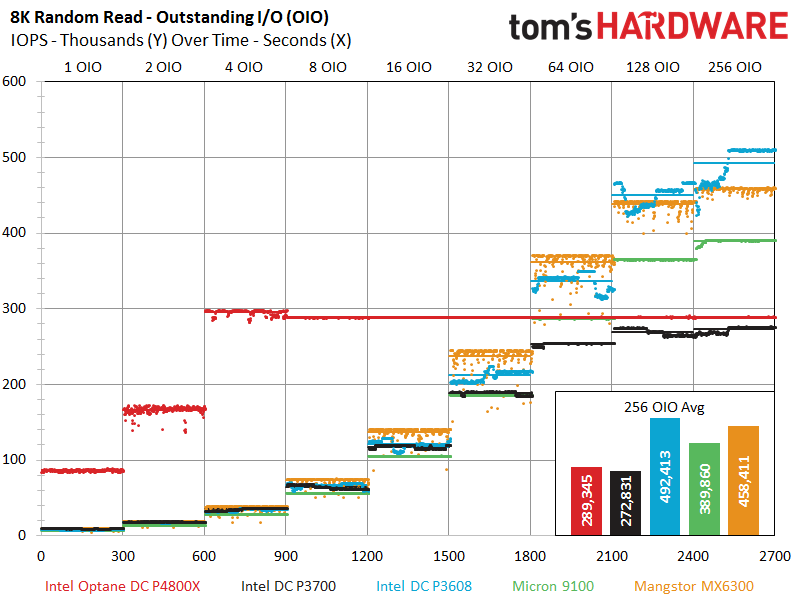
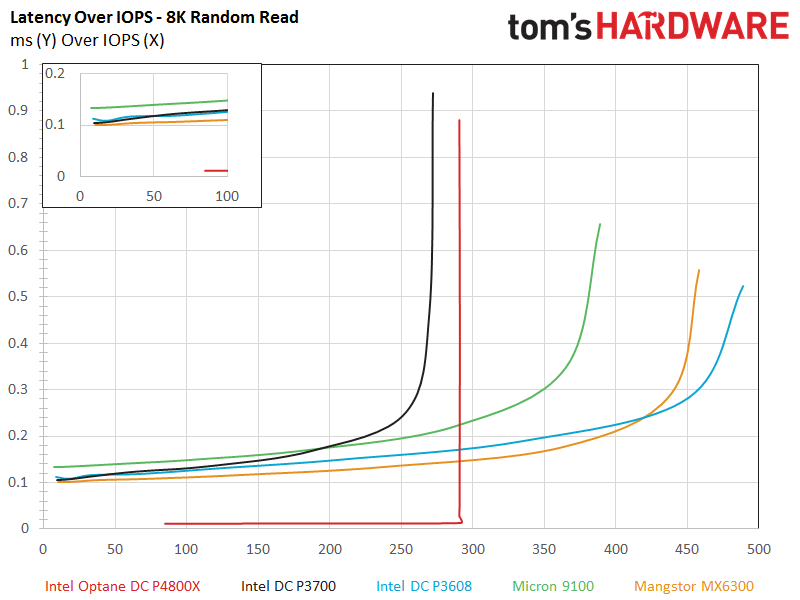
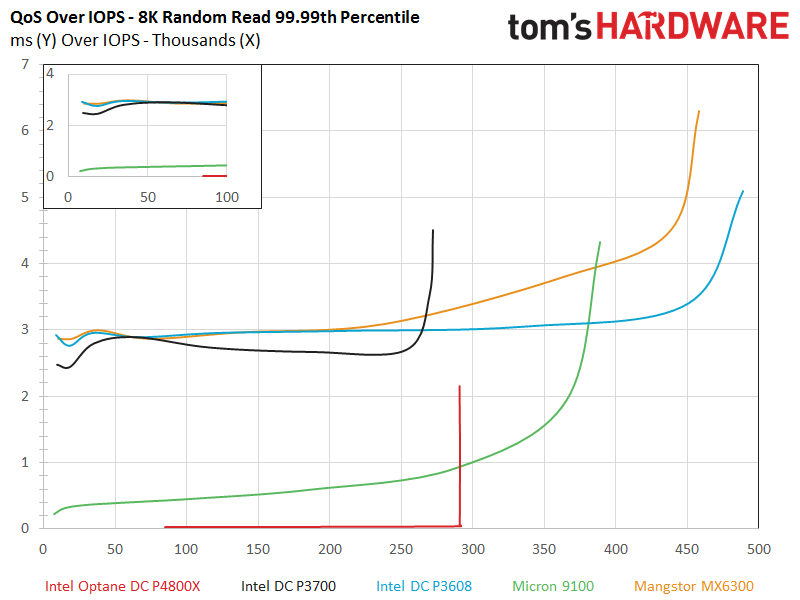
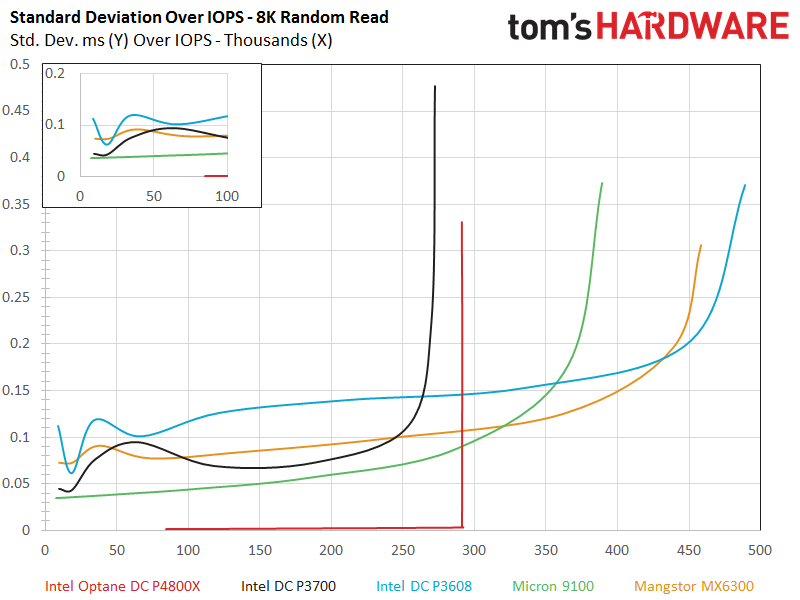
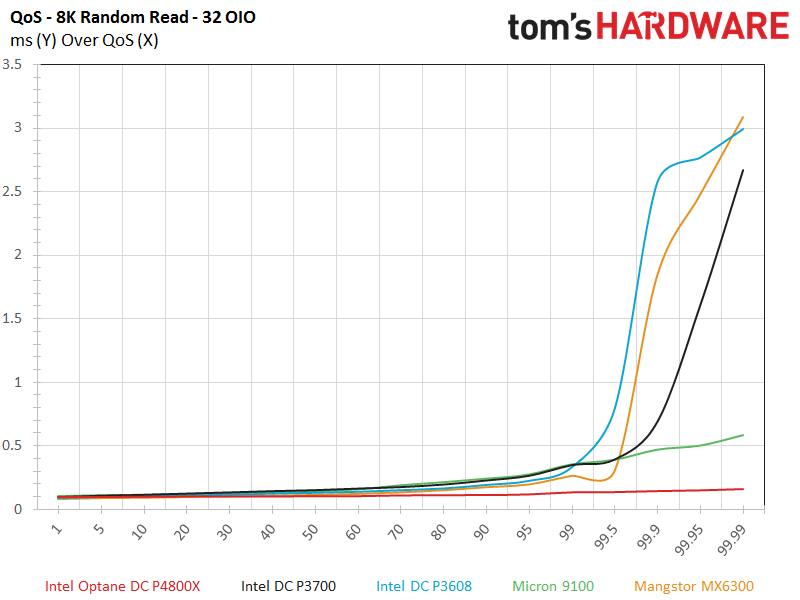
The DC P4800X reaches its maximum performance at four OIO, which is incredible. The other SSDs offer one-twelfth of the performance at that crucial load level. The final chart in the series shows the various latency percentile measurements that we capture during every segment of the test. Intel's DC P4800X offers the best latency performance across the board.
The 8K mixed workload chart is the most relevant due to its direct correlation to many different classes of transactional workloads. Most vendors still spec their SSDs using pure random read or write measurements, which are represented by the 100/0 and 0/100 columns on the opposing sides of the chart. The read/write mixtures in the middle are where real applications reside, with more demanding workloads skewing toward the write-centric range on the right.
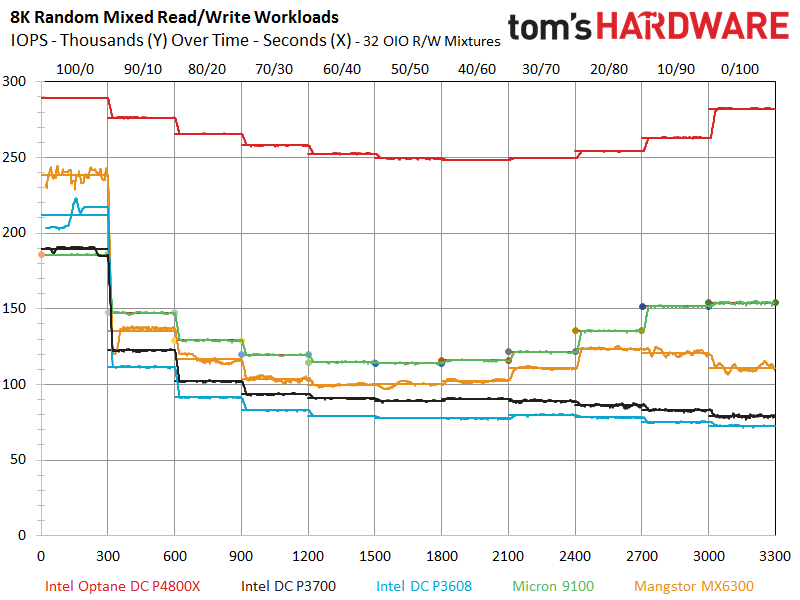
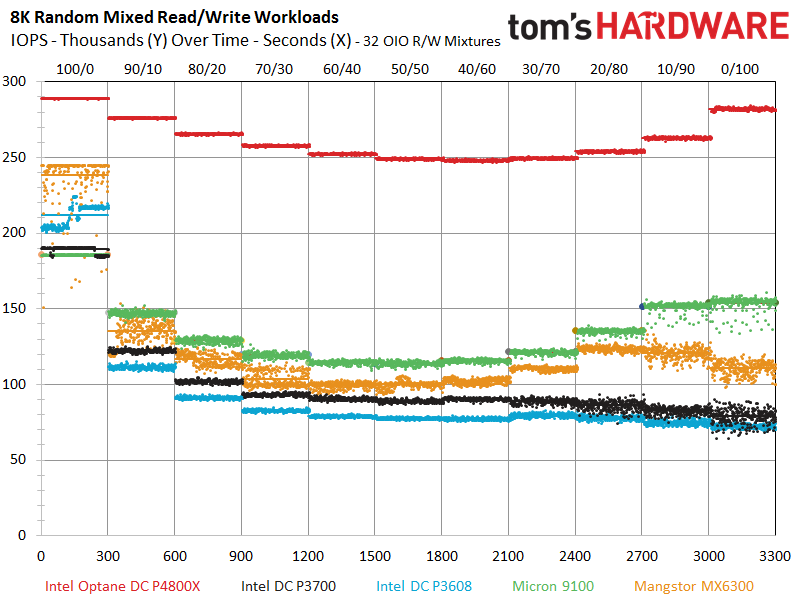
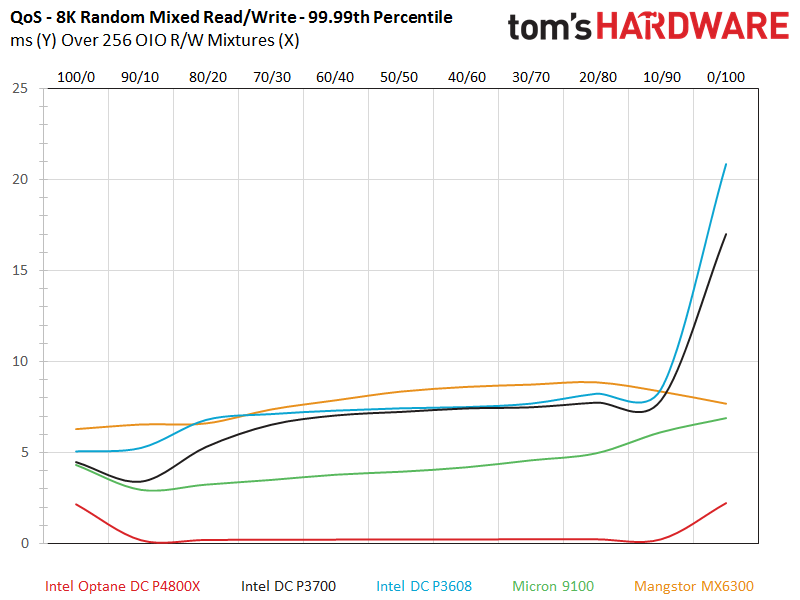
All the NAND-based SSDs fall right off a cliff when any form of write workload is applied to the drive, as we can see on the left. The DC P4800X, in contrast, handles mixed workloads well and only loses a fraction of its performance as we progress into the more demanding portions of the test.
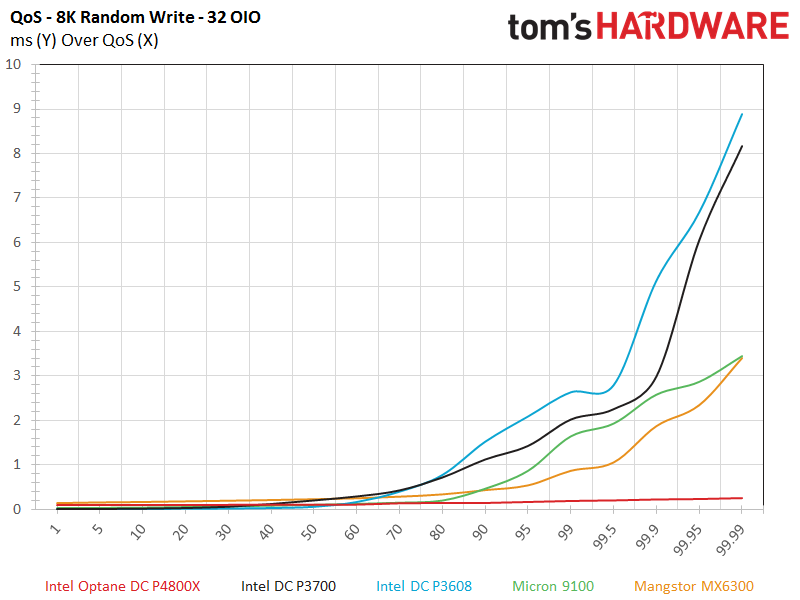
Again, quality of service is one of the most important aspects of performance, and most SSDs begin to exhibit inconsistent or erratic behavior during heavy write workloads. The QoS chart shows the curve on the right as we encounter variability from the two Intel NAND-based SSDs. The DC P4800X rectifies this with an amazing profile.
Get Tom's Hardware's best news and in-depth reviews, straight to your inbox.
MORE: Best Enterprise SSDs
Current page: 8K Random Read & Write
Prev Page 4K Random Read & Write Next Page 128K Sequential Read & Write
Paul Alcorn is the Editor-in-Chief for Tom's Hardware US. He also writes news and reviews on CPUs, storage, and enterprise hardware.
-
Geekwad A true signal that raw processing power is played out.Reply
Storage of all kinds and an increased focus on parallelism in software implementations is more exciting. -
anbello262 I can't wait to have the consumer version. I can cleary see in a few years ssd replacing hdd for storage, and xpoint replacing ssd for OS/boot/programs.Reply -
shrapnel_indie Call me when the testing is completed with real hardware on hand. Its too easy to simulate in a virtual environment. (Not saying they did, but the potential exists.) The numbers are nice though.Reply