The SSD 730 Series Review: Intel Is Back With Its Own Controller
Results: 4 KB Random Performance
We turn to Iometer as our synthetic metric of choice for testing 4 KB random performance. Technically, "random" translates to a consecutive access that occurs more than one sector away. On a mechanical hard disk, this can lead to significant latencies that hammer performance. Spinning media simply handles sequential accesses much better than random ones, since the heads don't have to be physically repositioned. With SSDs, the random/sequential access distinction is much less relevant. Data are put wherever the controller wants it, so the idea that the operating system sees one piece of information next to another is mostly just an illusion.
4 KB Random Reads
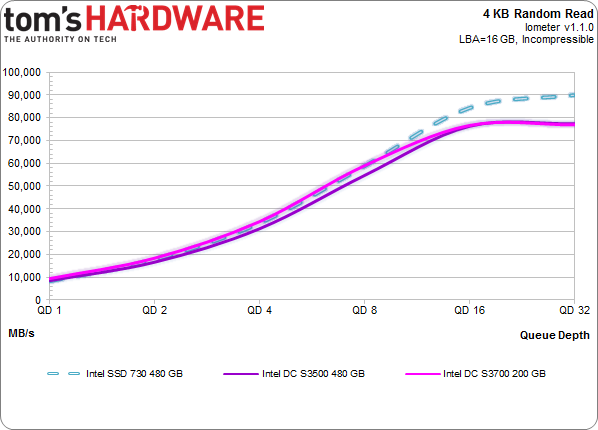
Testing the performance of SSDs often emphasizes 4 KB random reads, and for good reason. Most system accesses are both small and random. Moreover, read performance is arguably more important than writes when you're talking about typical client workloads.
Whether it's the controller's higher clock rate, the faster NAND interface, or a combination of both, the SSD 730 Series 480 GB ends up holding a good 10,000 IOPS over the SSD DC S3500 and S3700.
4 KB Random Writes
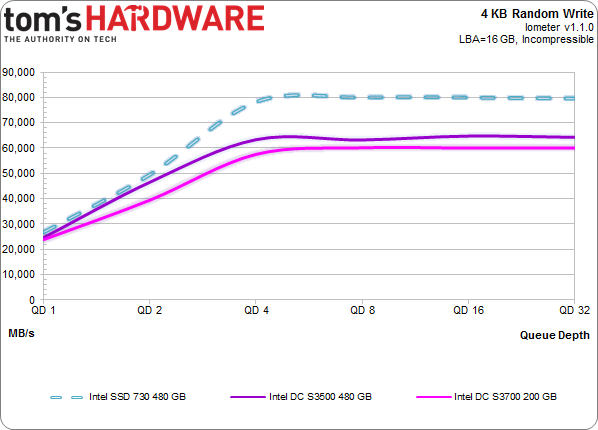
Random write performance is also important. Early SSDs didn't do well in this discipline, seizing up even in light workloads. Newer SSDs wield more than 100x the performance of drives from 2007, though we also recognize that there's a point of diminishing returns in desktop environments.
We see the same outcome here, except the SSD 730 Series peaks almost 33% higher than the SSD DC S3700 and a little under that over the S3500.
Get Tom's Hardware's best news and in-depth reviews, straight to your inbox.
Random Performance Over Time
My saturation test consists of writing to each drive for a specific duration with a defined workload. Technically, it's an enterprise-class benchmark, where the entire LBA space of the SSD is utilized by a random write at high queue depths. But that's relevant here, since the SSD 730 Series drive has enterprise-class roots.
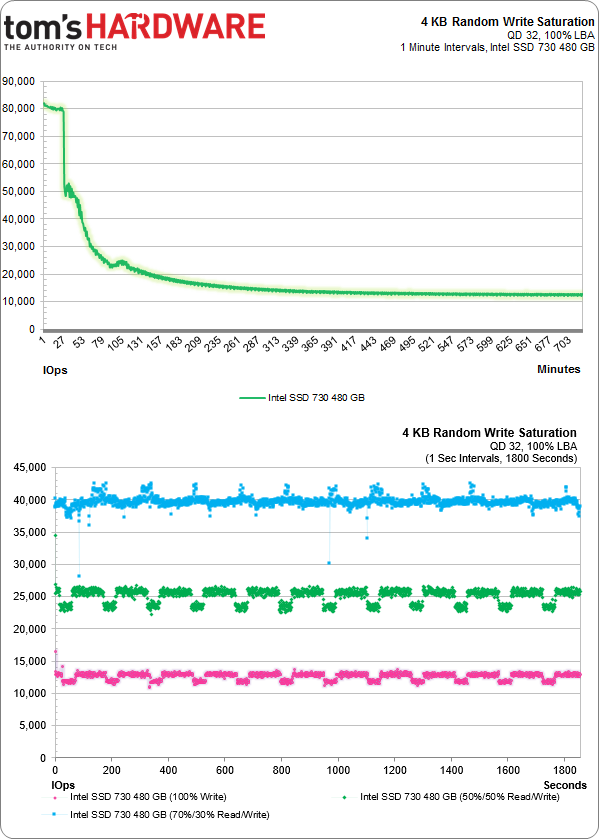
This is 12 hours of a 4 KB write with 32 outstanding commands. First, we secure erase each drive. Then, we apply the 4 KB write load, showing the average IOPS for each minute (except for the last 20 minutes, where we zoom in and show you one-second average increments).
After the first drive fill, performance drops off fast because the SSD 730 doesn't have any more free blocks to write to. Rather, old blocks have to be erased prior to subsequent writes. Nevertheless, Intel's drive starts off stoutly. The company's goals with its SSD DC S3700 were low write amplification accompanied by high steady state write performance and latency confined to a narrow range.
Those first two are of less concern on a client drive. Intel likely anticipates that most of the pounding applied to its SSD 730 will come from high-res video, after all.
The SSD DC S3700 employs a good deal more over-provisioning and better flash, leaving its SSD DC S3500 and SSD 730 much more similar (aside from the fancy firmware and overclocked components). That's good enough for a steady state 12,000 IOPS, measured in one-minute averages, though. This is a respectable number from a client drive. Obviously sacrificing more usable capacity for better steady state speed would help. But in this case, it's wholly unnecessary.
When I slice out a chunk of that line graph to observe one-second intervals, another story materializes. I've gone a step further to generate 100% write numbers (in pink), 50% reads and 50% writes (in green), and 70% reads and 30% writes (in blue). Clearly, the pink bar is at the bottom. With such a disparity between read and steady state write performance, the more write I/Os in the mix, the lower you'll see performance dip. To that point, a mix of 50/50 yields about 25,000 IOPS, while the 70/30 gives you around 40,000. But all three mixes of reads and writes exhibit the same limited spread as the more data center-oriented SSDs, with little variation from minimum to maximum. Like a marksman, the SSD 730 Series manages remarkably tight groupings for a client drive. This is especially awesome in a striped array, where the entire configuration is only as fast as its slowest member.
Here's a break-down of the maximum observed 4 KB sequential read and write performance with Iometer. The order the drives appear in our chart is determined by maximum combined read and write performance.
The 480 GB SSD 730 falls in amongst the top tier of mainstream drives. Maximum IOPS isn't the surest indicator of performance, which is why we use so many other tests to characterize speed as well. If you're going to sell a drive on its raw, unadulterated performance, though, you'd better be sure that SSD delivers.
Current page: Results: 4 KB Random Performance
Prev Page Results: 128 KB Sequential Performance Next Page Results: Tom's Storage Bench v1.0-
blackmagnum That skull on an Intel SSD means this product is the Big Kahuna. Samsung just cannot crush this competition.Reply -
Amdlova that 480 drain more than a 5400rpm HDD. Samsung or sandisk for laptops. Please next SSDReply -
rokit Never expected Intel to fail like that. Samsung still offers the best performance/power consumption/$Reply
I guess that skull did the job, power of signs )
p.s. this site has level editing in non-forum mode(the one you see and use by default)
Watch the language. - G -
mamasan2000 I don't see why the Intel SSD is any good. It's midpack at best at everything. Even my cheap Sandisk is better and it was the cheapest SSD I could get around here (besides Kingston).Reply -
unityole how is samsung the best? http://www.tweaktown.com/blogs/Chris_Ramseyer/58/real-world-ssd-performance-why-time-matters-when-testing/index.htmlsandisk and toshiba SSD, look at the chart and see the performance for yourself. Evo doing well, but thats only cause of the SLC flash helping it.Reply -
eriko All this Samsung love here... I have two brand new 840 Evo 250GB drives, and they are garbage.In fact they are so poor, I had to separate all my files, and break the RAID,and have two individual volumes, so as to have Trim enabled, and also Magician running, otherwise, terrible read and write (especially) performance resulted. I did verify they were genuine drives too. As soon as you begin to fill up these 250GB Evos, performance falls off a cliff.I'm now not a believer in TLC, and wish I had waited to get the Pro's (not available in this part of the world), as I hear much better things about them.But I've had my fill of reading reviews on consumer drives, I'm going to California in a week or so, and so I will either get 2 x 400GB S3700's, or a single 800GB S3700 (and to hell with RAID). Enterprise drives are the bomb, and don't forget that. Lost way too much time and data now with 'consumer' drives...By the way, X25E 64GB still going strong without so much as a hiccup. Not even a burp... If they made a 640GB X25E, I think I'd suck their, ok, I won't say that but you get the idea.Reply -
zzzaac Just curious, this speed, would you be able to tell that it is faster, or is it just though benchmarks?.This ssd is quite expensive at my local parts shopReply


