Nvidia GeForce GTX 1060 Graphics Card Roundup
Benchmark Results
Why you can trust Tom's Hardware
We test every card after a suitable warm-up period to avoid unfair differences in GPU Boost frequencies. All benchmarks are run six times; the first one is used to get the GPU hot again.
These cards are all press samples operating at the same settings as retail models in our best effort to ensure one vendor doesn't get a leg up on another using non-representative clock rates.
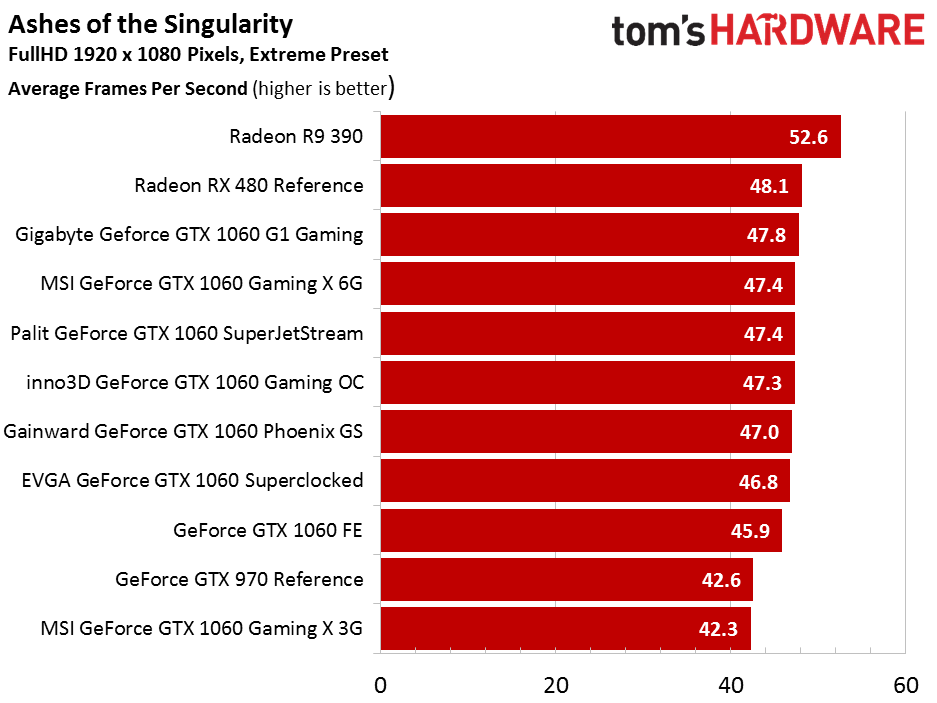
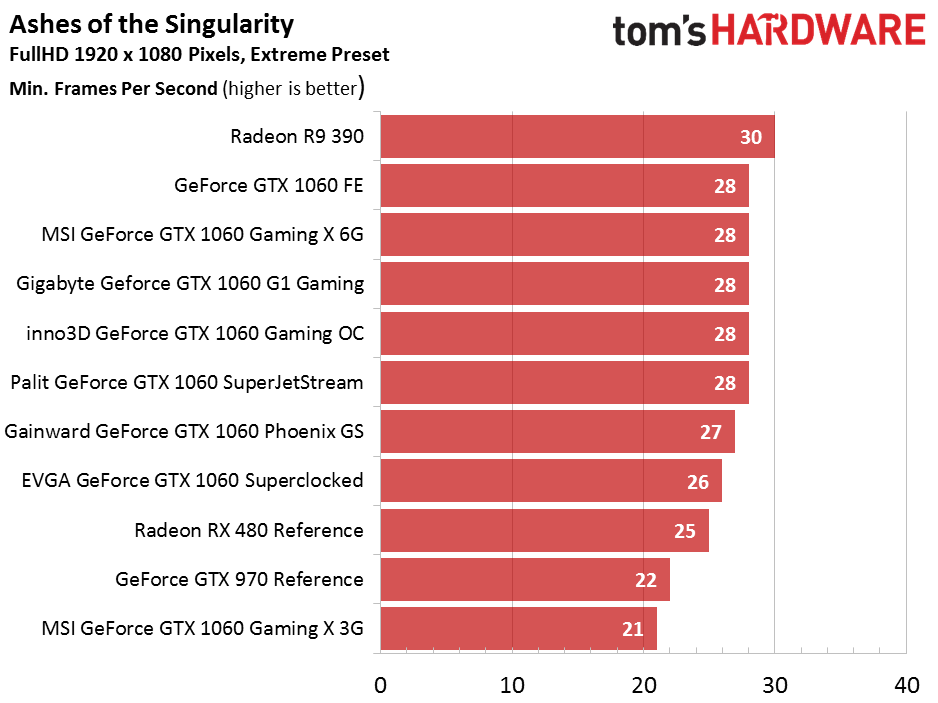
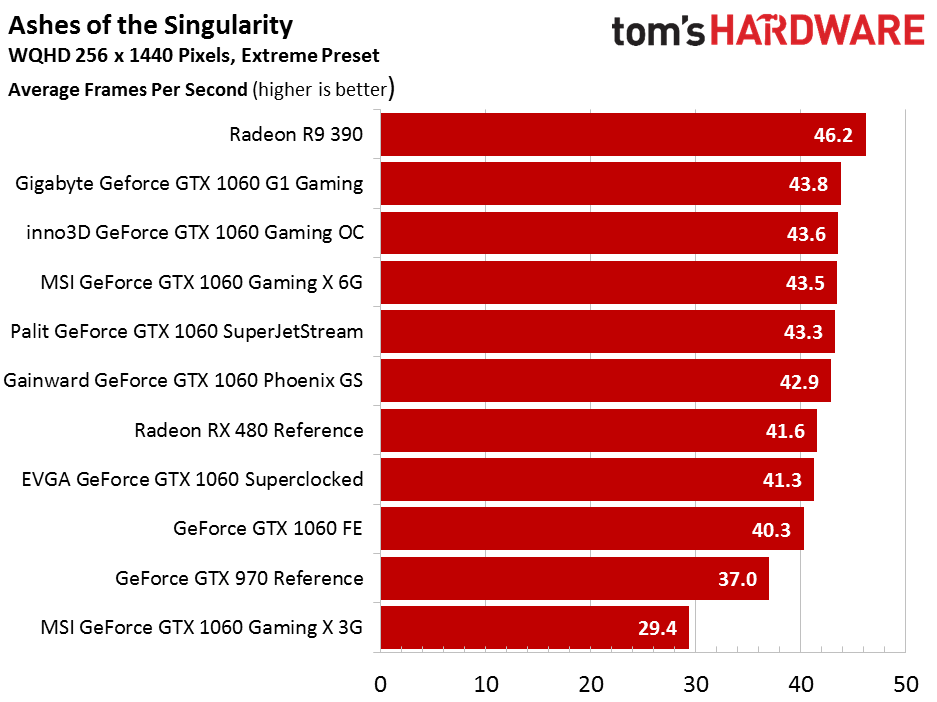
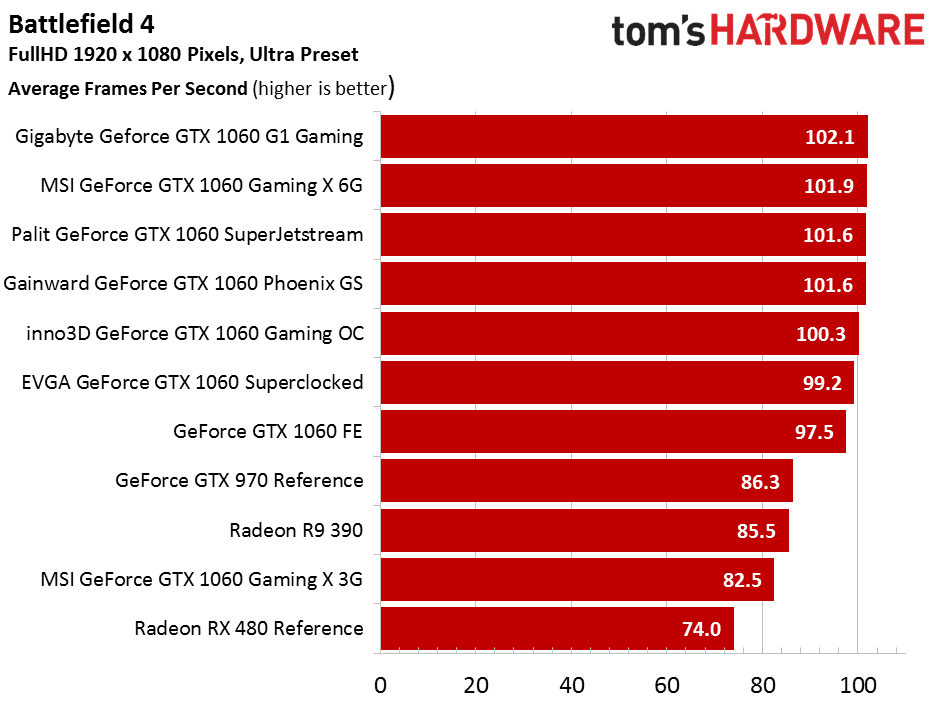
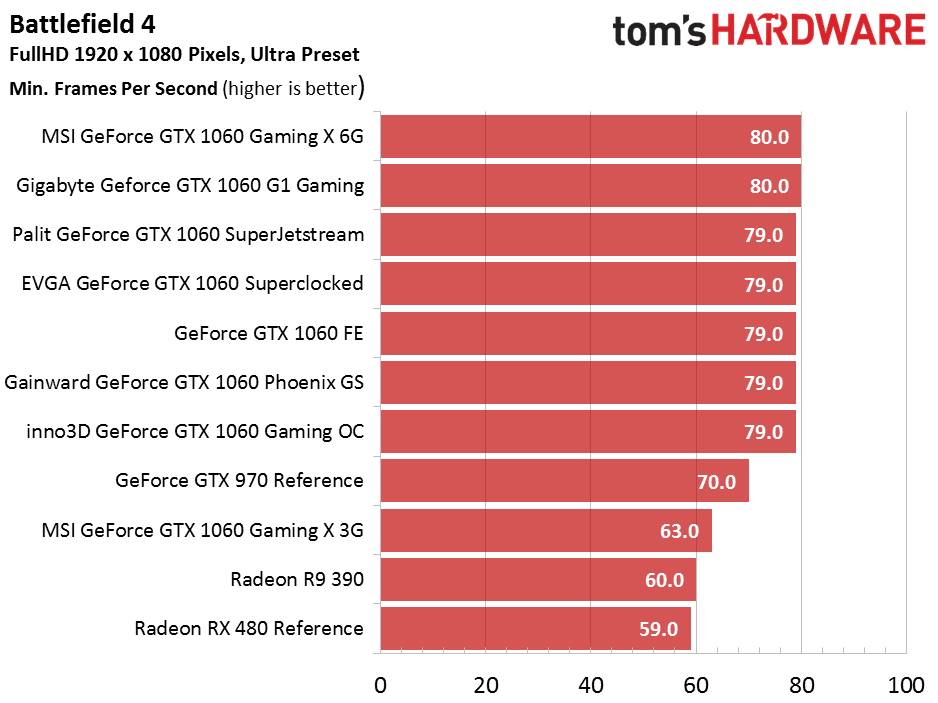
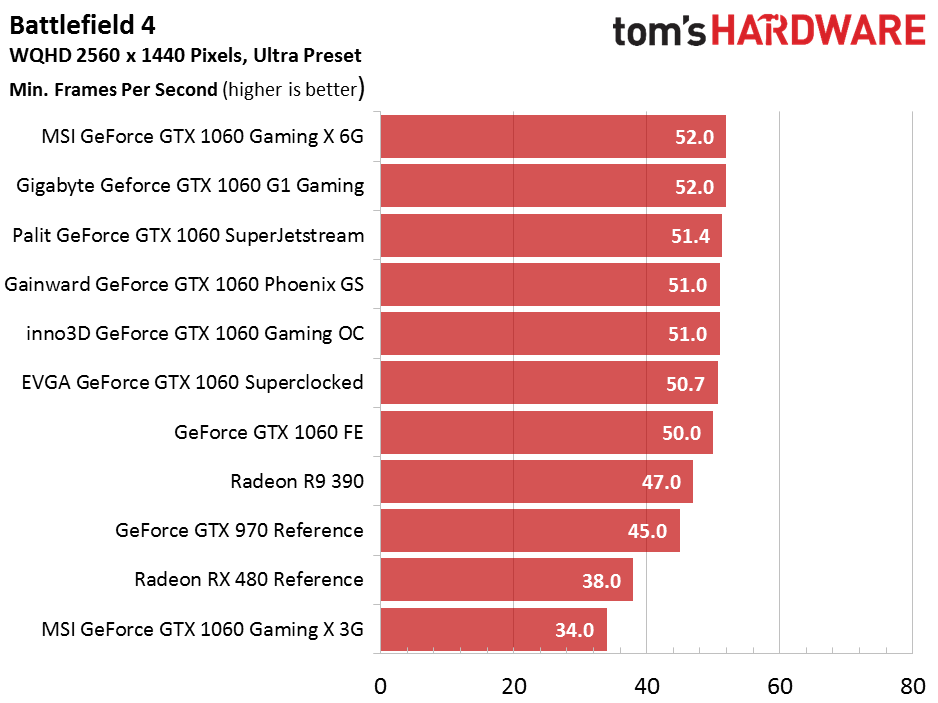
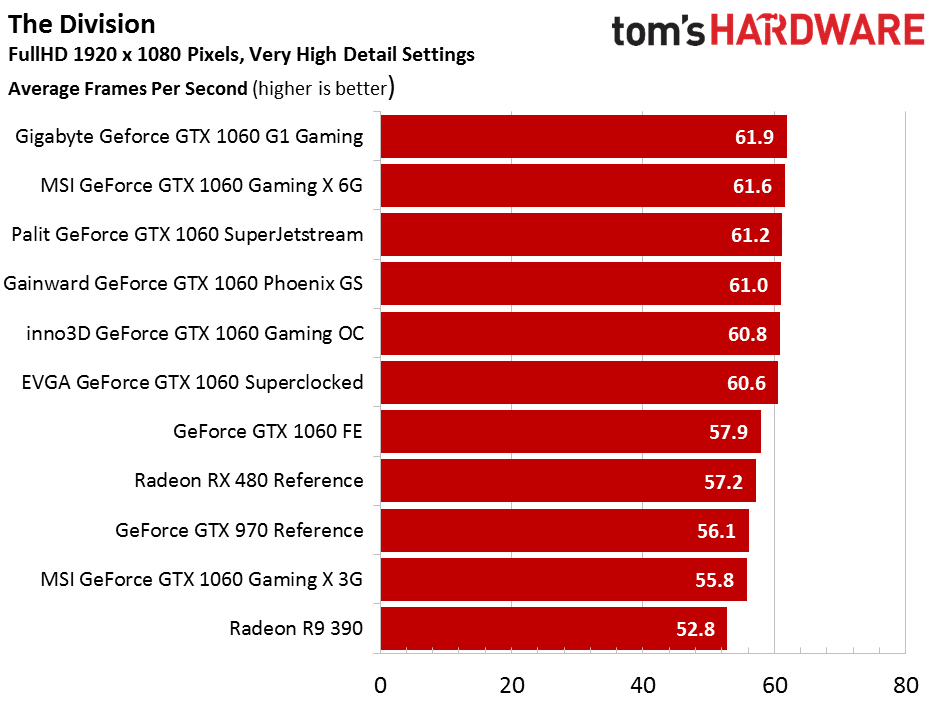
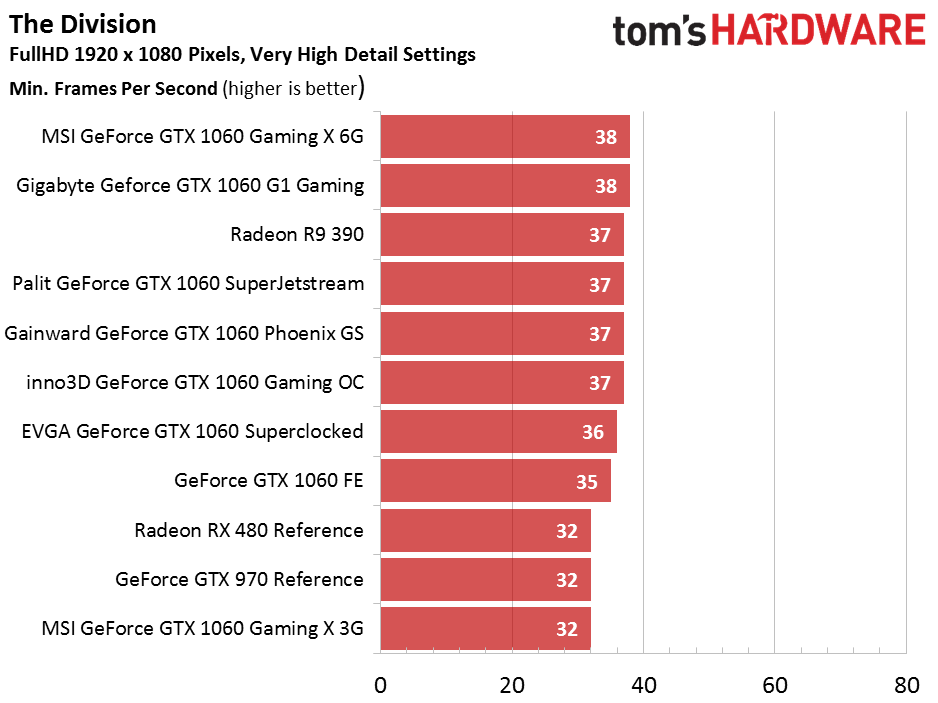
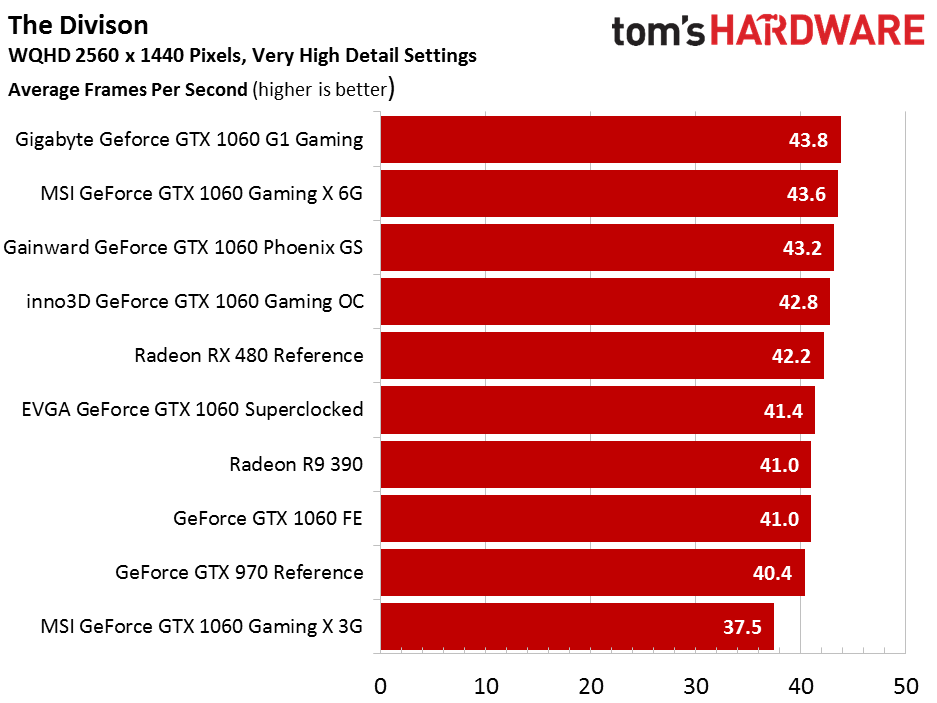
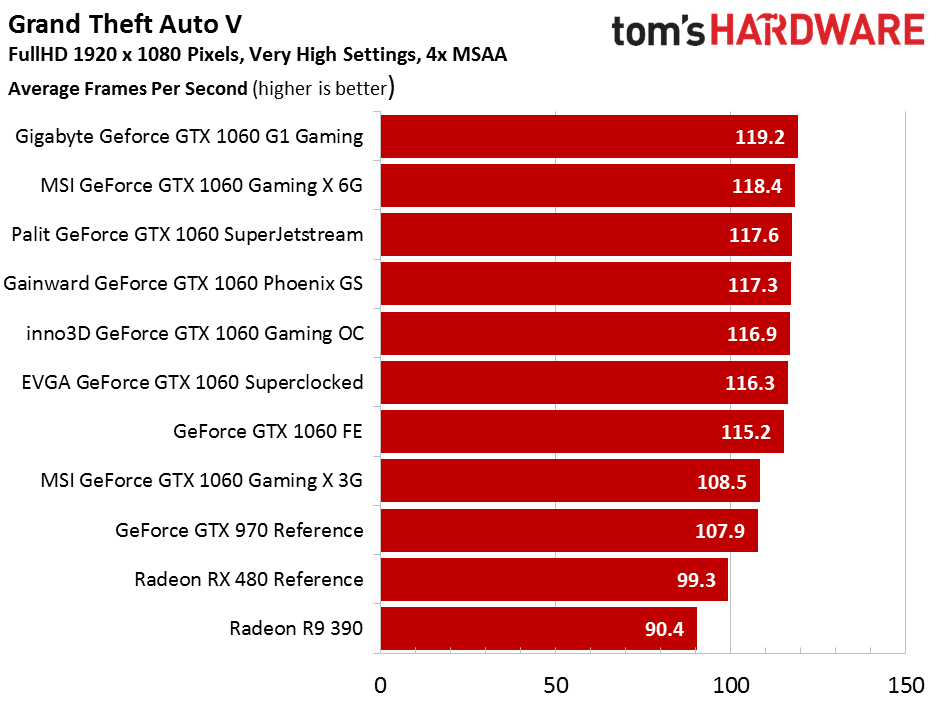
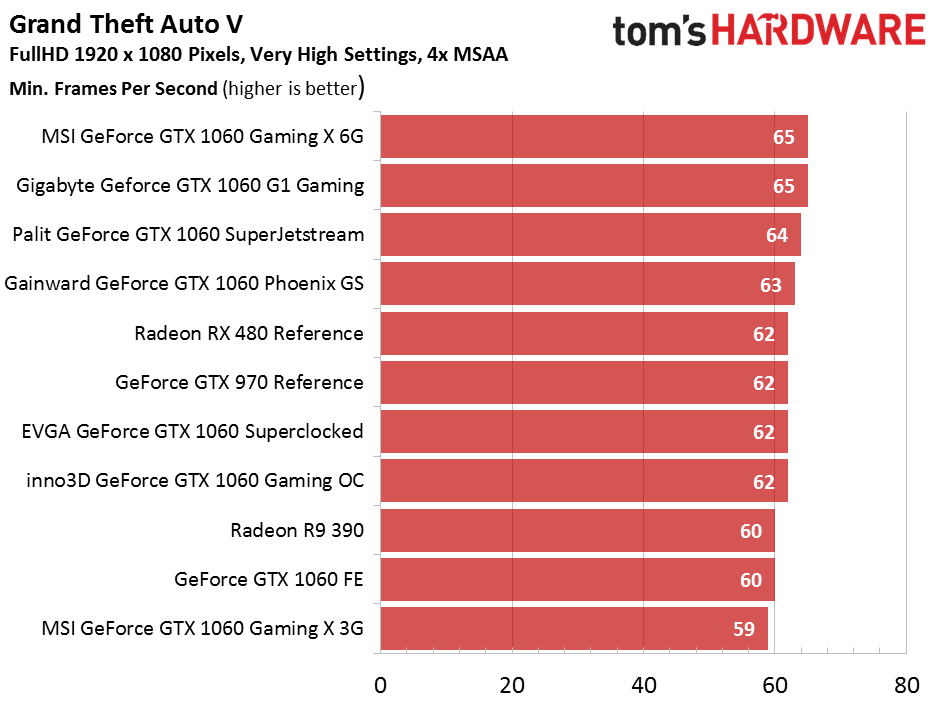
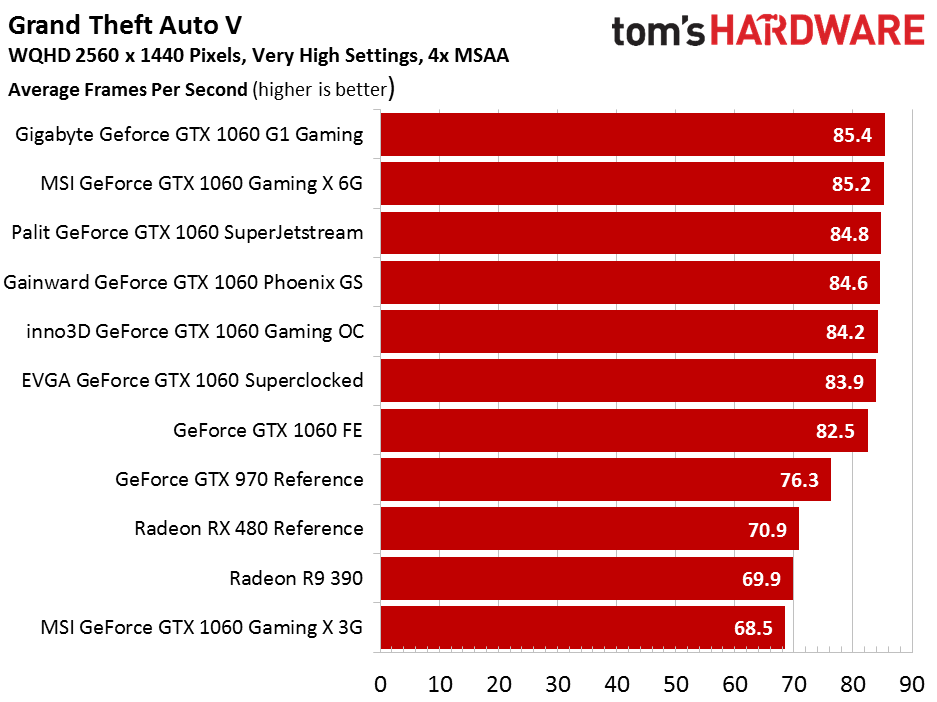
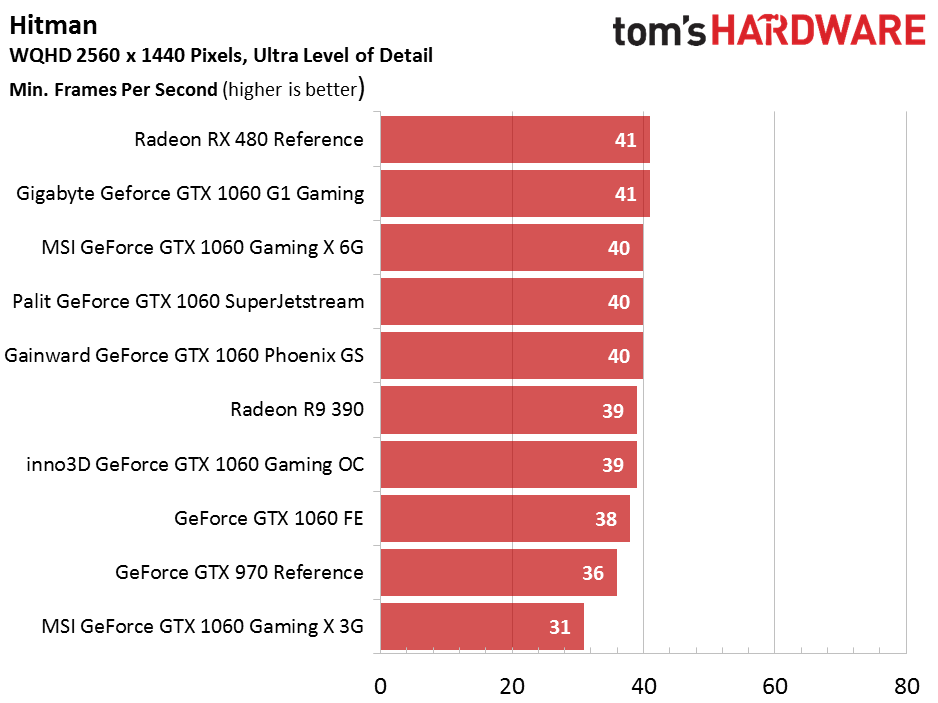
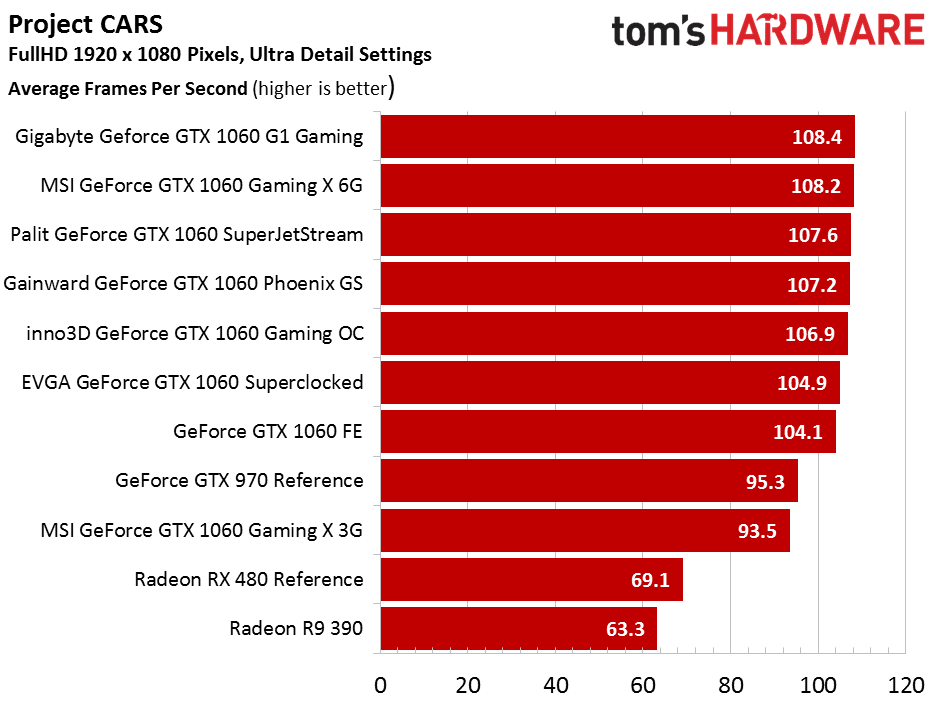
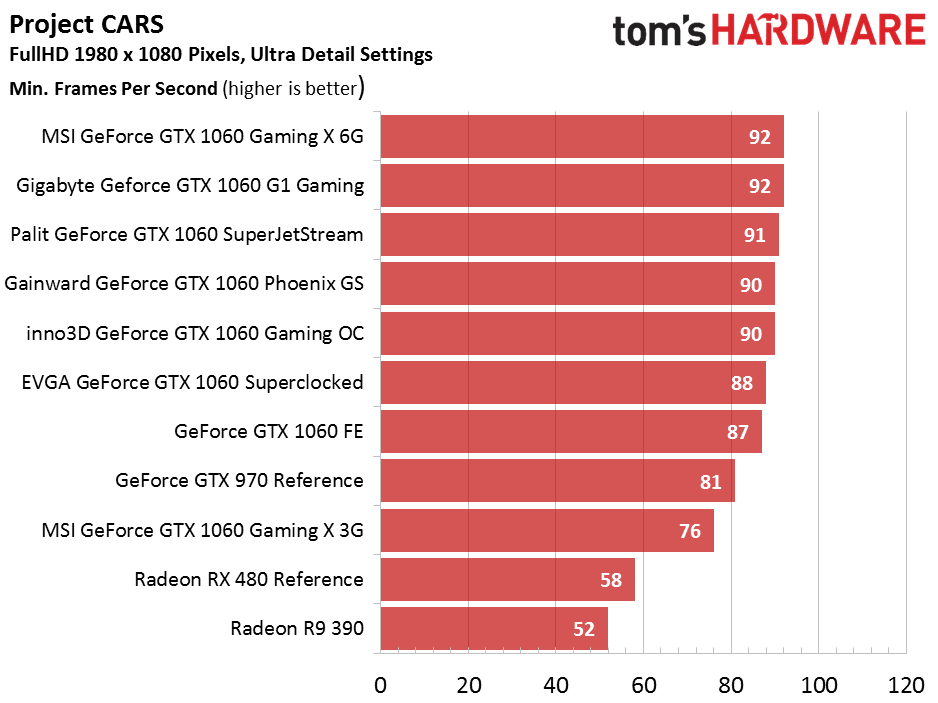
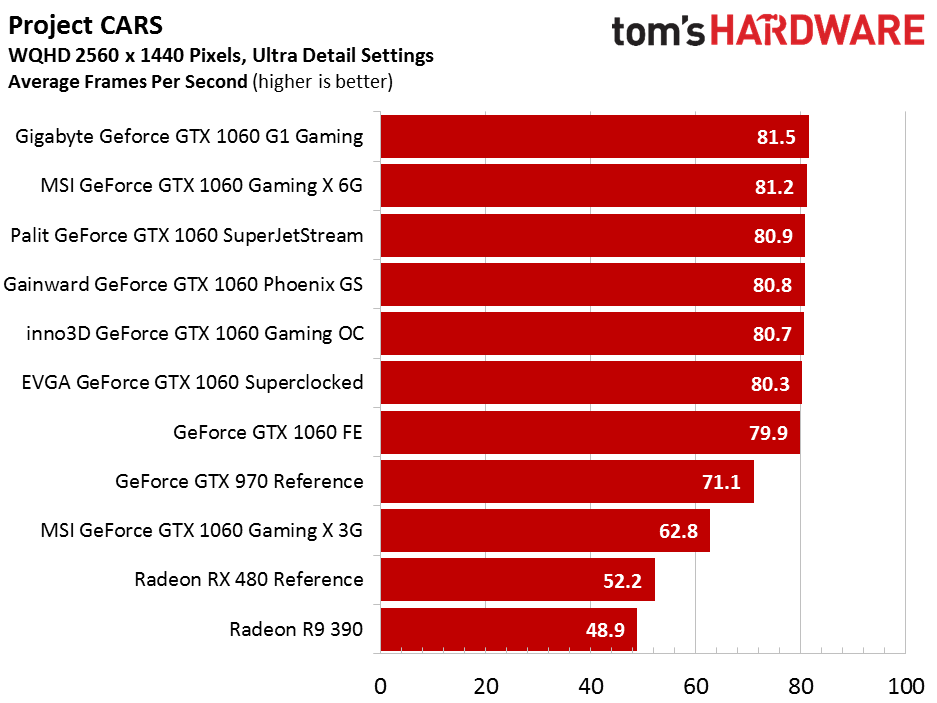
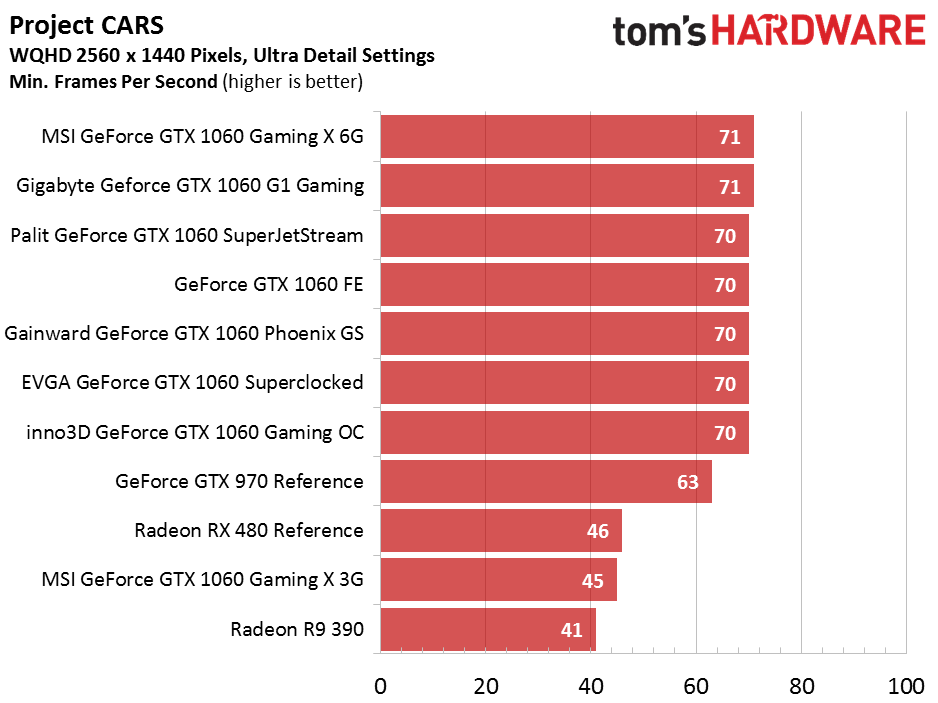
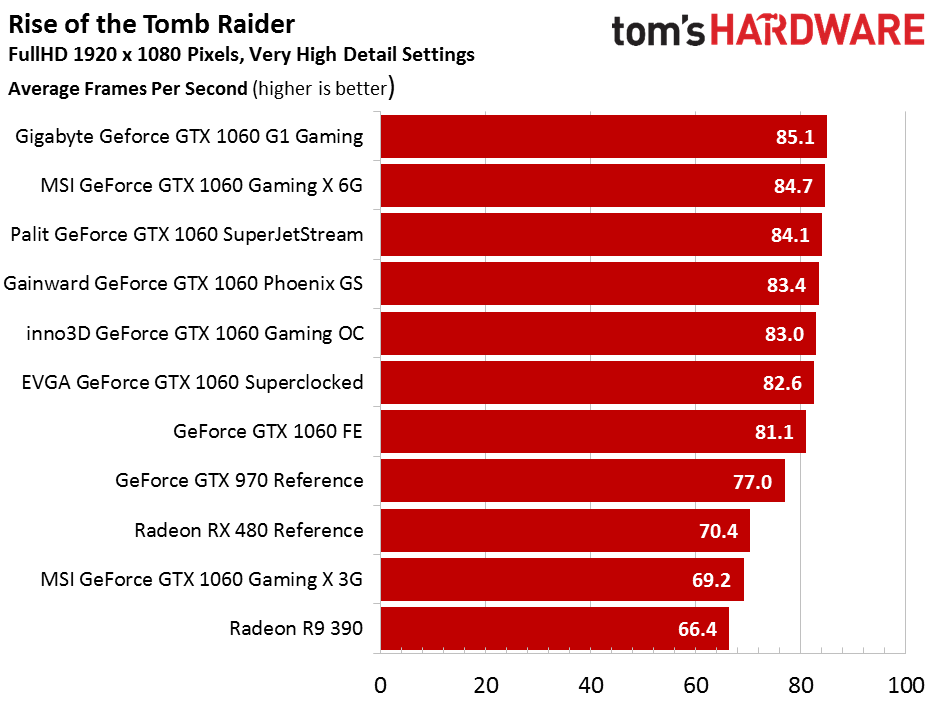
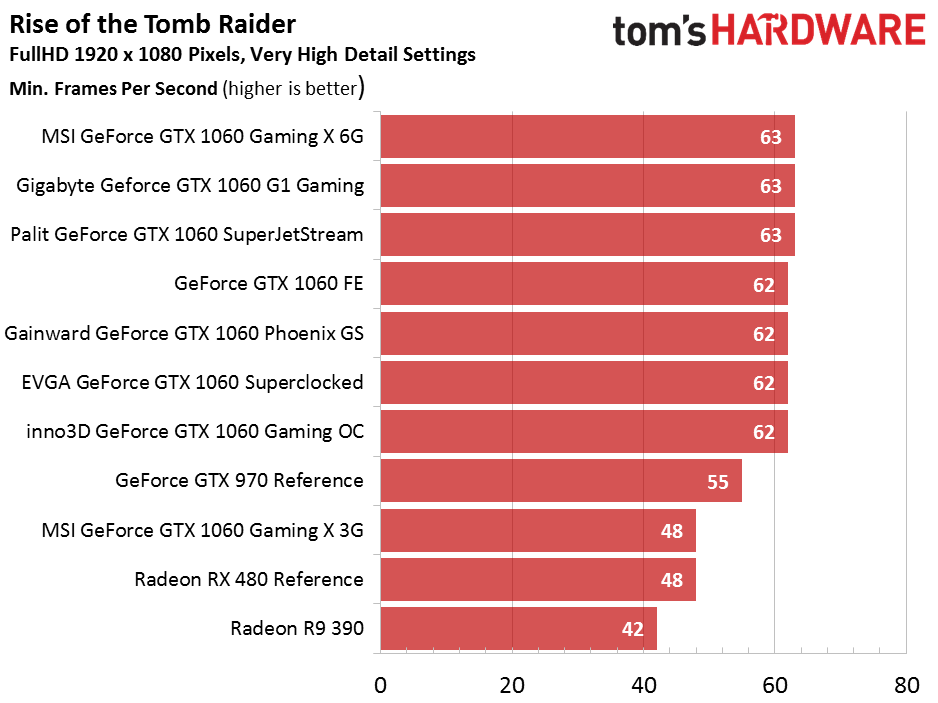
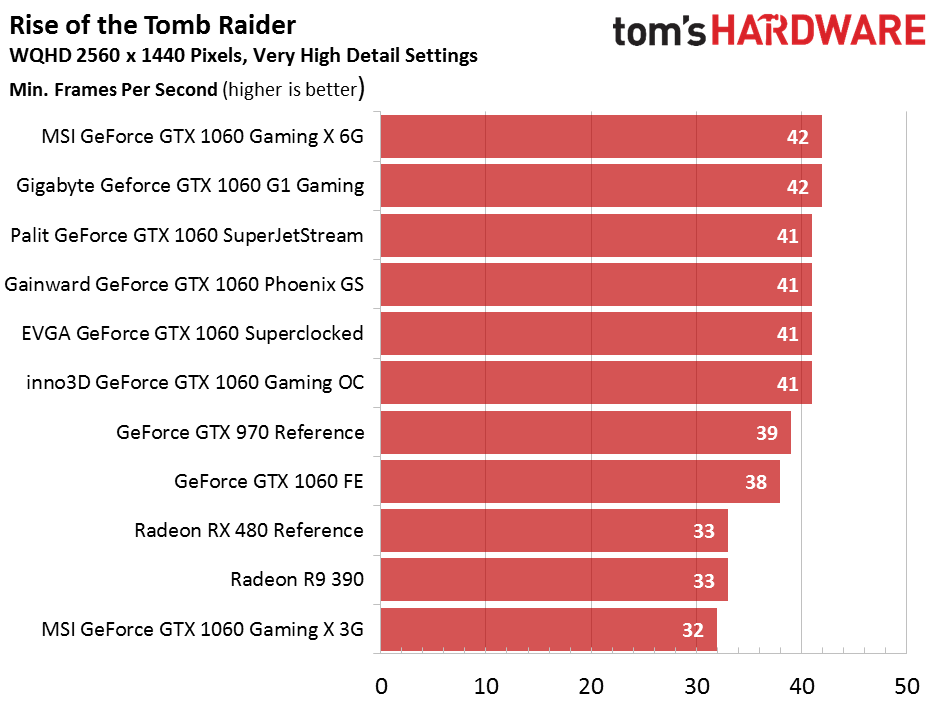
The following galleries each contain four images, covering two tested resolutions. We put our focus on QHD (2560x1440) and FHD (1920x1080), plotting out average and minimum frame rates for each resolution in separate graphs.
Ashes of the Singularity

Battlefield 4

The Division

Grand Theft Auto V
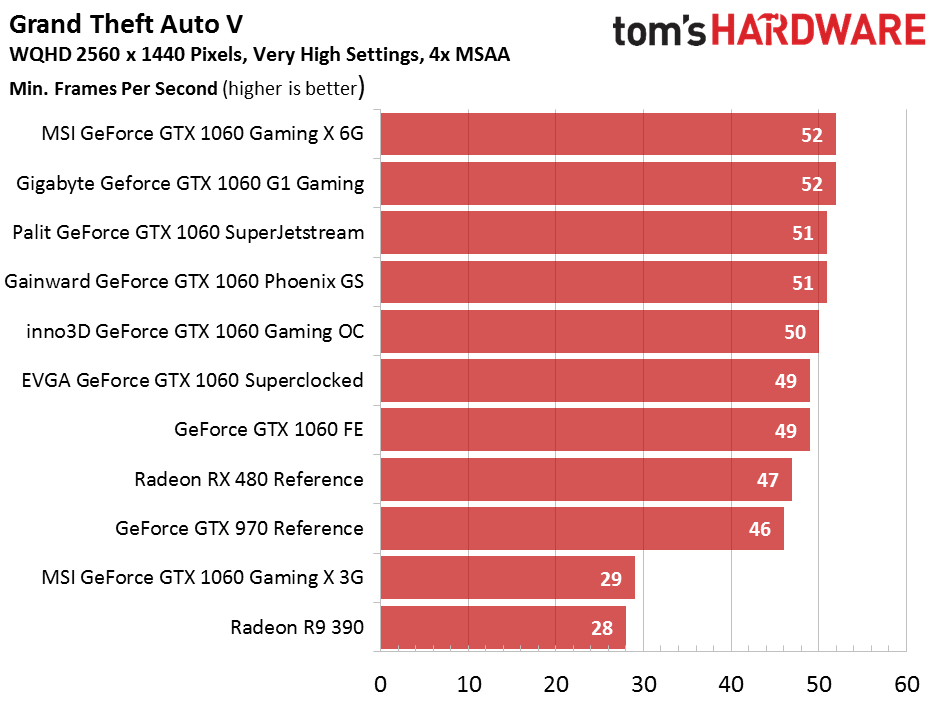
Hitman (2016)
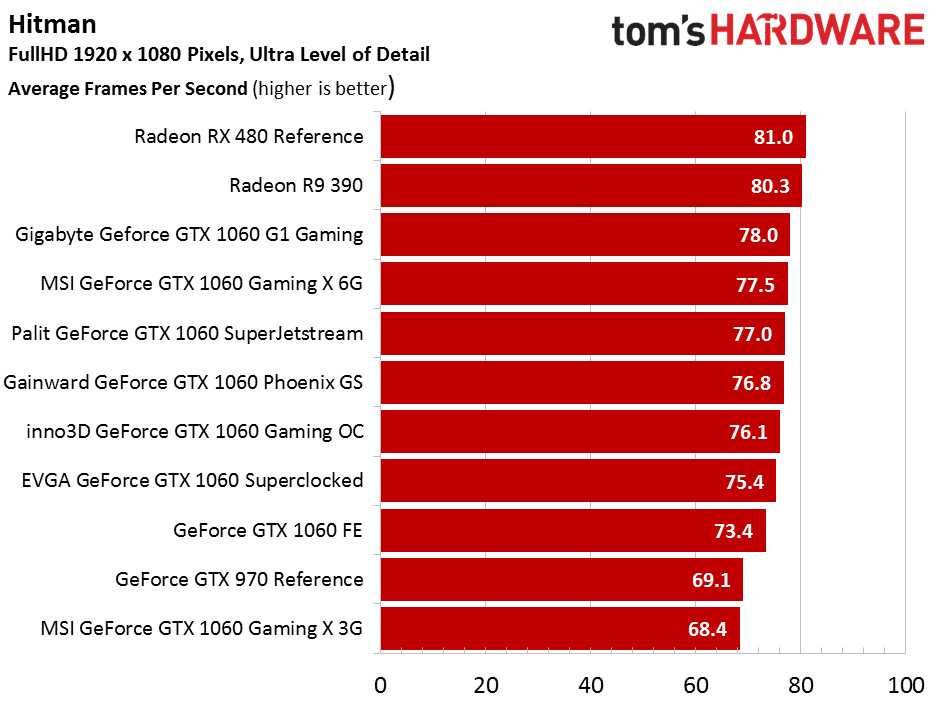
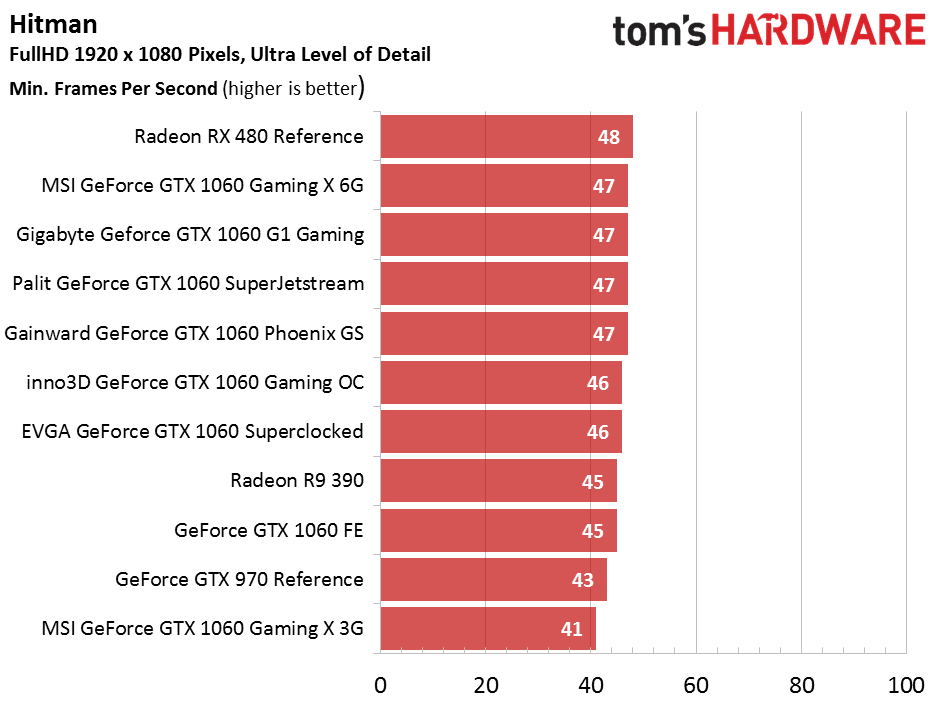
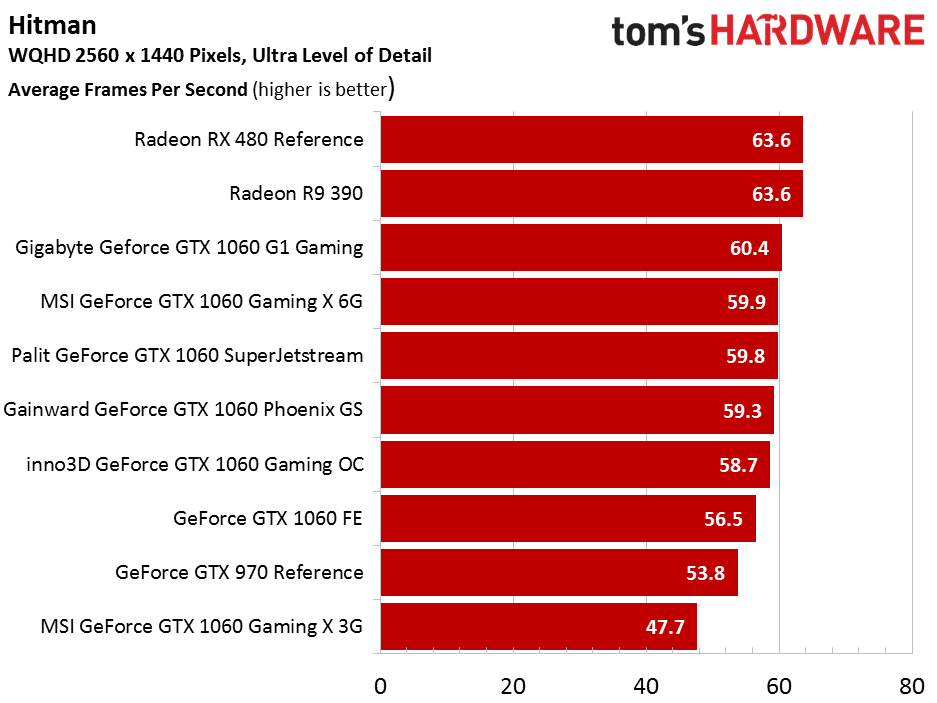
Project CARS
Rise of the Tomb Raider

The Witcher 3
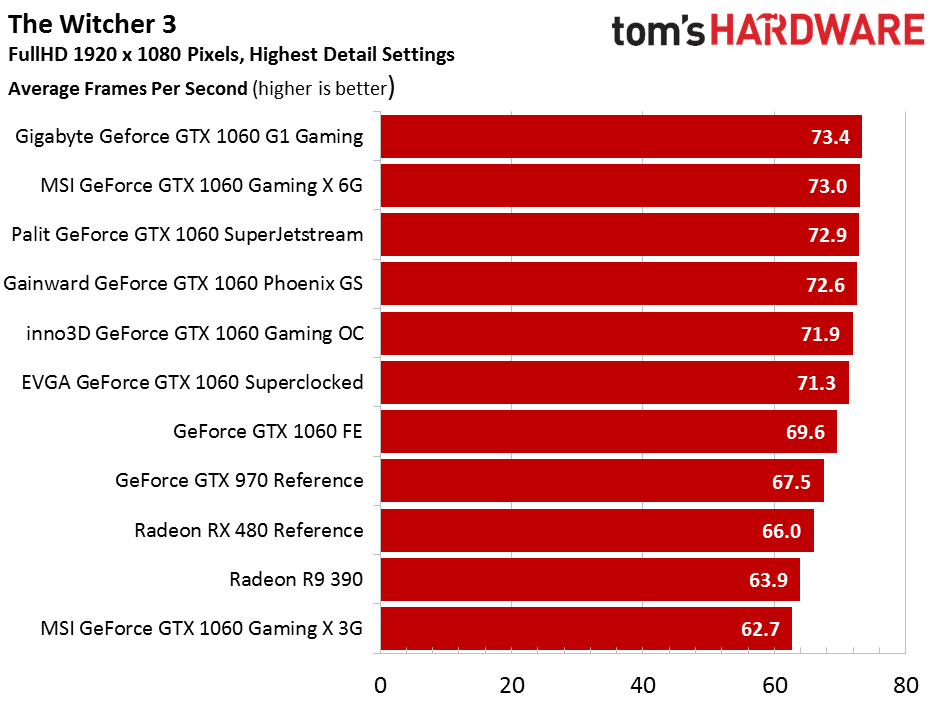
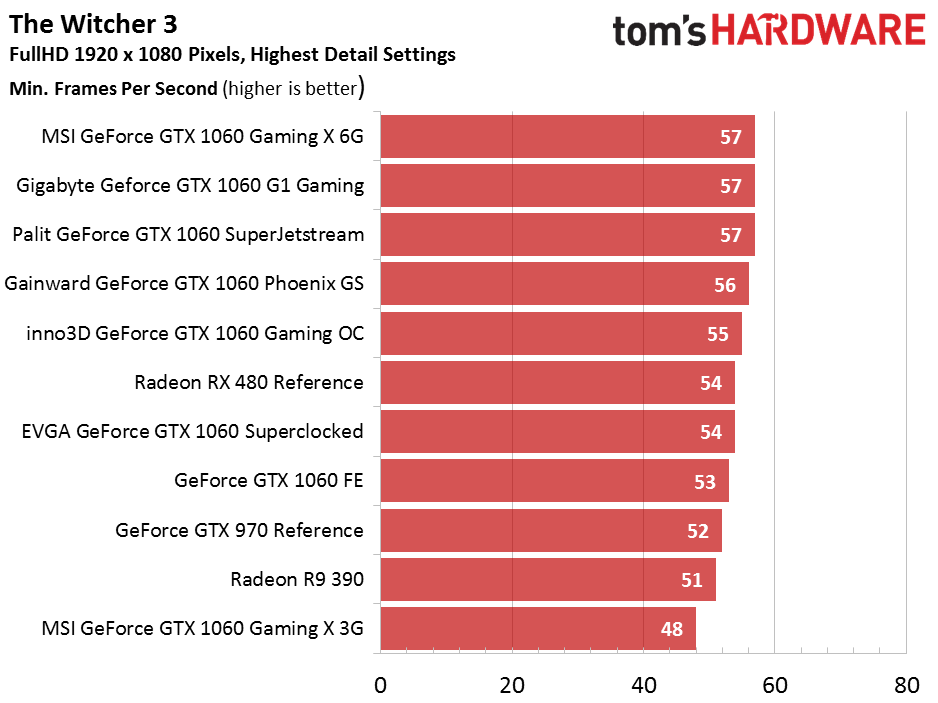
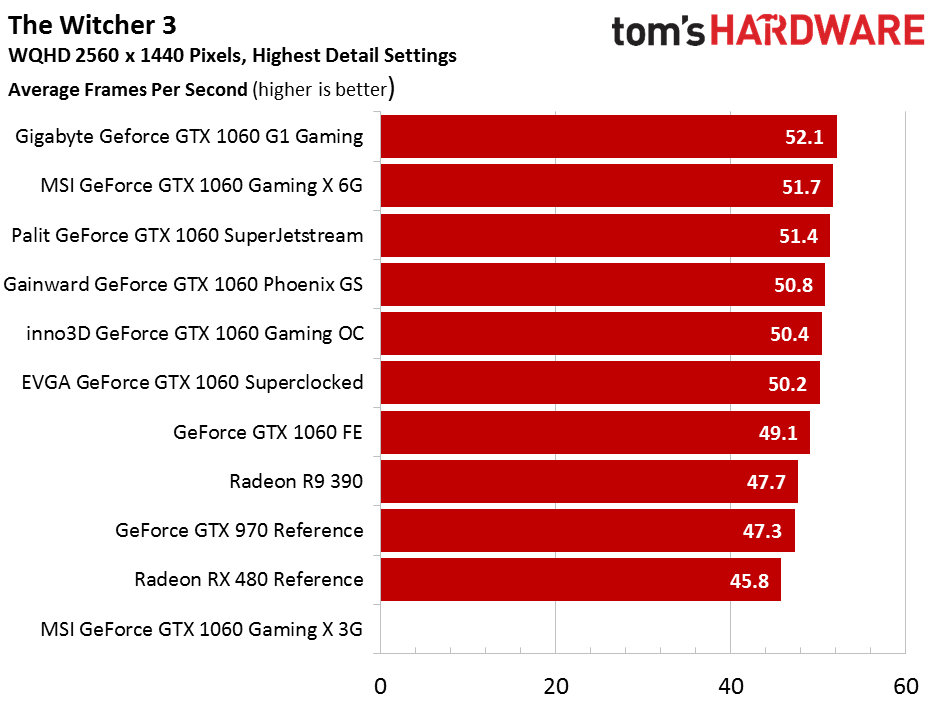

All of the factory-overclocked cards offer similar performance, more or less. That's why our primary focus centers on evaluating the more technical aspects of each board design, along with their coolers. This is where differences in noise, power, and temperatures are most likely to come from.
Power Consumption
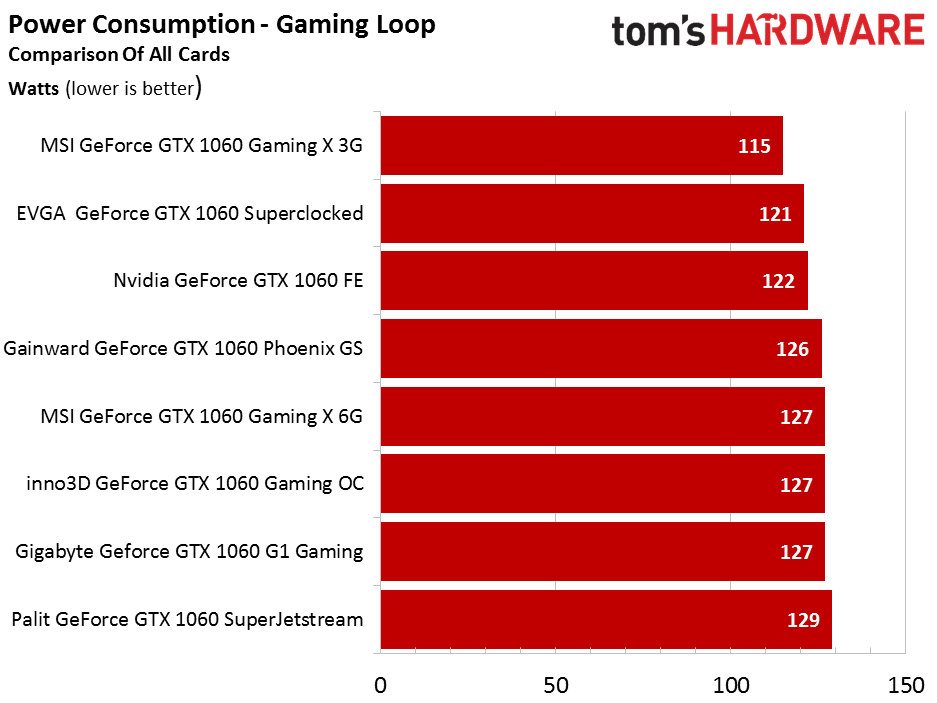
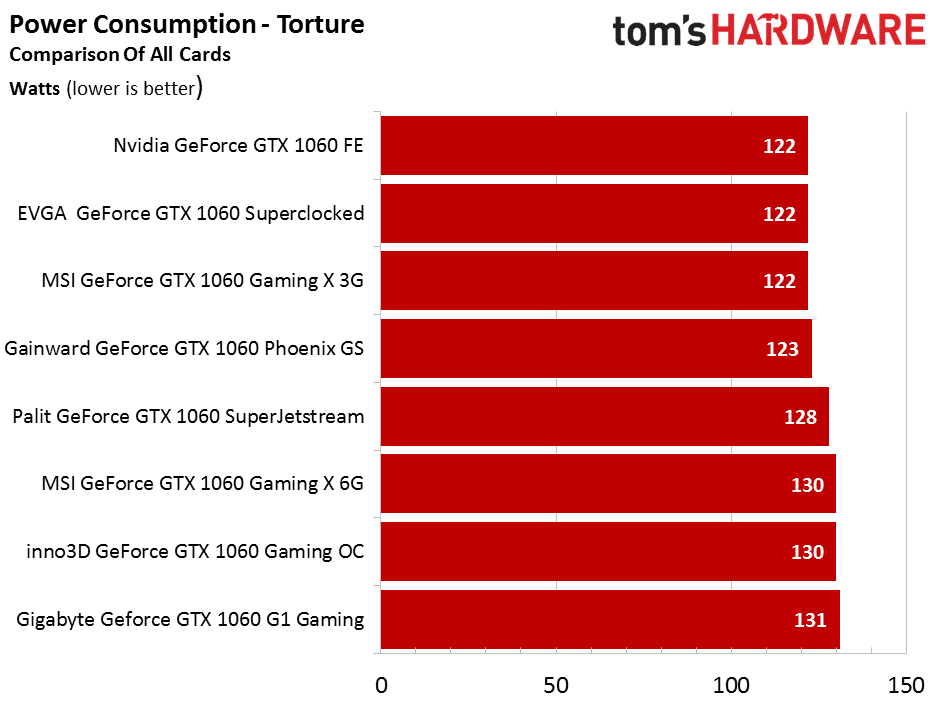
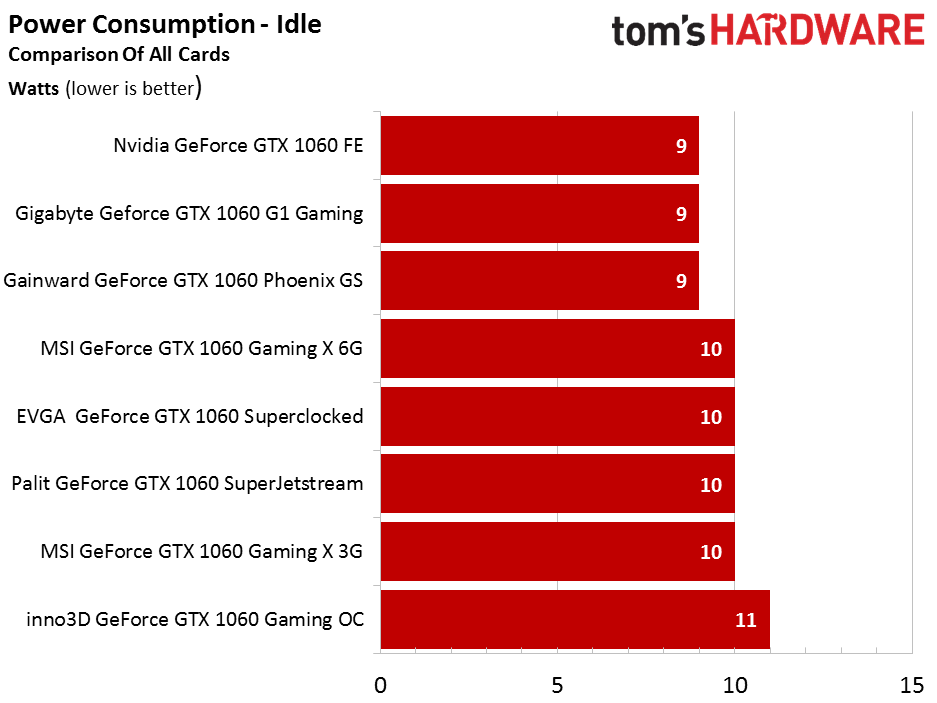
We begin by comparing the power consumption of each card in our gaming loop, stress test, and at idle. Depending on the power targets specified by each manufacturer, we sometimes measured substantial differences. We're ignoring the decimal places in our bar graphs, since those values are too small and would be within measurement tolerances.
We also found that some cards with lower power targets started to throttle during our stress test, resulting in lower power consumption numbers. This did not, however, have a negative impact on general gaming performance for any of the tested cards, as the stress test merely represents a worst-case scenario.
Noise
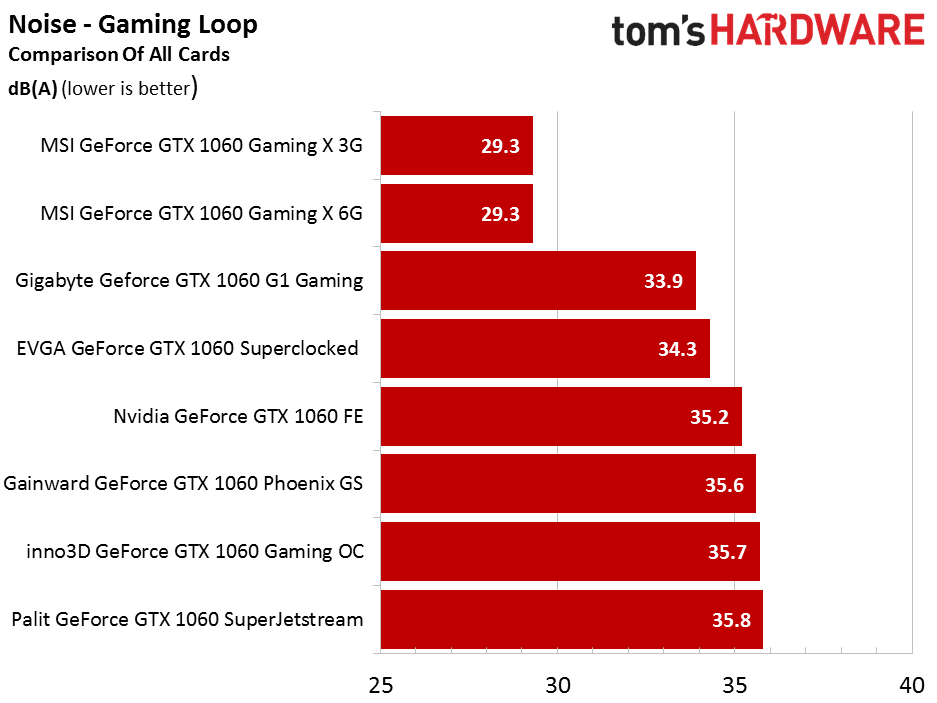
For the following comparison, we divide all of the gallery's bar graphs into gaming loop and idle, even if "noise" in practice spans a wide spectrum and the "character" of the sound varies a lot, with each card having highly individual results. Therefore, it is important not to compare just the absolute numbers, but also the frequency spectrum we're presenting.
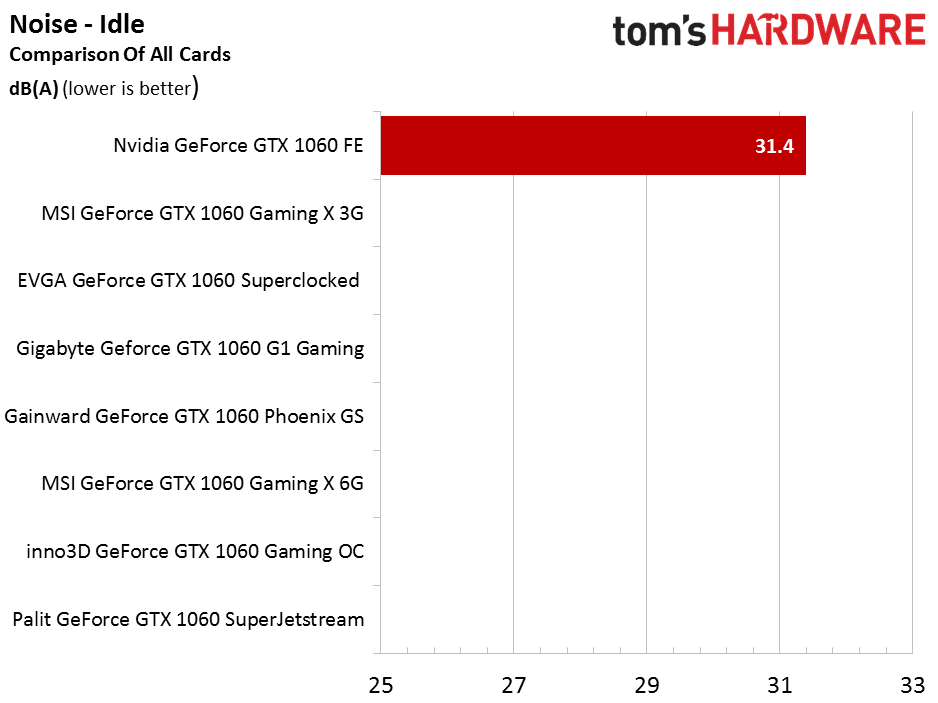
Many of the cards implement a semi-passive mode, where their fans remain off when the card is idle. Thus, we refrained from taking measurements in that state. Even in our anechoic chamber, levels of 22 dB(A) and below merely represent ambient noise.
Temperature
For this comparison, we divide the gallery's bar graphs into gaming loop, stress test, and peak temperatures measured on the MOSFETs.
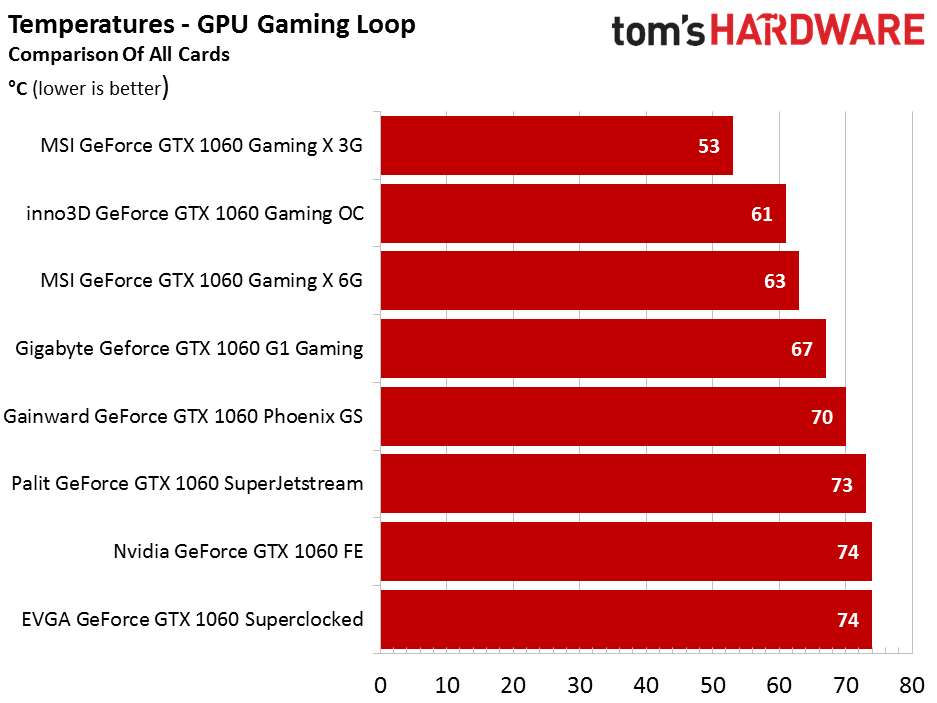
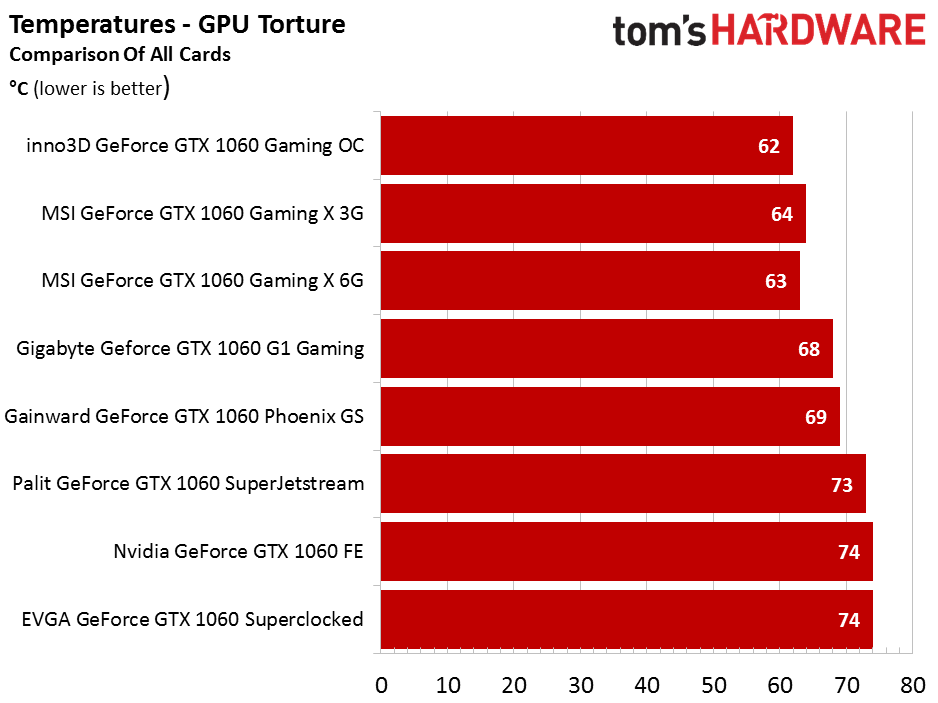
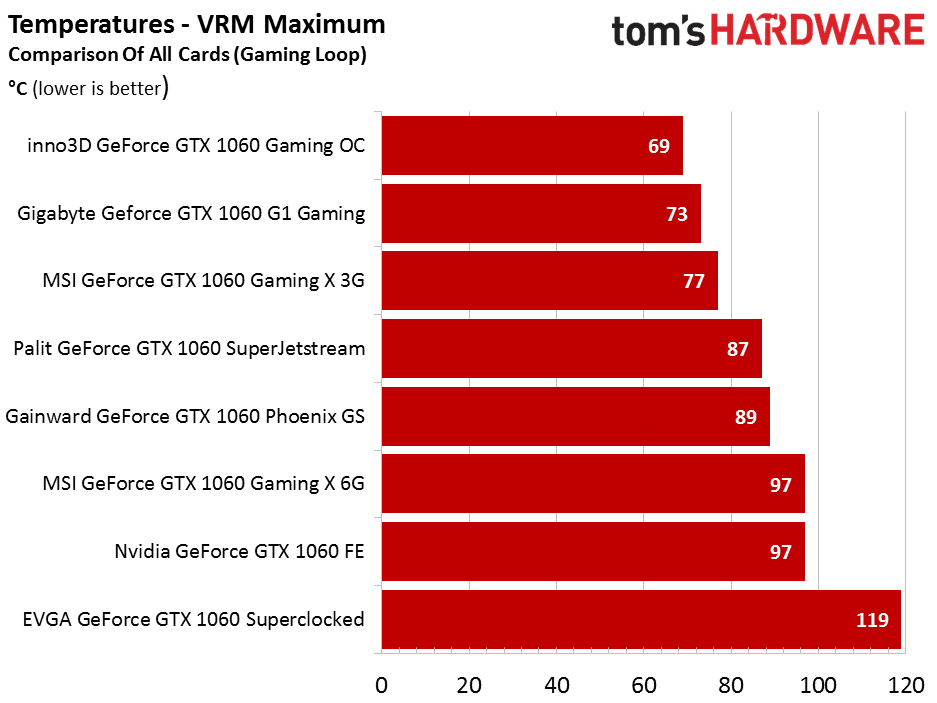
We occasionally compared the temperatures on our benchmark table with those measured inside a closed case and found them to be no more than two or three Kelvin higher.
Since temperatures in a closed case also depend heavily on the enclosure's cooling performance, the only representative and reproducible values are those measured on our benchmark table. Those are the ones we compare.
Current page: Benchmark Results
Prev Page Introduction & Overview Next Page Nvidia GeForce GTX 1060 Founders EditionGet Tom's Hardware's best news and in-depth reviews, straight to your inbox.

Igor Wallossek wrote a wide variety of hardware articles for Tom's Hardware, with a strong focus on technical analysis and in-depth reviews. His contributions have spanned a broad spectrum of PC components, including GPUs, CPUs, workstations, and PC builds. His insightful articles provide readers with detailed knowledge to make informed decisions in the ever-evolving tech landscape
-
Achaios @Igor: I really appreciate your articles. I have one small request: PLEASE consider adding benchmarks results from 3D MARK FIRESTRIKE so that we can compare your results with our GPU's. Really appreciated your "Das große Radeon RX480 Test-Roundup - Teil 1" too, though again, there are no 3D MARK FIRESTRIKE results.Reply -
bloodroses Darnit, the Zotac and Gigabyte mini models weren't covered. I was curious to see how those two compare vs. the EVGA model since I'm working with limited space inside my case.Reply -
agent88 I bought a retail MSI Geforce GTX 1060 Gaming X card last month and it was defaulted to OC mode by default. This is the same as the test version that the press received. Wondering if MSI is shipping this version to all consumers now or if I just got lucky with a "golden sample". Also, MSI provides both the MSI gaming app and afterburner software. The gaming app offers 1-click option to choose the OC mode. AReply -
shrapnel_indie Good to see a roundup... However, I think the 3GB and the 6GB belong in the same category as much as the RX-470 and RX-480 do. That is: they don't.Reply -
FritzEiv We're working on getting more cards in for all categories (1080, 1070, 1060), including from Asus, which is working on getting us cards. In fact, we'll have an update to our 1070 roundup shortly (2 new cards). And we're working on a 480 roundup as well.Reply -
mikeangs2004 Reply19457023 said:Darnit, the Zotac and Gigabyte mini models weren't covered. I was curious to see how those two compare vs. the EVGA model since I'm working with limited space inside my case.
they are kind of for the niche market just like in the days of low profile units -
Ancient1 Regarding the EVGA GTX 1060 SC :Reply
Could someone who disassemble it post the measurements ( WxHxL ) of the HEATPIPE ?? I plan on carving a Copper Heatsink, rather than Thermal Pads.
I am also thinking about HS for the memory etc , along the Pipe. But it will impact AirFlow and might degrade the HeatPipe efficiency as , to my knowledge, Heatpipe depends on temperature difference between the cooled GPU and the Heat Expelling (to the fins) areas of it.
Please post, Google will find it :)
Thanks in advance