System Builder Marathon Q2 2014: System Value Compared
Results: Overall Performance And Efficiency
Efficiency is where work meets power. This is all theoretical of course, since no physical work is being done by a CPU. It’s not like you use all those numbers to spin a wheel.
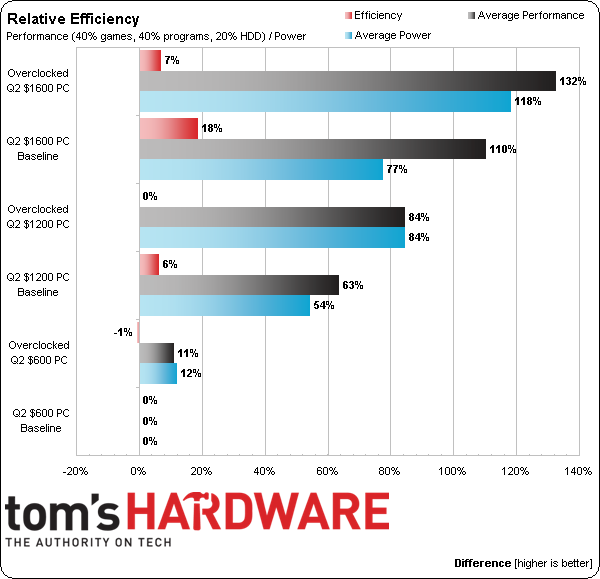
Since we’re calculating theoretical (rather than actual) efficiency, we need a baseline by which other products can be compared (or related, as shown in the title “Relative Efficiency” in the second chart). Since the lowest-performance PC and the lowest-energy PC are the same $600 unit, it becomes our baseline.
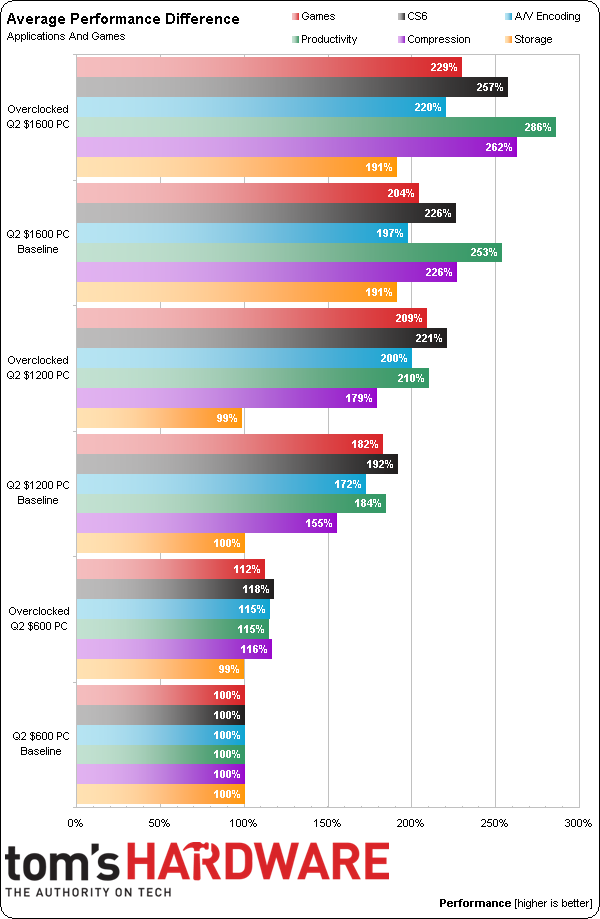
A peek at the raw data tells us where the wind will blow in the “Value” charts on the next page, since the double-priced $1200 machine is rarely twice as fast as the $600 system. But before we get there, we still have that long-discussed efficiency chart to discover.
Since efficiency can’t exceed 100%, the 100% baseline is subtracted from the chart above to make it zero. The resulting numbers are all relative, as in the $1600 PC achieves 18% more efficiency compared to the $600 PC.
Increased frequencies and voltages drive down the efficiency of all three overclocked machines, whereas a lesser overclock at stock voltage might have caused efficiency to climb by allowing more work to be accomplished with little additional energy.
Get Tom's Hardware's best news and in-depth reviews, straight to your inbox.
Current page: Results: Overall Performance And Efficiency
Prev Page Results: Power And Heat Next Page Our System Builder Marathon, By The Numbers


