Samsung Galaxy S5 Smartphone Review
Will the gravity well from Galaxy S5 capture your interest, or will you streak past with escape velocity?
Why you can trust Tom's Hardware
Results: GPU Core Benchmarks
3DMark (Anti-Detection)
Futuremark has become a name synonymous with benchmarking, and the company's latest iteration of 3DMark offers three main graphical benchmarks: Ice Storm, Cloud Gate and Fire Strike. Currently, the DirectX 9-level Ice Storm tests are cross-platform for Windows, Windows RT, Android and iOS.
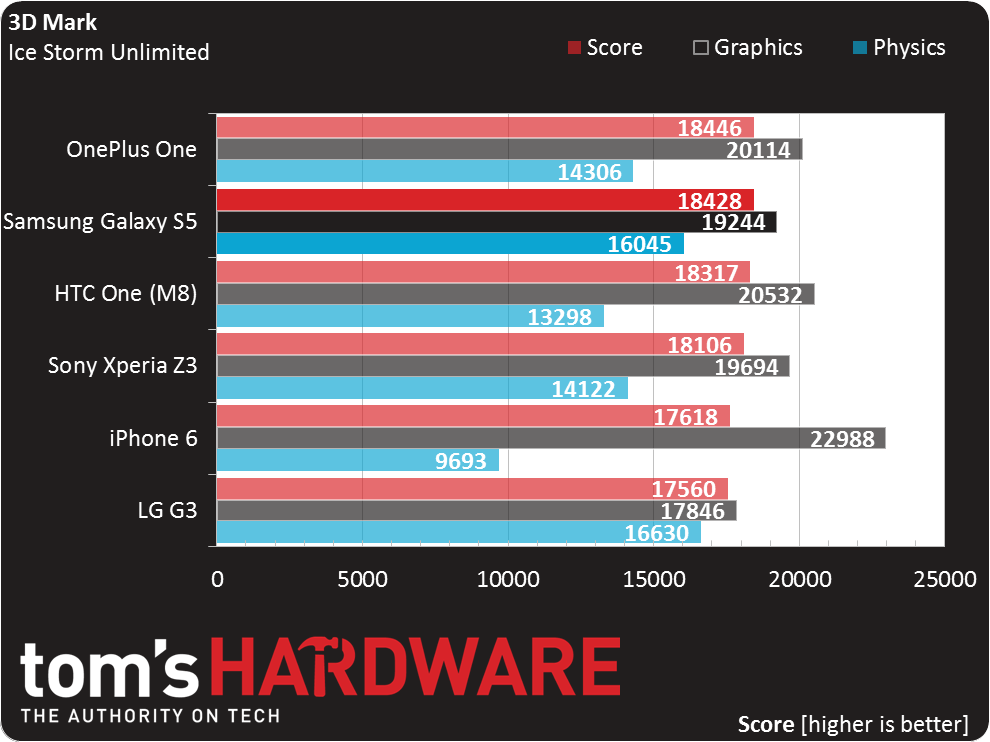
Ice Storm simulates the demands of OpenGL ES 2.0 games using shaders, particles and physics via the company's in-house engine. Although it was just released in May of 2013, the on-screen portions of Ice Storm have already been outpaced by modern mobile chipsets, with Nvidia's Tegra 4 and Qualcomm's Snapdragon 800 both easily maxing-out the Extreme version (1080p with high-quality textures). However, Ice Storm Unlimited, which renders the scene off-screen at 720p, is still a good gauge of GPU-to-GPU performance.
The iPhone 6 and its newer PowerVR Rogue GPU post the best Graphics score in this benchmark. Of the devices using the older Adreno 330 GPU, the HTC One (M8) shows a slim lead, pulling ahead of the S5 by 7%. The LG G3 falls behind the HTC by a more noticeable 15%.
In the multi-threaded, CPU-focused Physics test, the HTC One (M8) trails its Snapdragon 801 peers as expected (due to its lower CPU clock), and the S5 scores well, which agrees with the Multi-Core Geekbench results. The one outlier is the G3, which posts the highest score in the Physics test. This is at odds with the Multi-Core Geekbench test, where the G3 didn't fully utilize all four of its cores at max frequency. Monitoring CPU usage during the 3DMark Physics test confirms the G3 does not limit CPU use and runs all four cores at max frequency. Another interesting twist is that while the G3 for the Canadian market (shown in the charts) scores 16630, the U.S. version on Sprint scores 6% lower (15713), slower than the S5. This same U.S. G3 also scores 18% lower than the Canadian model in the Multi-Core Geekbench Integer test, while the Floating Point and Memory scores are the same. Perhaps this is just statistical error based on our limited sample size, or maybe we're seeing the effect of OEMs tuning devices for specific markets, emphasizing performance in one market and power efficiency in another.
Basemark X 1.1
Based on the Unity 4.0 game engine, Rightware’s Basemark X is a cross-platform graphics benchmark for Android, iOS and Windows Phone 8. This test utilizes Unity’s modern features via the OpenGL ES 2.0 render path to simulate how a modern game might look and run. Basemark X is an aggressive metric that still hasn’t been maxed out by the latest mobile SoCs.
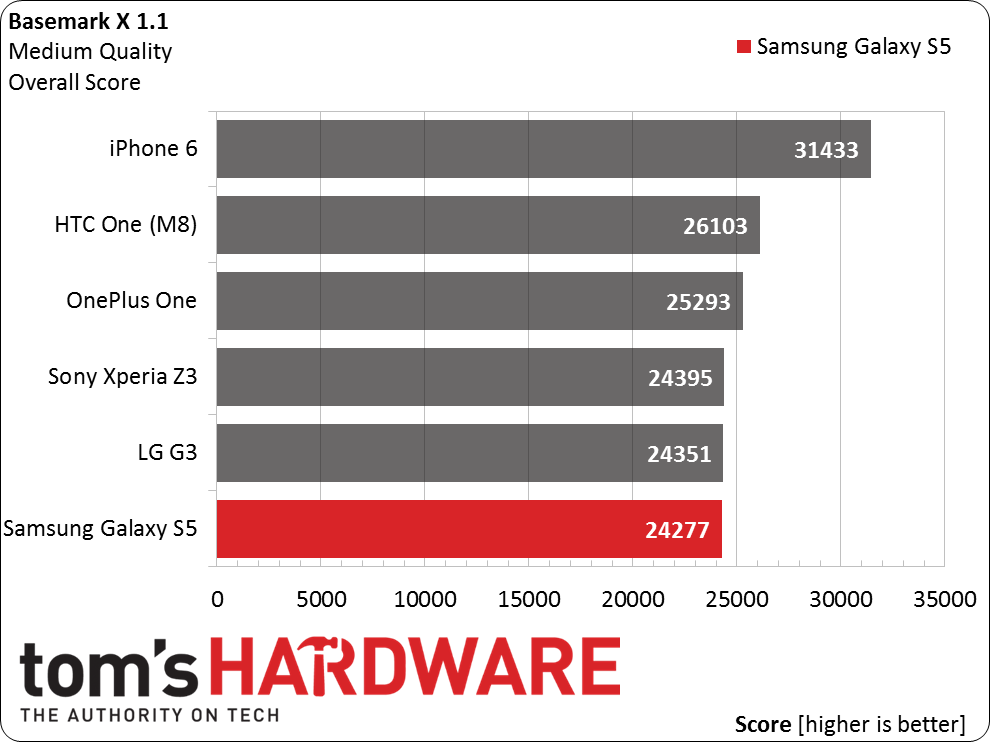
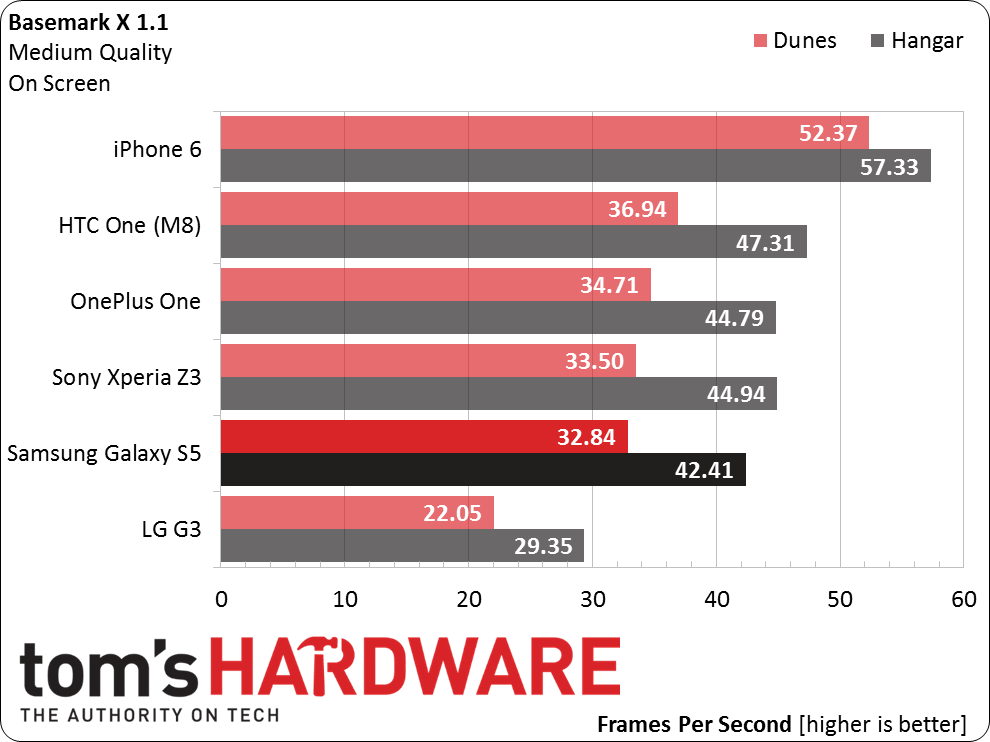
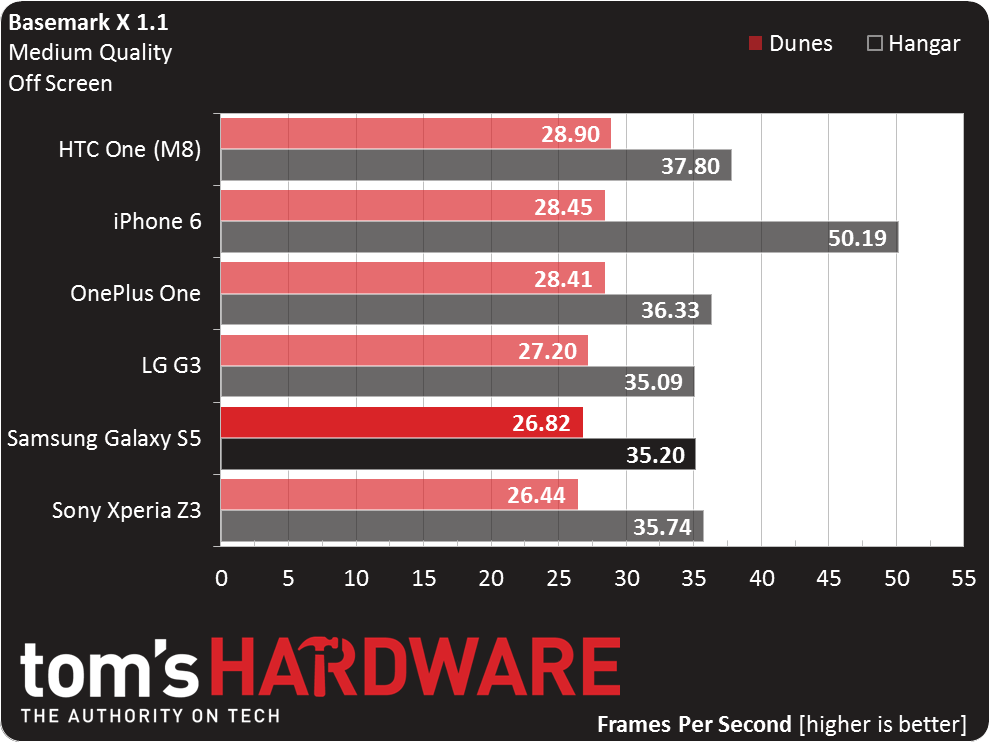
The on-screen results for the iPhone 6 Plus are not accurate, since the current version of this benchmark doesn’t support its native resolution. Instead, it renders at the native resolution of the 5s (640x1136). The Overall scores are not affected by this issue though, since they are based on the off-screen rendering tests.
All of the Adreno 330-equipped devices fall within 8% of each other when looking at the overall score, with the S5 turning in the lowest value. While this difference isn't significant, it is consistent. The HTC One (M8) posts the highest scores in every test, with the S5 falling just shy of its mark.
Get Tom's Hardware's best news and in-depth reviews, straight to your inbox.
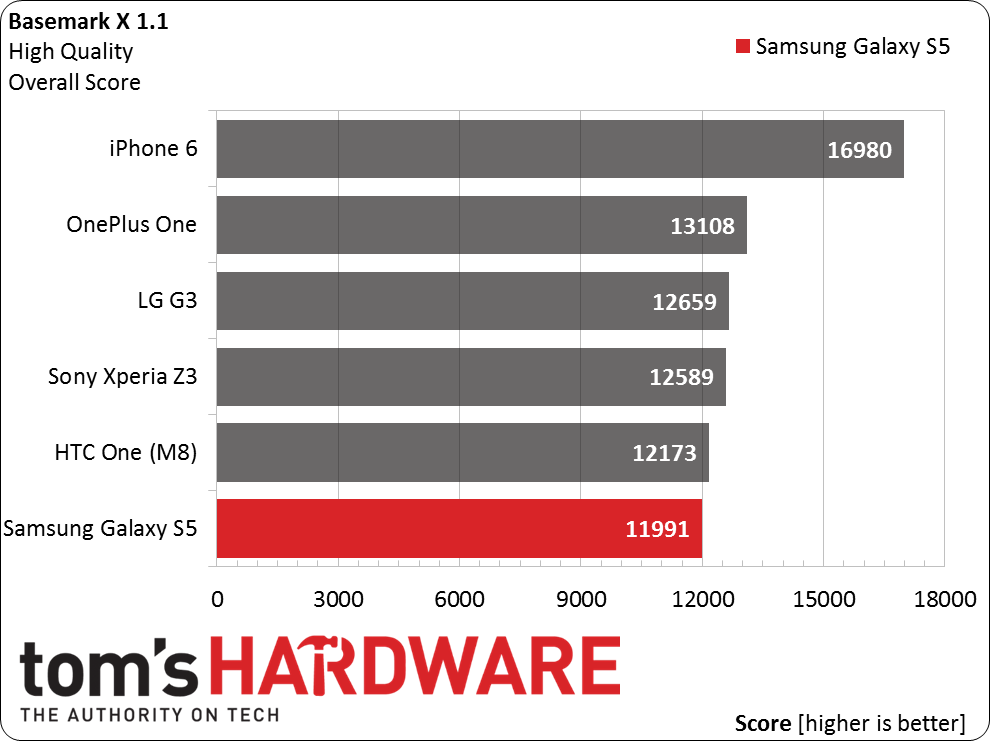
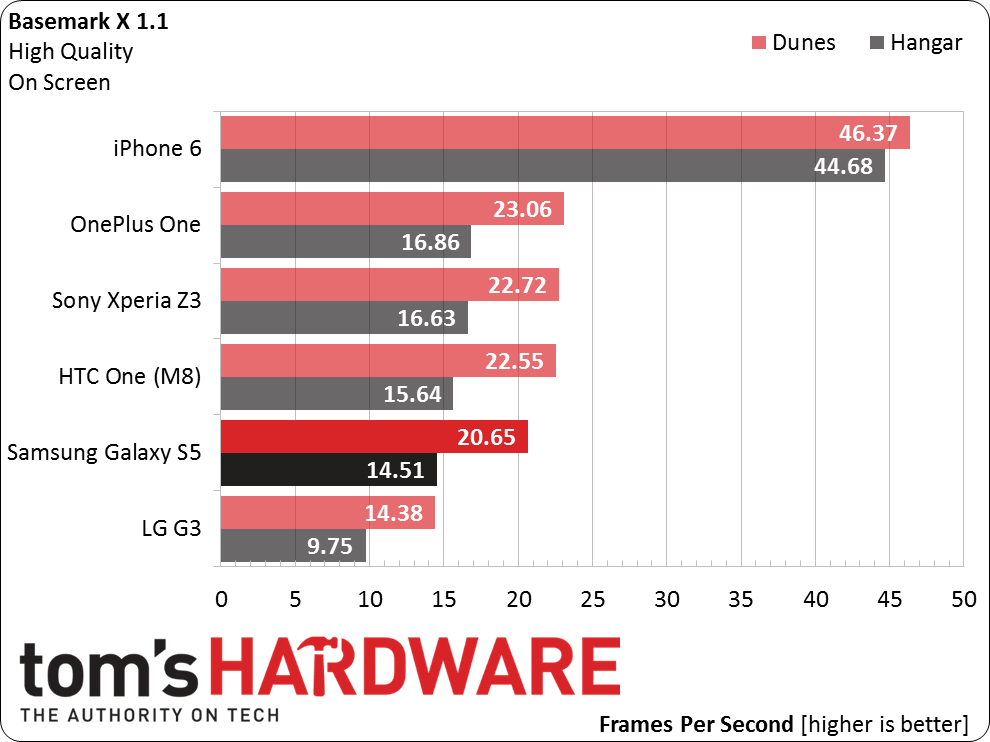
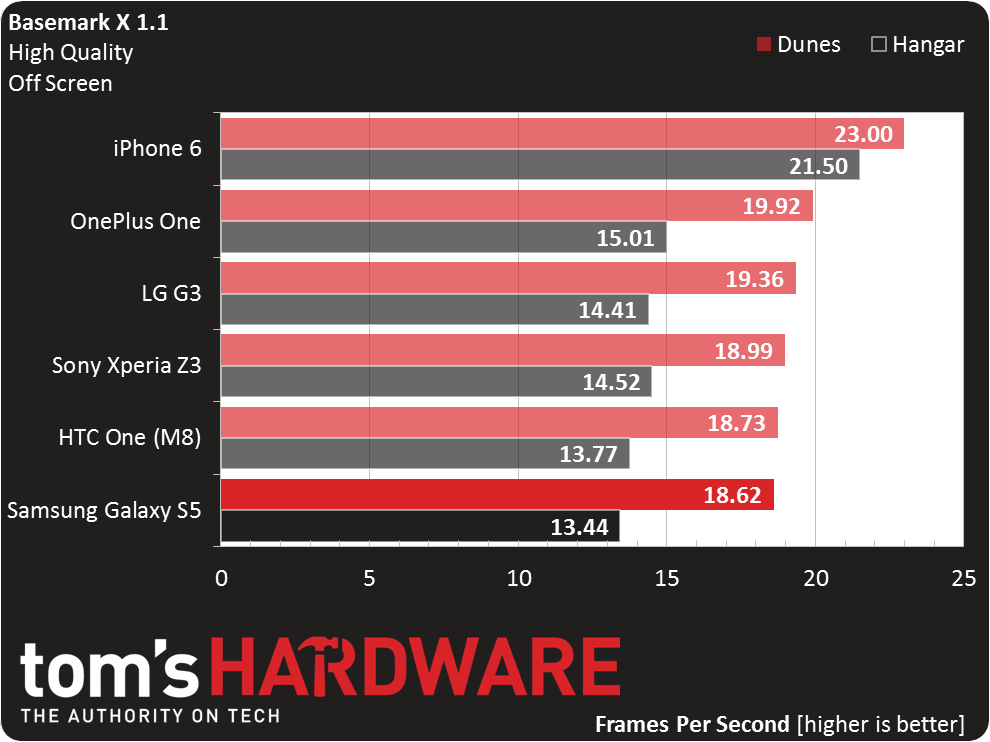
The OnePlus One's slightly better memory bandwidth (shown in the AndEBench tests) helps it post a better overall score in the high-quality tests. Again, the difference isn't much, there's only a 9% spread between it and the S5, but the results consistently show the OnePlus One scoring slightly better and the Galaxy S5 with the lowest scores.
GFXBench 3.0 Corporate
Kishonti GFXBench 3.0 is a cross-platform GPU benchmark supporting both the OpenGL ES 2.0 and OpenGL ES 3.0 APIs. It comprises both “high-level” game-like scenarios, along with more “low-level” tests designed to measure specific subsystems.
Among the high-level tests are Manhattan and T-Rex. Manhattan is a modern, complex OpenGL ES 3.0-based test, while the OpenGL ES 2.0-level T-Rex is a holdover from GFXBench v2.7.
The low-level tests include Fill, which measures fill rate by rendering four layers of compressed textures; Alpha Blending, a test that renders layers of semi-transparent quads using high-resolution, uncompressed textures; ALU, for measuring shader compute performance; and Driver Overhead, which measures the CPU overhead of the graphics driver and API by making a lot of draw calls and state changes.
See GFXBench 3.0: A Fresh Look At Mobile Benchmarking for a complete test-by-test breakdown of this benchmark.
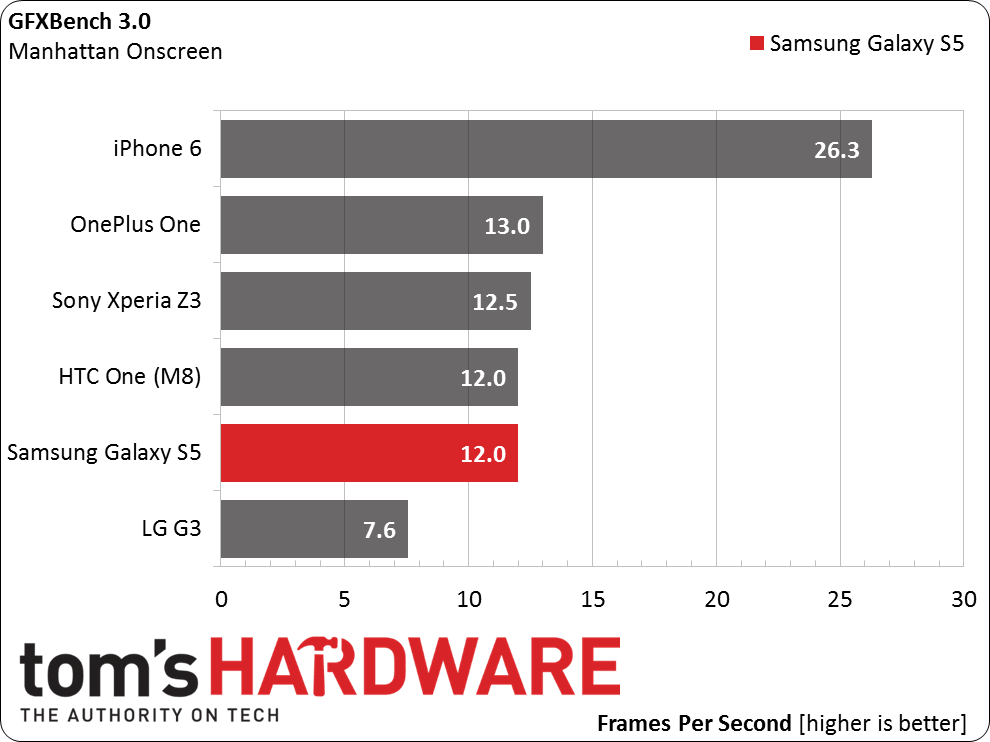
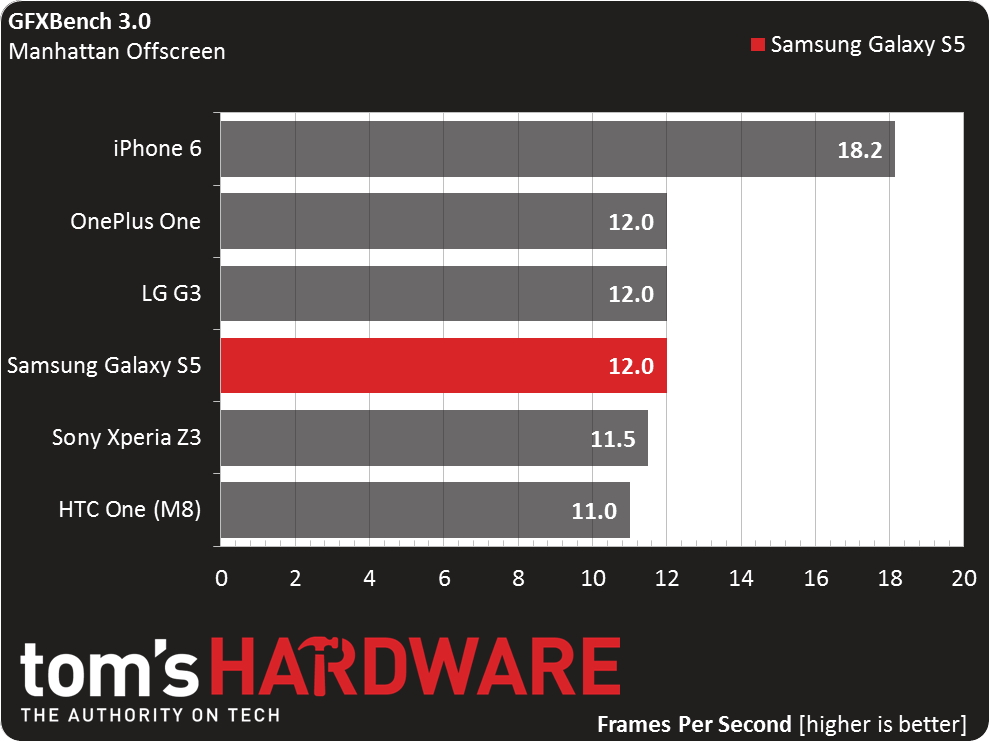
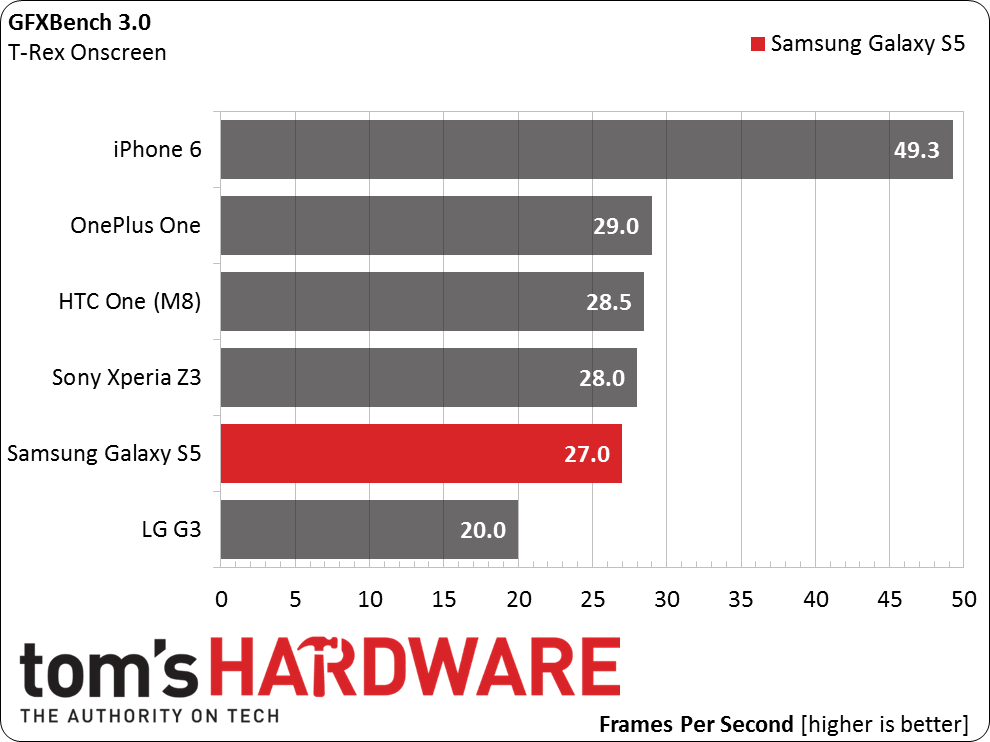
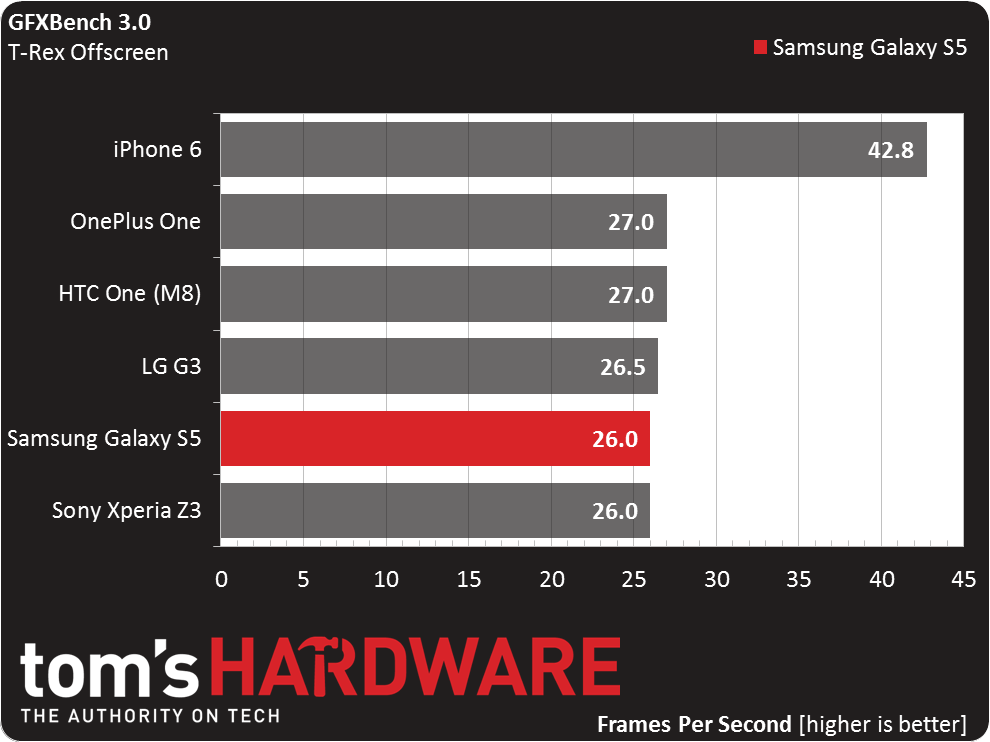
In both Manhattan and T-Rex, the Galaxy S5 performs the same as all of the other phones with Adreno 330 GPUs. The LG G3 shows a significant drop in performance in both on-screen tests because of its higher WQHD resolution. The Adreno 330 just wasn't designed to handle this many pixels.
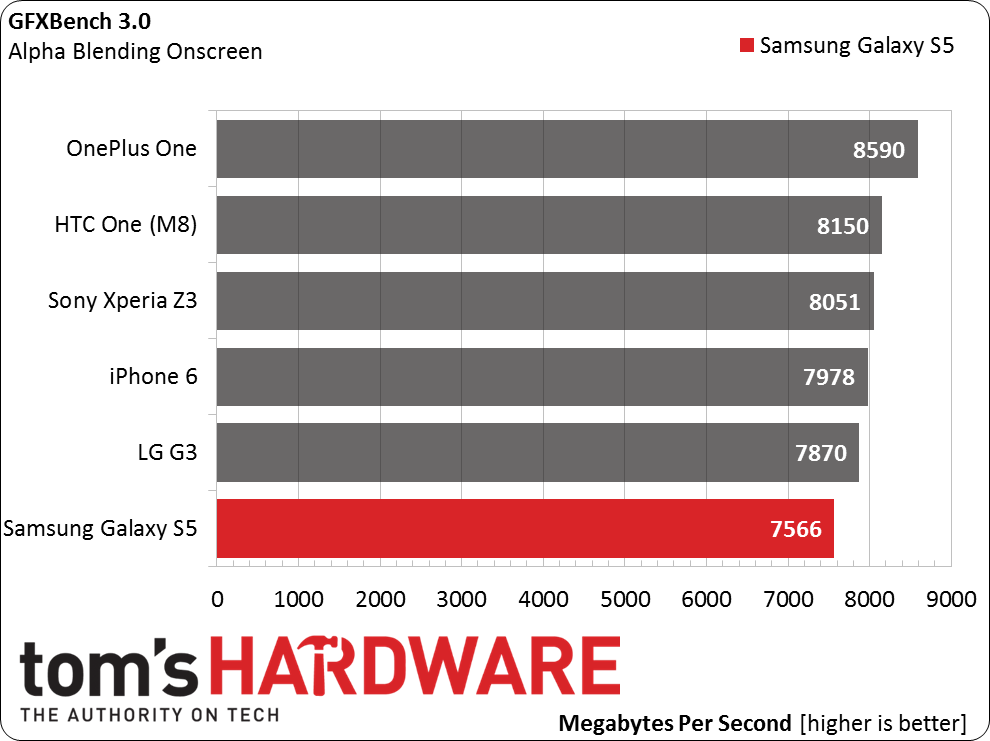
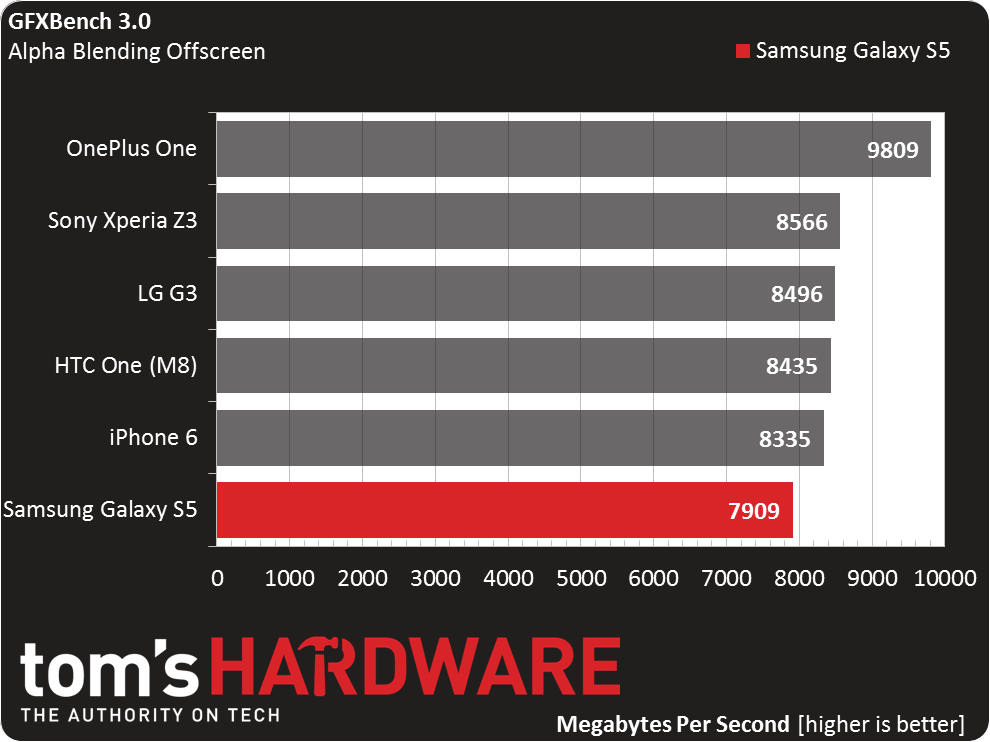
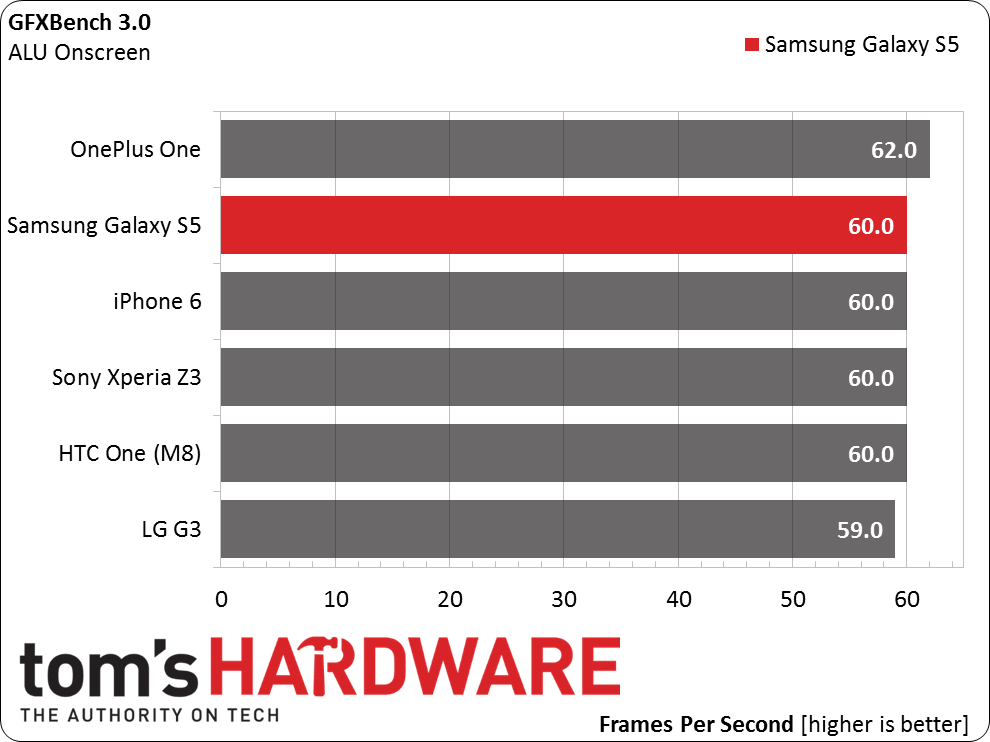
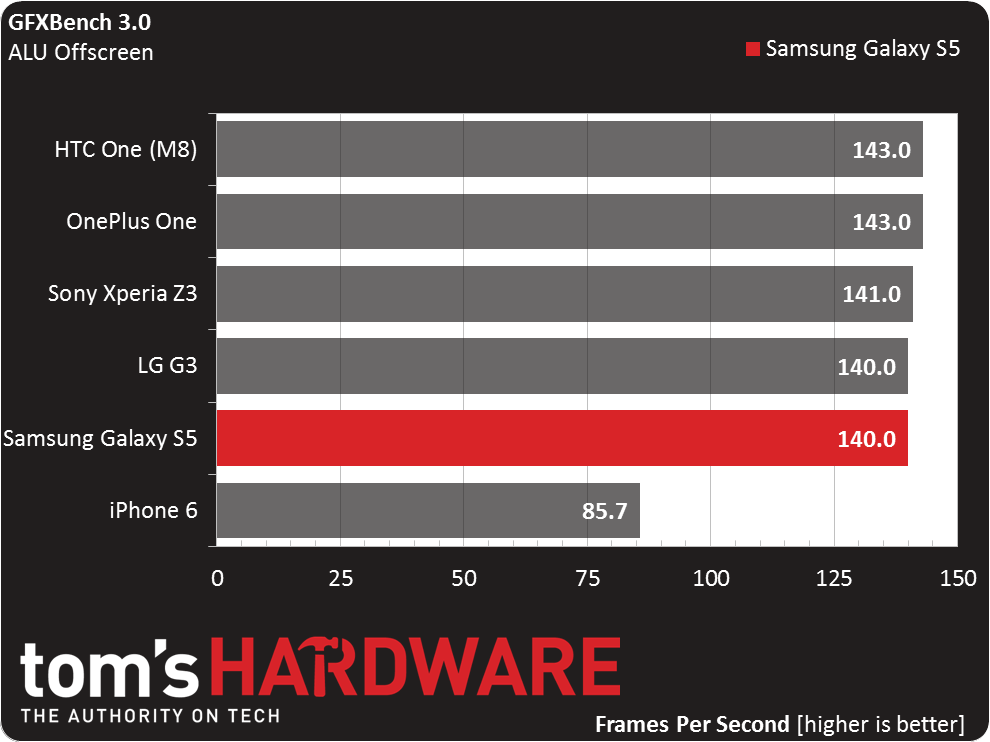
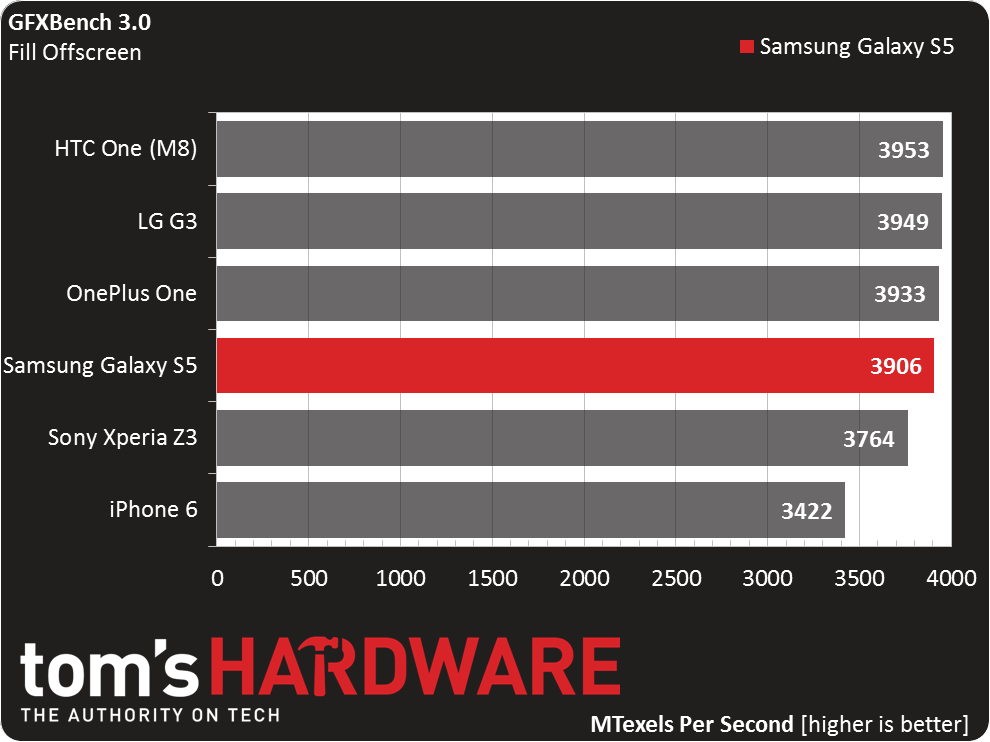
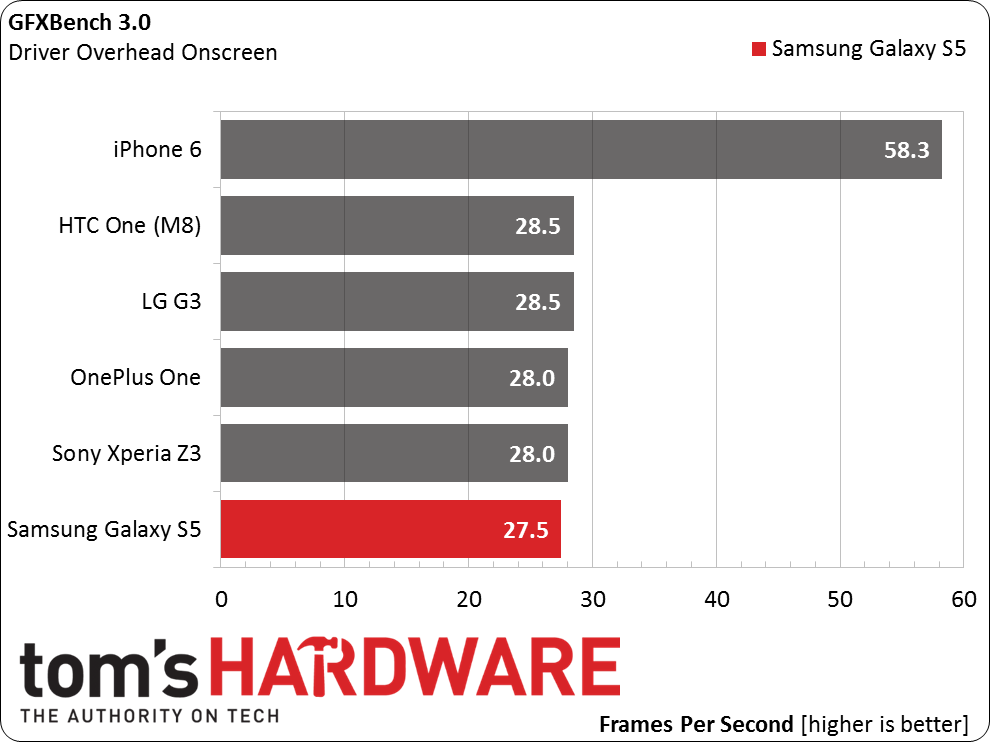
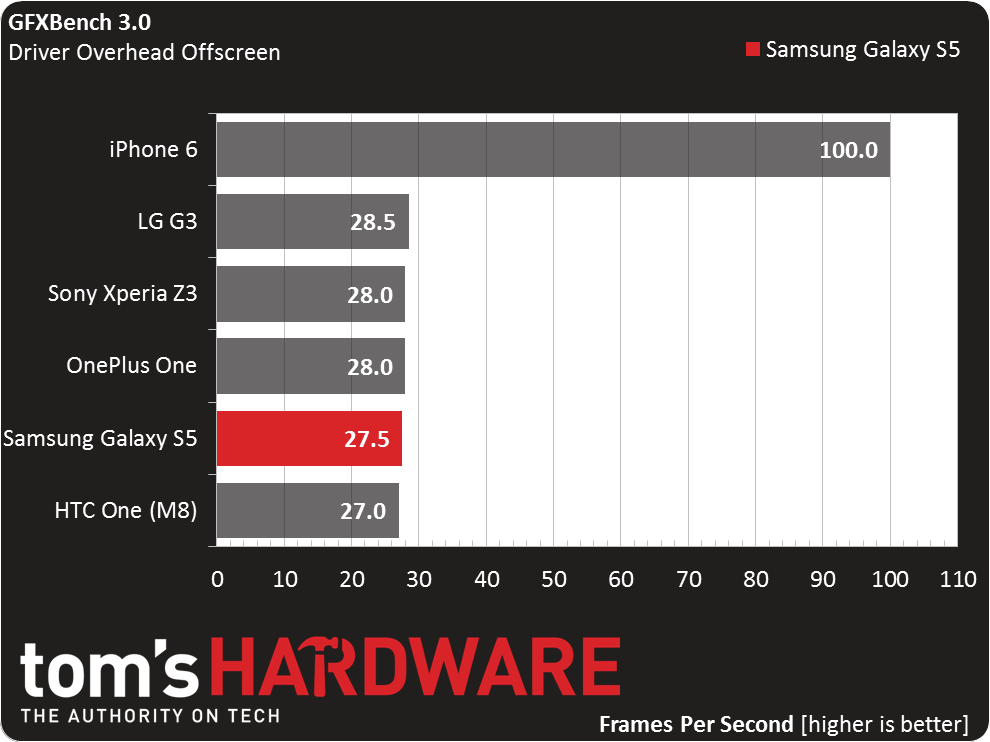
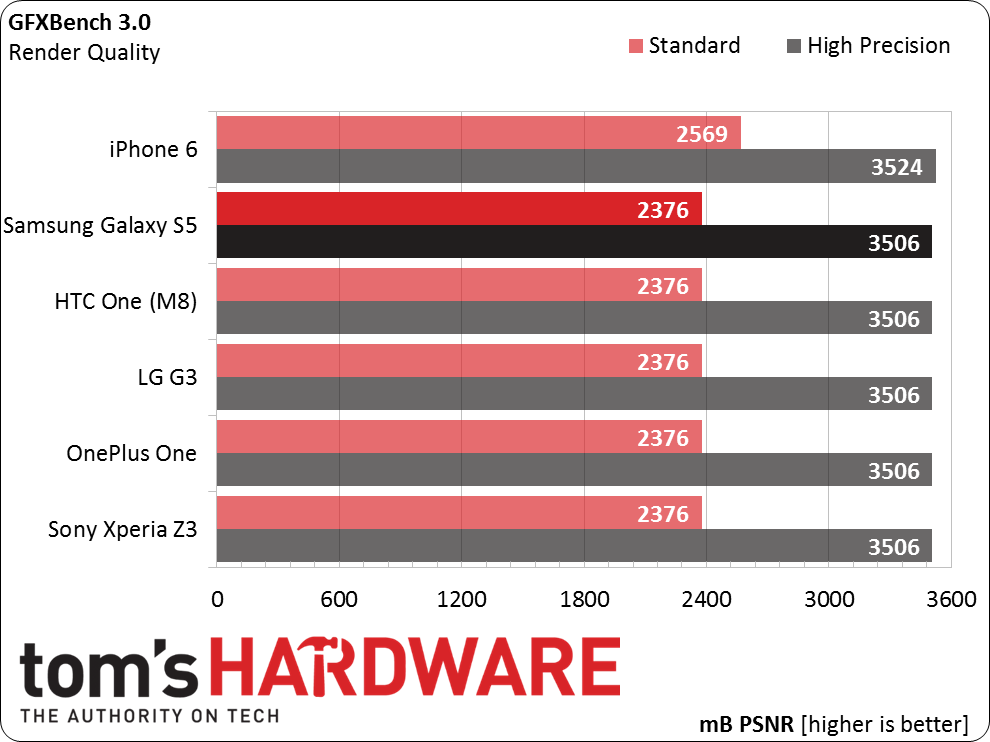
AndEBench Pro already showed the OnePlus One with a slight advantage over the Galaxy S5 in both memory bandwidth and memory latency. It should be no surprise, then, that the One shows a 14% advantage over the S5 in the on-screen Alpha Blending test, which fetches high-resolution, uncompressed textures from memory. The margin is even greater when rendering off-screen.
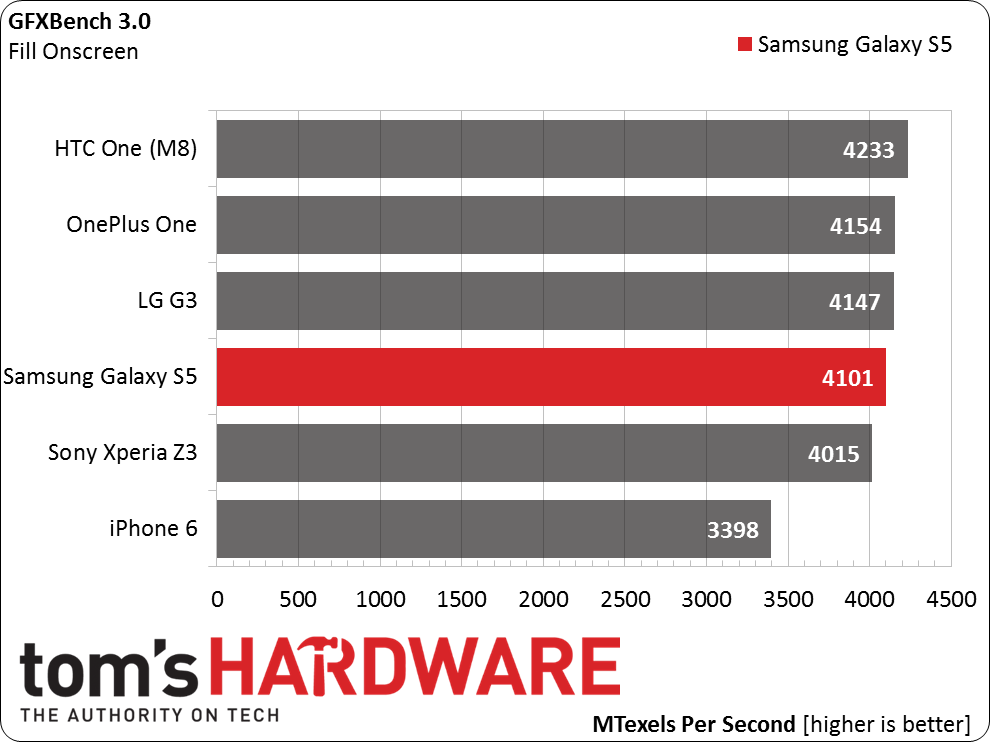
All of the other low-level tests show the S5 with near identical performance to the other Snapdragon 801 phones.
The Galaxy S5 performs as expected in gaming and GPU benchmarks. While it falls near the bottom in our benchmark charts, the difference between it and the top performing Adreno 330-based phone is generally negligible and shouldn't be noticeable in real-world use.
Current page: Results: GPU Core Benchmarks
Prev Page Results: HTML5 And JavaScript Benchmarks Next Page Results: Display Measurements-
grumpigeek My Galaxy S5 in in an Urban Armor Gear case that looks great and protects the phone, so I don't really care what it looks like.Reply
The device is 100% reliable and I have found the battery life to be excellent - way better than any smartphone I have had previously.
-
implantedcaries Guys you are reviewing a mobile which was released a year and then calling it average compared to competitiReply -
firefoxx04 I have an s5. This review would have been welcomed a year ago.Reply
The phone is top notch. I've known this for a while. -
implantedcaries Guys you are reviewing a mobile which was released a year back and then calling it average compared to competition?? Seriously? Yes I agree S5 is not the most exciting prospect out there for new mobile buyers now, but it wasn't so in 2014 when it was actually launched. Also its one of the very few mobiles already receiving lollipop updates.. No mention of that.. Any hidden agenda against Samsung?Reply -
FritzEiv Folks, you're right. This review is quite late. We began testing the S5 a long time ago, but we've had a bit of a backlog of smartphones to review since Matt (our senior mobile editor) started on staff and we're just catching up. We aren't trying to pretend it's a new phone, thus we haven't put it up in our main feature carousel; but we did want to publish this and others just to have them for archival and future referral and comparison purposes. We are working on other smartphones that are little more current and then we hope to be "on time" as new ones arrive. Hence, for example, Matt's performance preview of Qualcomm's Snapdragon 810 earlier this week. We've been a bit more timely on devices like the OnePlus and the iPhone reviews as well. But hey, continue your sarcasm, because we probably deserve it. Just want you to know why we are doing this, that we're not trying to fool anyone, and that we'll be caught up in short order. Thanks for your patience.Reply
- Fritz (Editor-in-chief) -
Mac266 One thing in this review irritated me: the whole "it's ugly" thing. It might not suit you, but lots of people like the way it looks. Aesthetics are purely subjective, and should definitely not be judged a con on one mans opinion.Reply -
peterf28 Iam not buying a smartphone again where the chipset drivers are not open source. Like what samsung did with the S3, it is stuck on Android 4.3, and there is nothing you can do. All the custom roms are unstable crap because there are no up to date drivers For current kernels. It is like buying a PC without the possibility to update the OS . Would you buy that ?Reply -
jdrch FYI phone speakers are placed on the back of phones to take advantage of acoustics when the phone is laying on a surface. The surface spreads and reflects the sounds back to the user much better than the speaker itself would. Try it yourself.Reply
