Why you can trust Tom's Hardware
Comparison Products for 1TB Samsung T7 Shield
We compared the 1TB Samsung T7 Shield to other portable 1TB drives, including its sibling the T7 Touch, which is similar but has older 92-layer flash. We also included the Samsung X5, a drive with DRAM that communications via the Thunderbolt 3 interface. The Kingston XS2000 is notable for using SMI’s new hybrid controller. We also have a QLC drive in the Crucial X8, plus USB 3.2 Gen 2x1 and 2x2 drives with the SanDisk professional G-Drive, the SanDisk Extreme v2, and the WD Black P50.
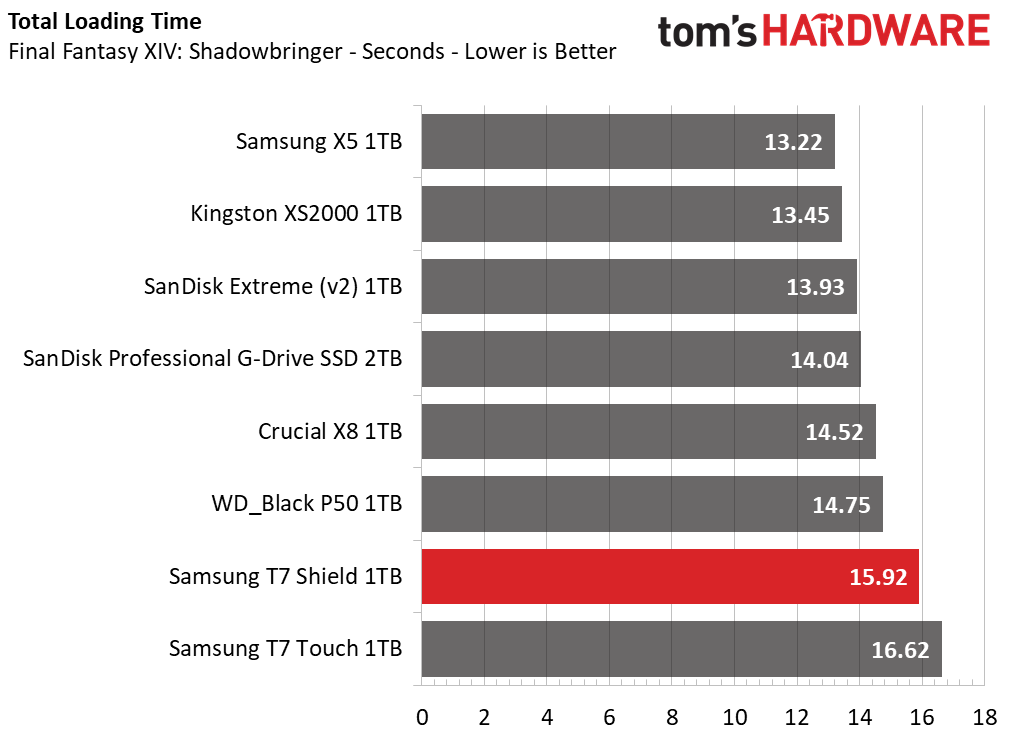
Game Scene Loading - Final Fantasy XIV
Final Fantasy XIV Shadowbringers is a free real-world game benchmark that easily and accurately compares game load times without the inaccuracy of using a stopwatch.
The difference in actual game load times between various SSDs tends to be small. Nevertheless, it can be illustrative of hardware differences.
The X5 is essentially a 970 EVO in a ThunderBolt 3-capable enclosure, and it does well here. The T7 models, sporting the DRAM-less Pablo SSD controller that communications over the USB bus, do the worst. The Shield offers a bit of improvement over the Touch, likely due to the newer flash and possibly firmware optimization. The rest of the USB drives fill out the chart, with the XS2000 doing quite well.
Trace Testing – PCMark 10 Storage Benchmark
PCMark 10 is a trace-based benchmark that uses a wide-ranging set of real-world traces from popular applications and everyday tasks to measure the performance of storage devices.
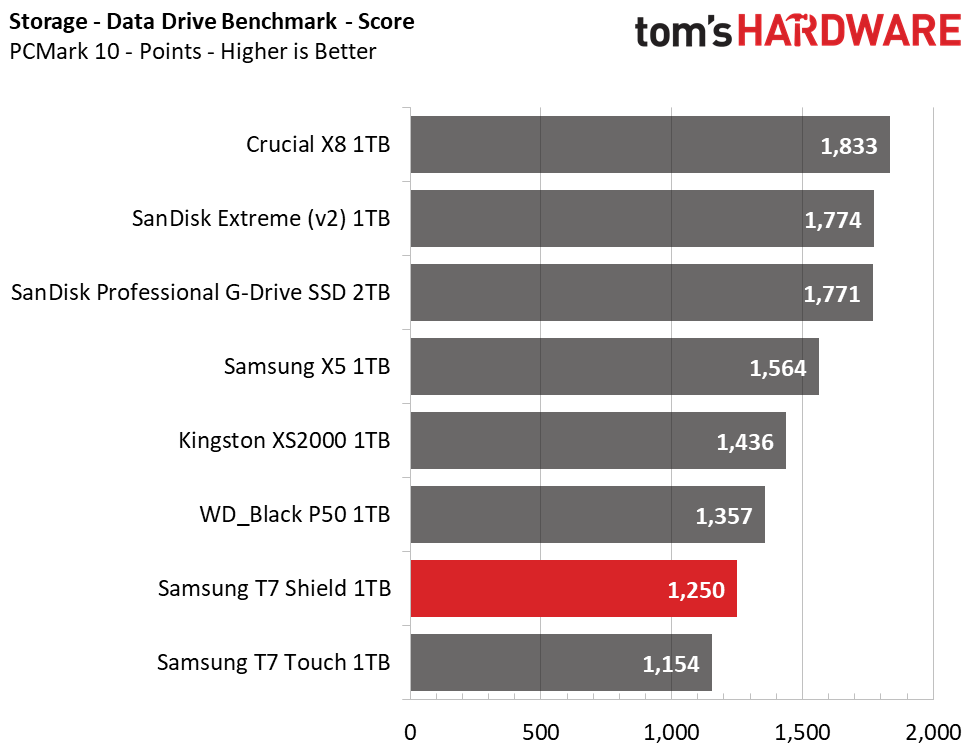
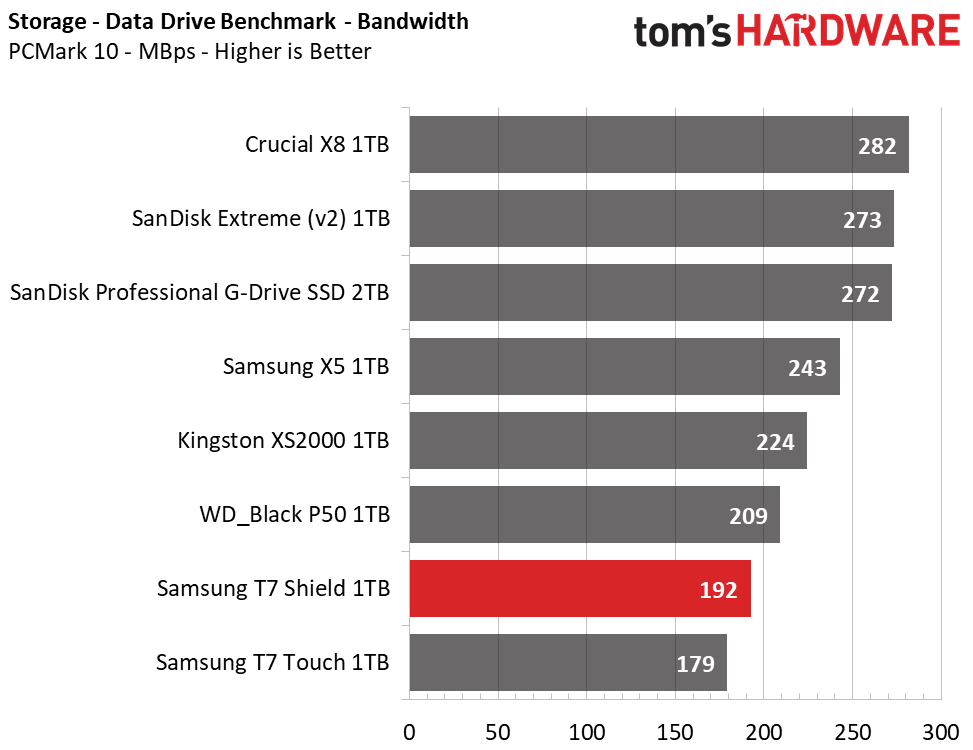
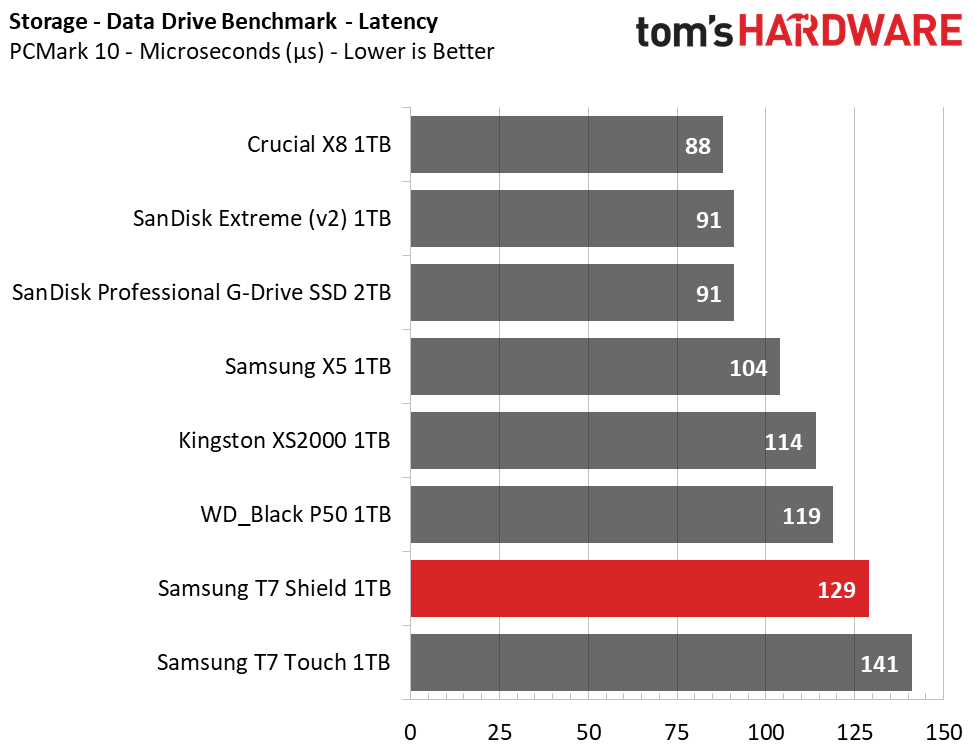
We see similar results here: the T7 models are at the bottom, with the Shield besting the older Touch. We see good results from SanDisk’s Extreme v2 and Professional G-Drive, both of which use 96-layer BiCS4 TLC flash. The Crucial X8 surprises, using its Micron quad-plane QLC flash and DRAM to take the top of the list. That drive is basically a P1 in an enclosure, meaning it is similar to the Intel 660p.
Many of these drives use the same ASMedia ASM2362 USB 3.2 Gen 2x1 (10 Gbps) bridge controller, so performance differences here stem more from the controller, DRAM, and flash.
Transfer Rates – DiskBench
We use the DiskBench storage benchmarking tool to test file transfer performance with a custom 50GB dataset. We copy 31,227 files of various types, such as pictures, PDFs, and videos to a new folder and then follow up with a reading test of a newly-written 6.5GB zip file.
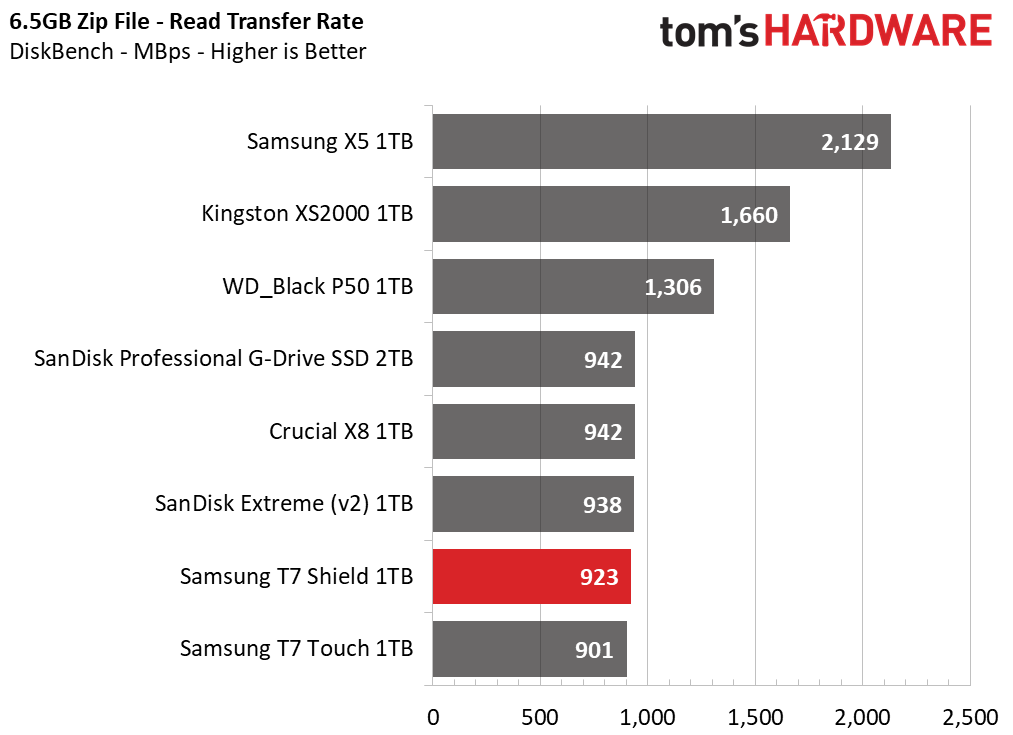
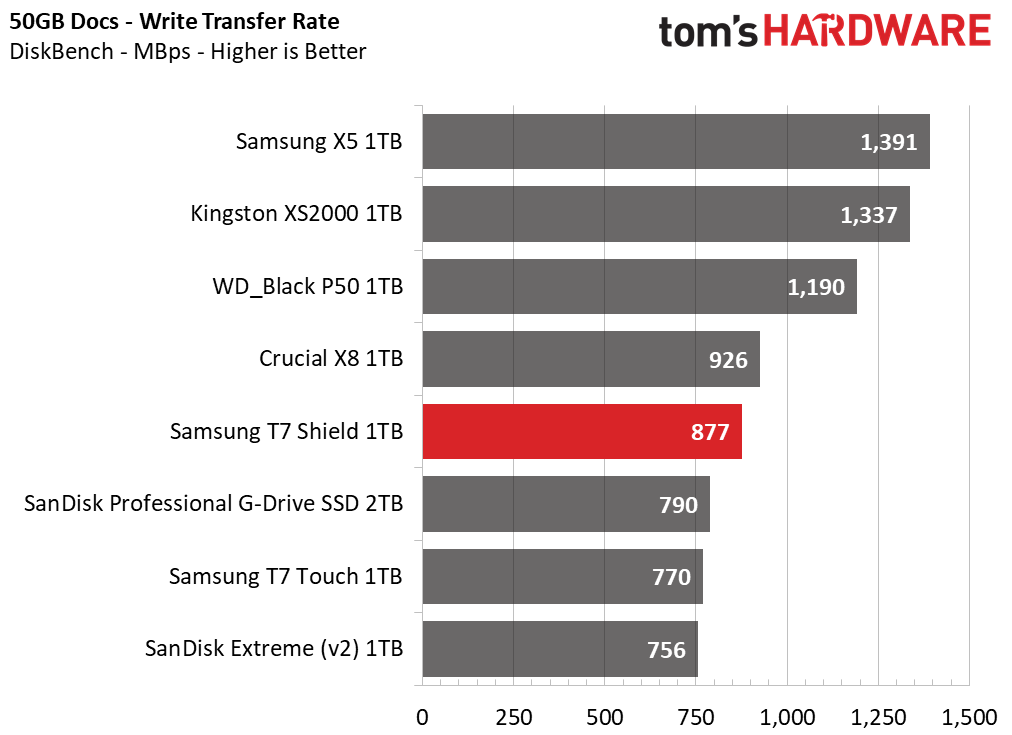
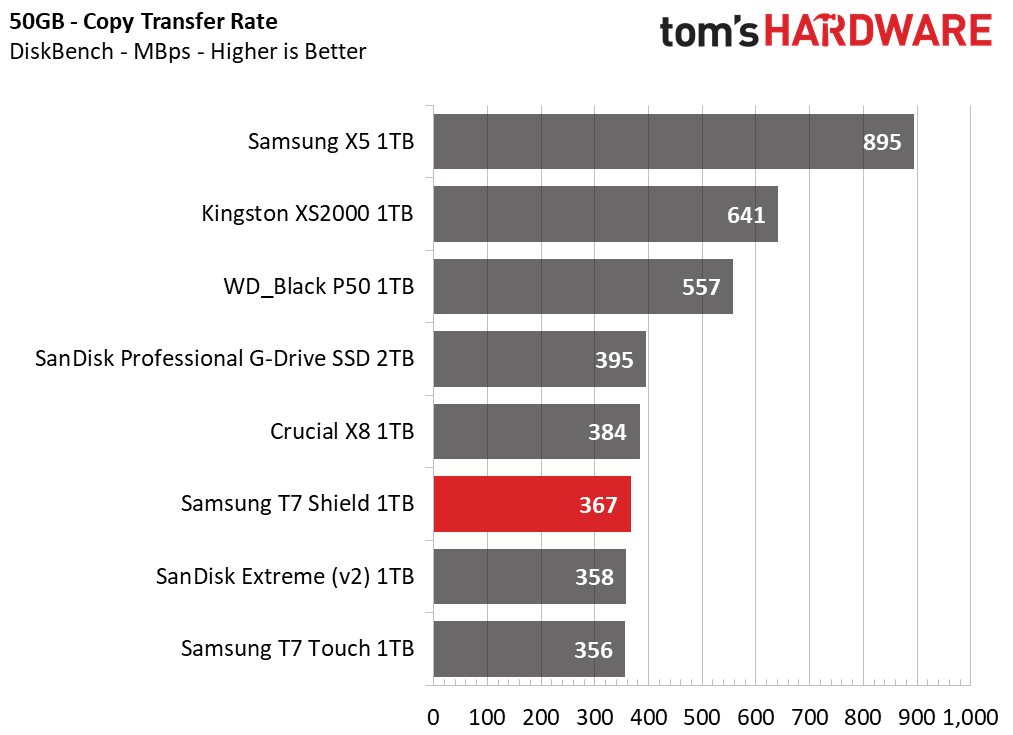
This is a bandwidth-heavy benchmark, so it prefers drives with a faster interface. This would include the Thunderbolt X5 and the USB 3.2 Gen 2x2 (20 Gbps) XS2000 and P50, the latter of which uses ASMedia’s ASM2364.
The T7 Shield still edges out the Touch, particularly during write workloads — unsurprising as the T7 Shield is marketed for having strong sustained write performance.
Get Tom's Hardware's best news and in-depth reviews, straight to your inbox.
Synthetic Testing - ATTO / CrystalDiskMark
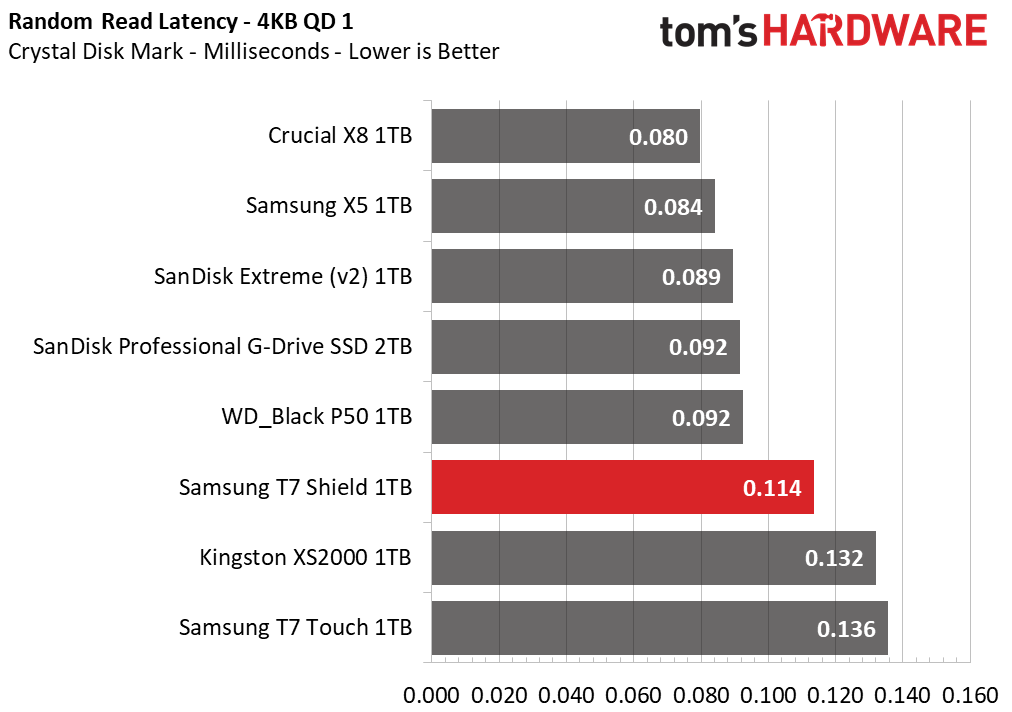
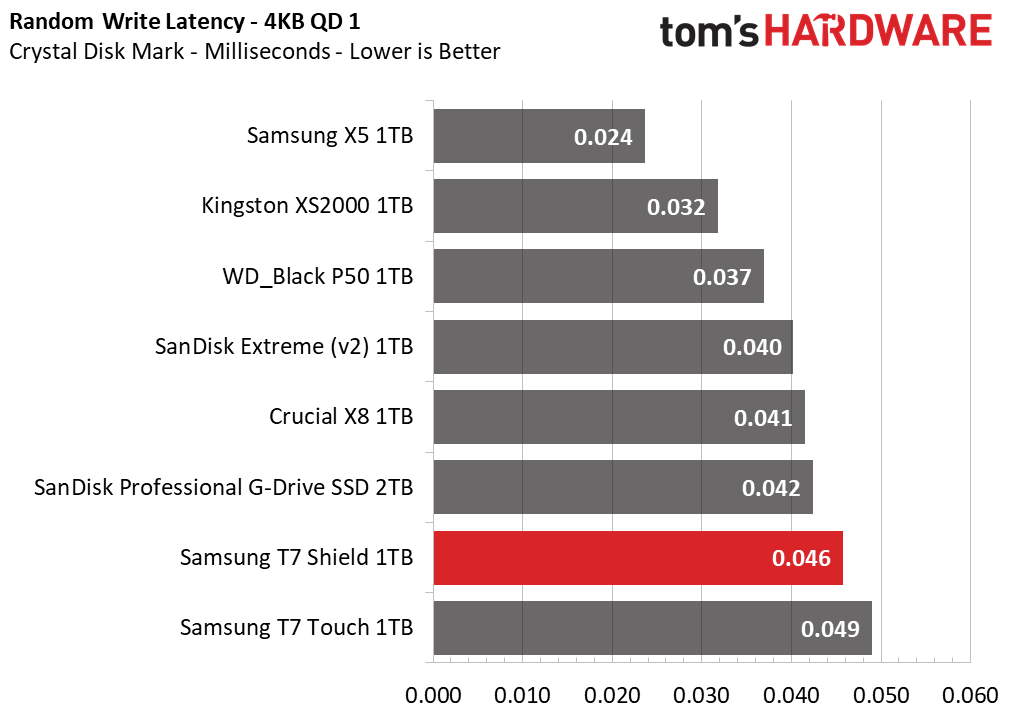
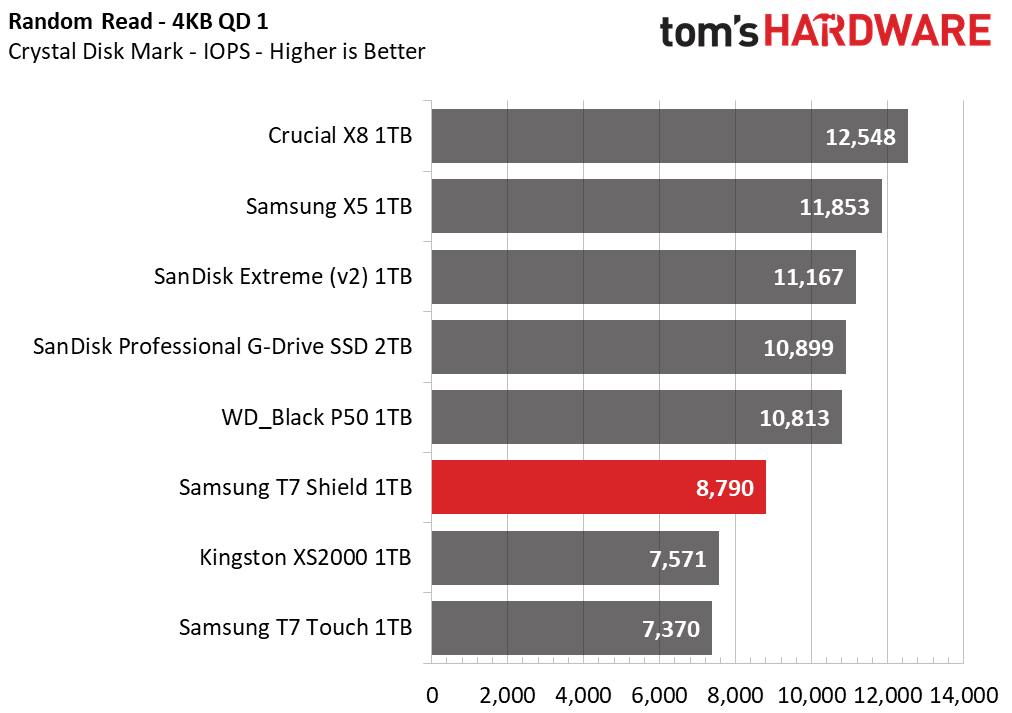
ATTO and CrystalDiskMark (CDM) are free and easy-to-use storage benchmarking tools that SSD vendors commonly use to assign performance specifications to their products. These tools give us insight into how each device handles different file sizes.
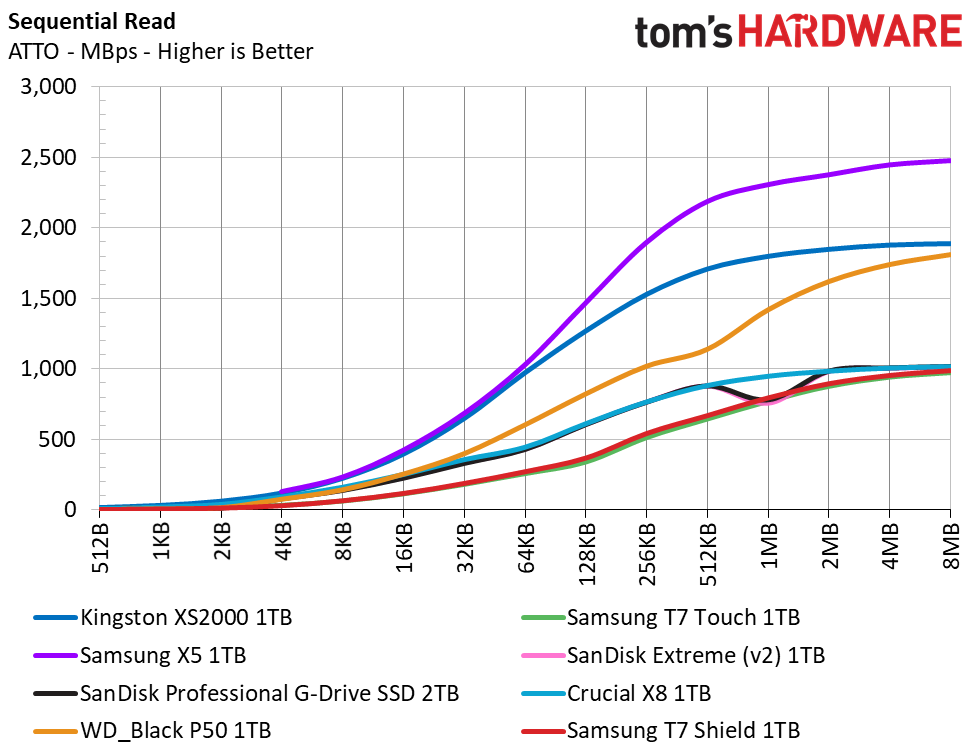
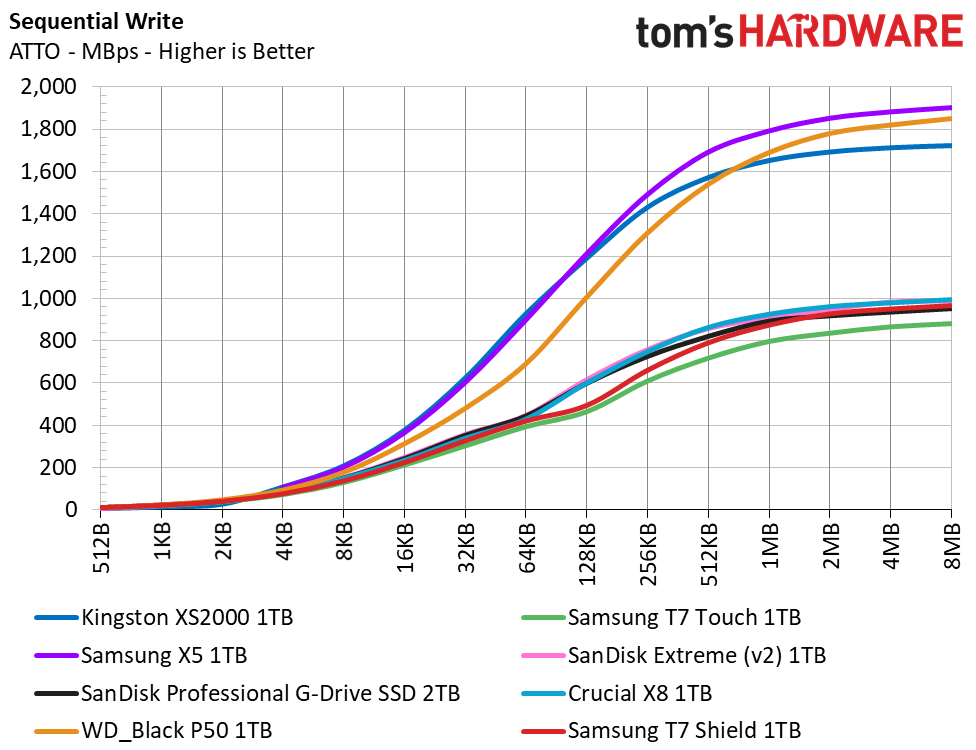
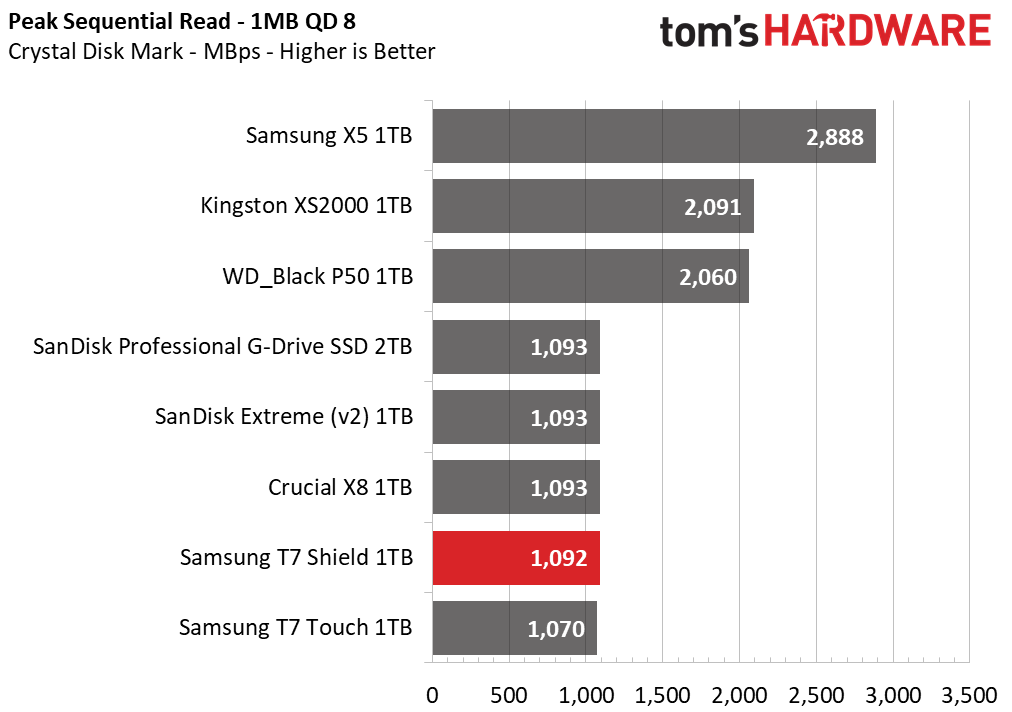
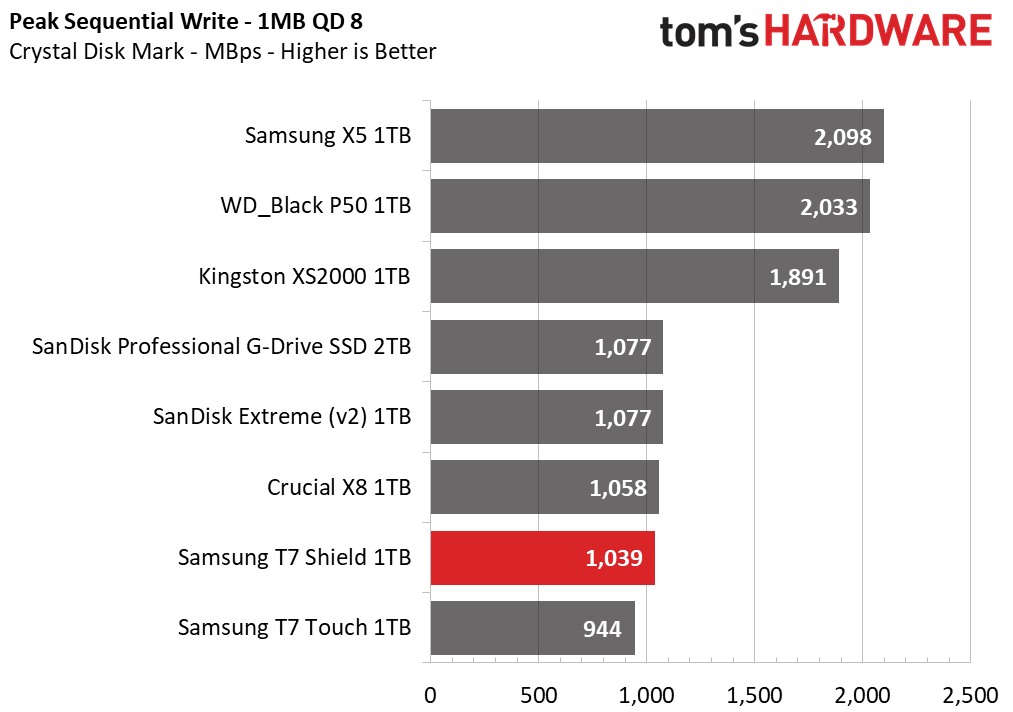
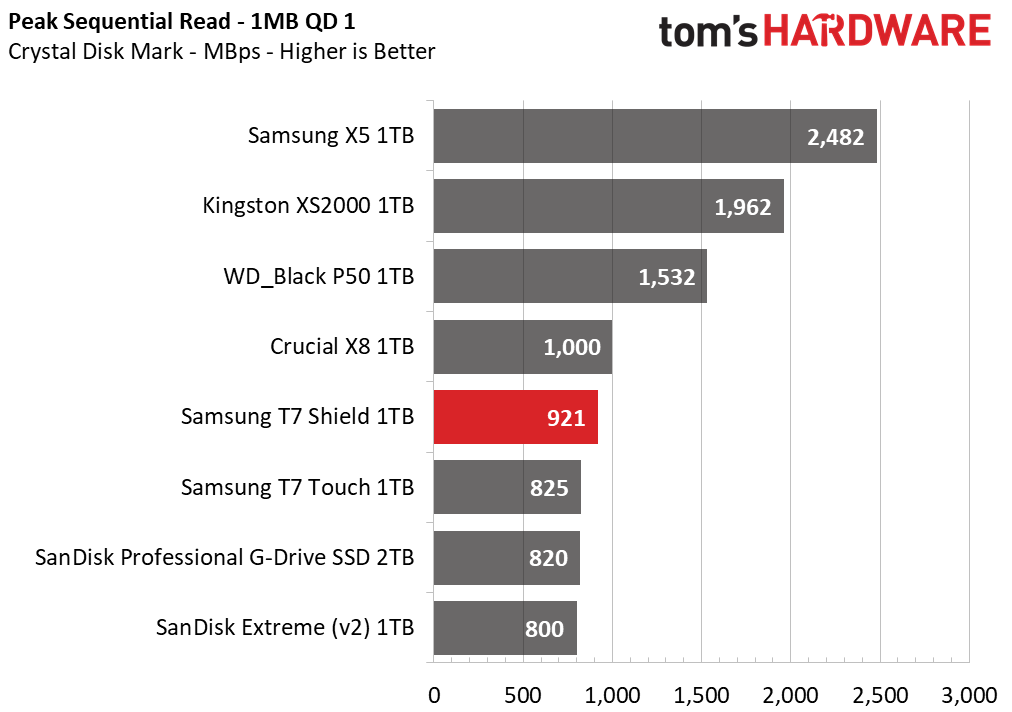
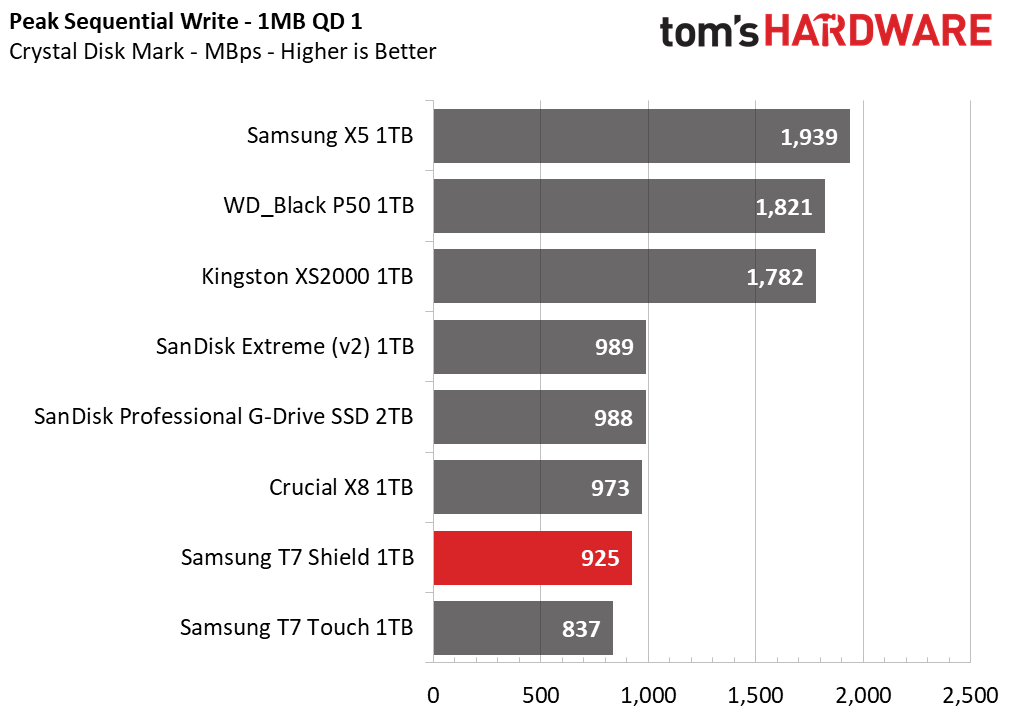
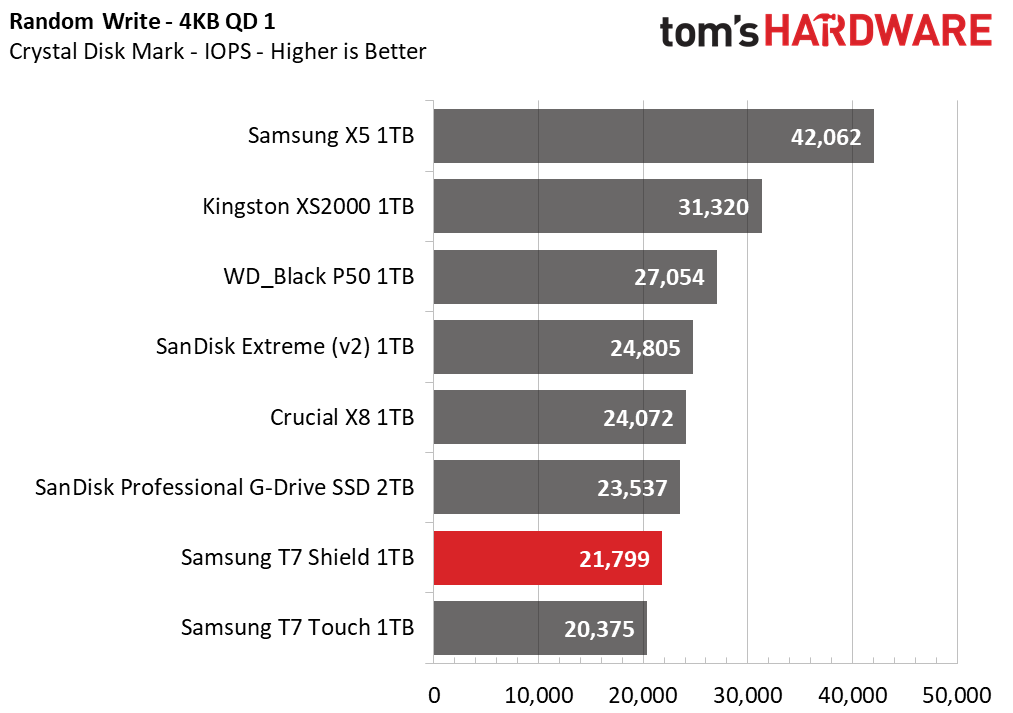
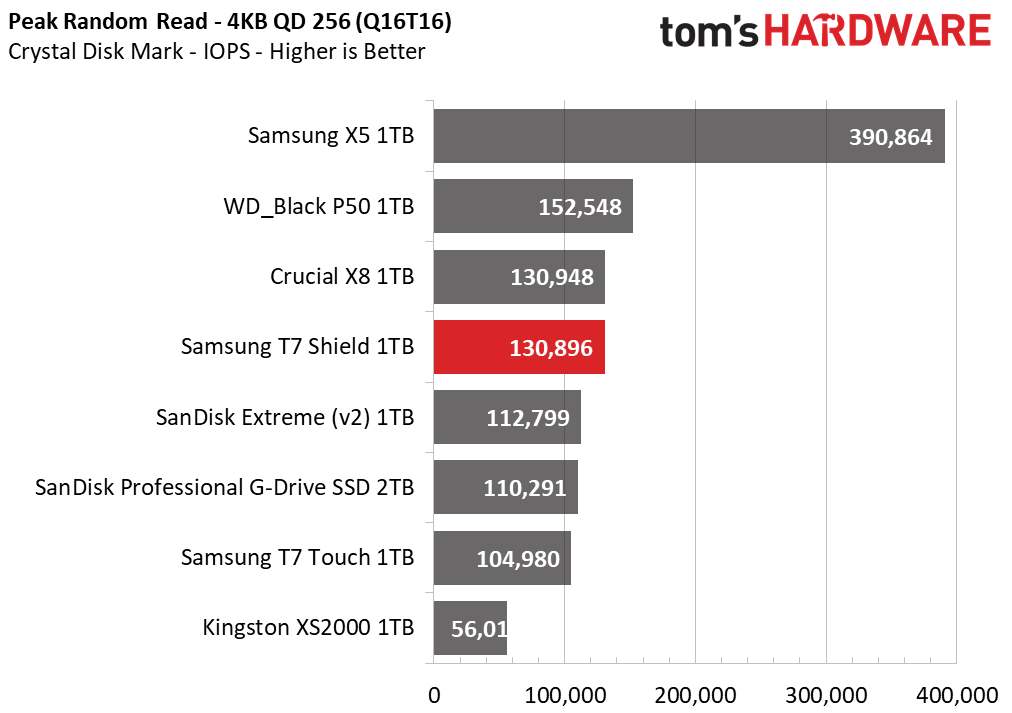
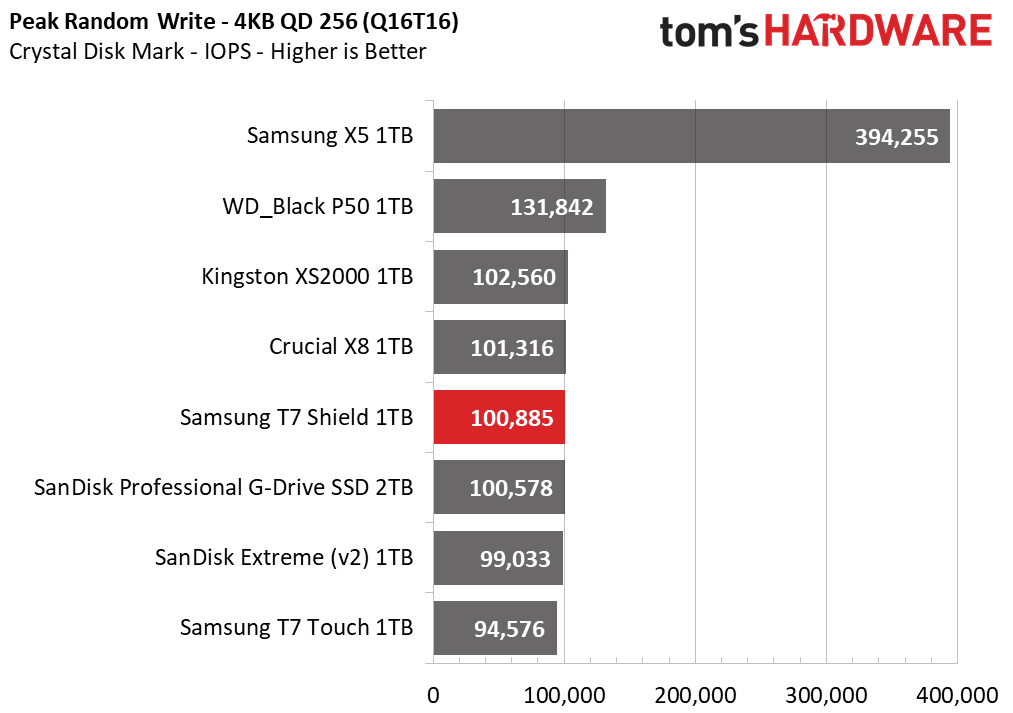
Bandwidth limitations also impact the ATTO results, with the X5, XS2000, and P50 coming out on top. Crystal Disk Mark’s sequential tests also align here, with the X5 most obviously taking the lead during sequential read tests. The T7 Shield also improves on write performance over the Touch. Whether at 1TB or 2TB, the Shield’s sequential throughput is limited by its 10 Gbps interface. A Thunderbolt or USB3.2 Gen 2x2 enclosure/drive might be worthwhile if you want peak transfer performance.
The T7 Shield also improves over the Touch in random 4KB I/O and related latencies. However, the other drives generally fare better than the T7 lineup. The USB interface is a limiting factor for all of these drives except the X5, and it’s questionable whether, given its intended role, you need more performance than what the T7 Shield offers.
Sustained Write Performance, Cache Recovery, and Temperature
Official write specifications are only part of the performance picture. Most SSDs implement a write cache, a fast area of (usually) pseudo-SLC programmed flash that absorbs incoming data. Sustained write speeds can suffer tremendously once the workload spills outside of the cache and into the "native" TLC or QLC flash. We use Iometer to hammer the SSD with sequential writes for 15 minutes to measure both the size of the write cache and performance after the cache is saturated. We also monitor cache recovery via multiple idle rounds.
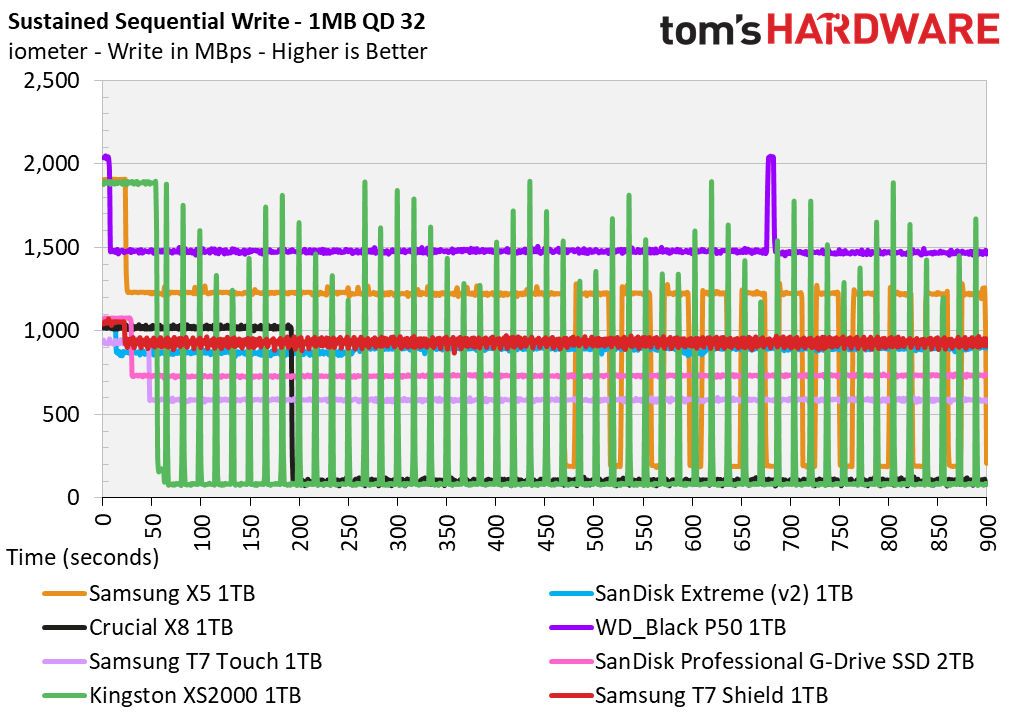
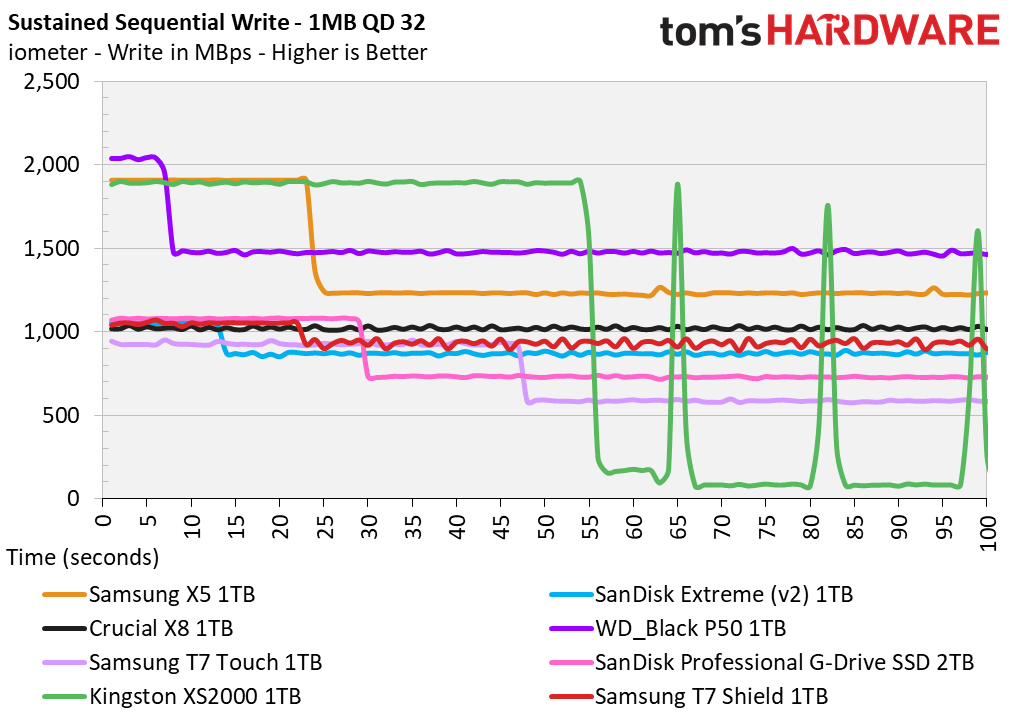
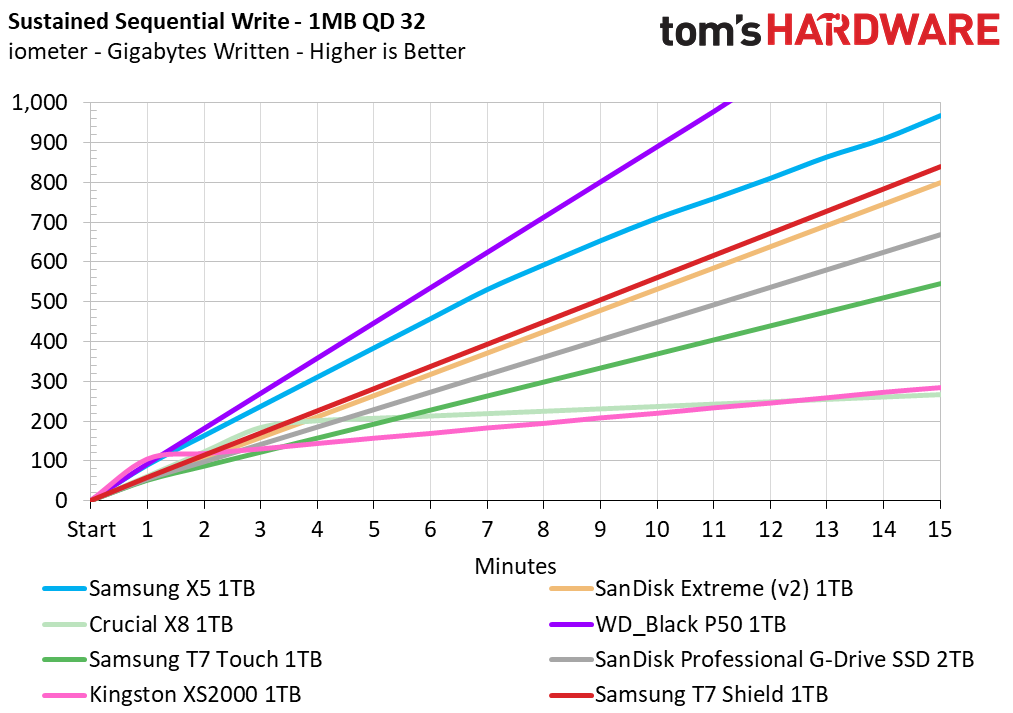
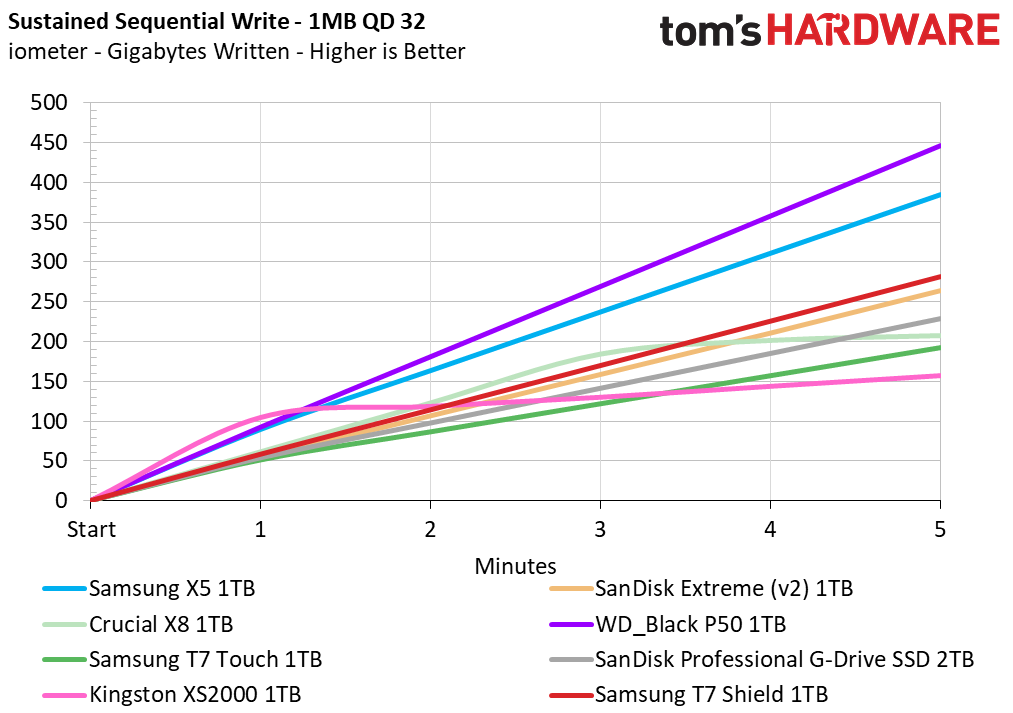
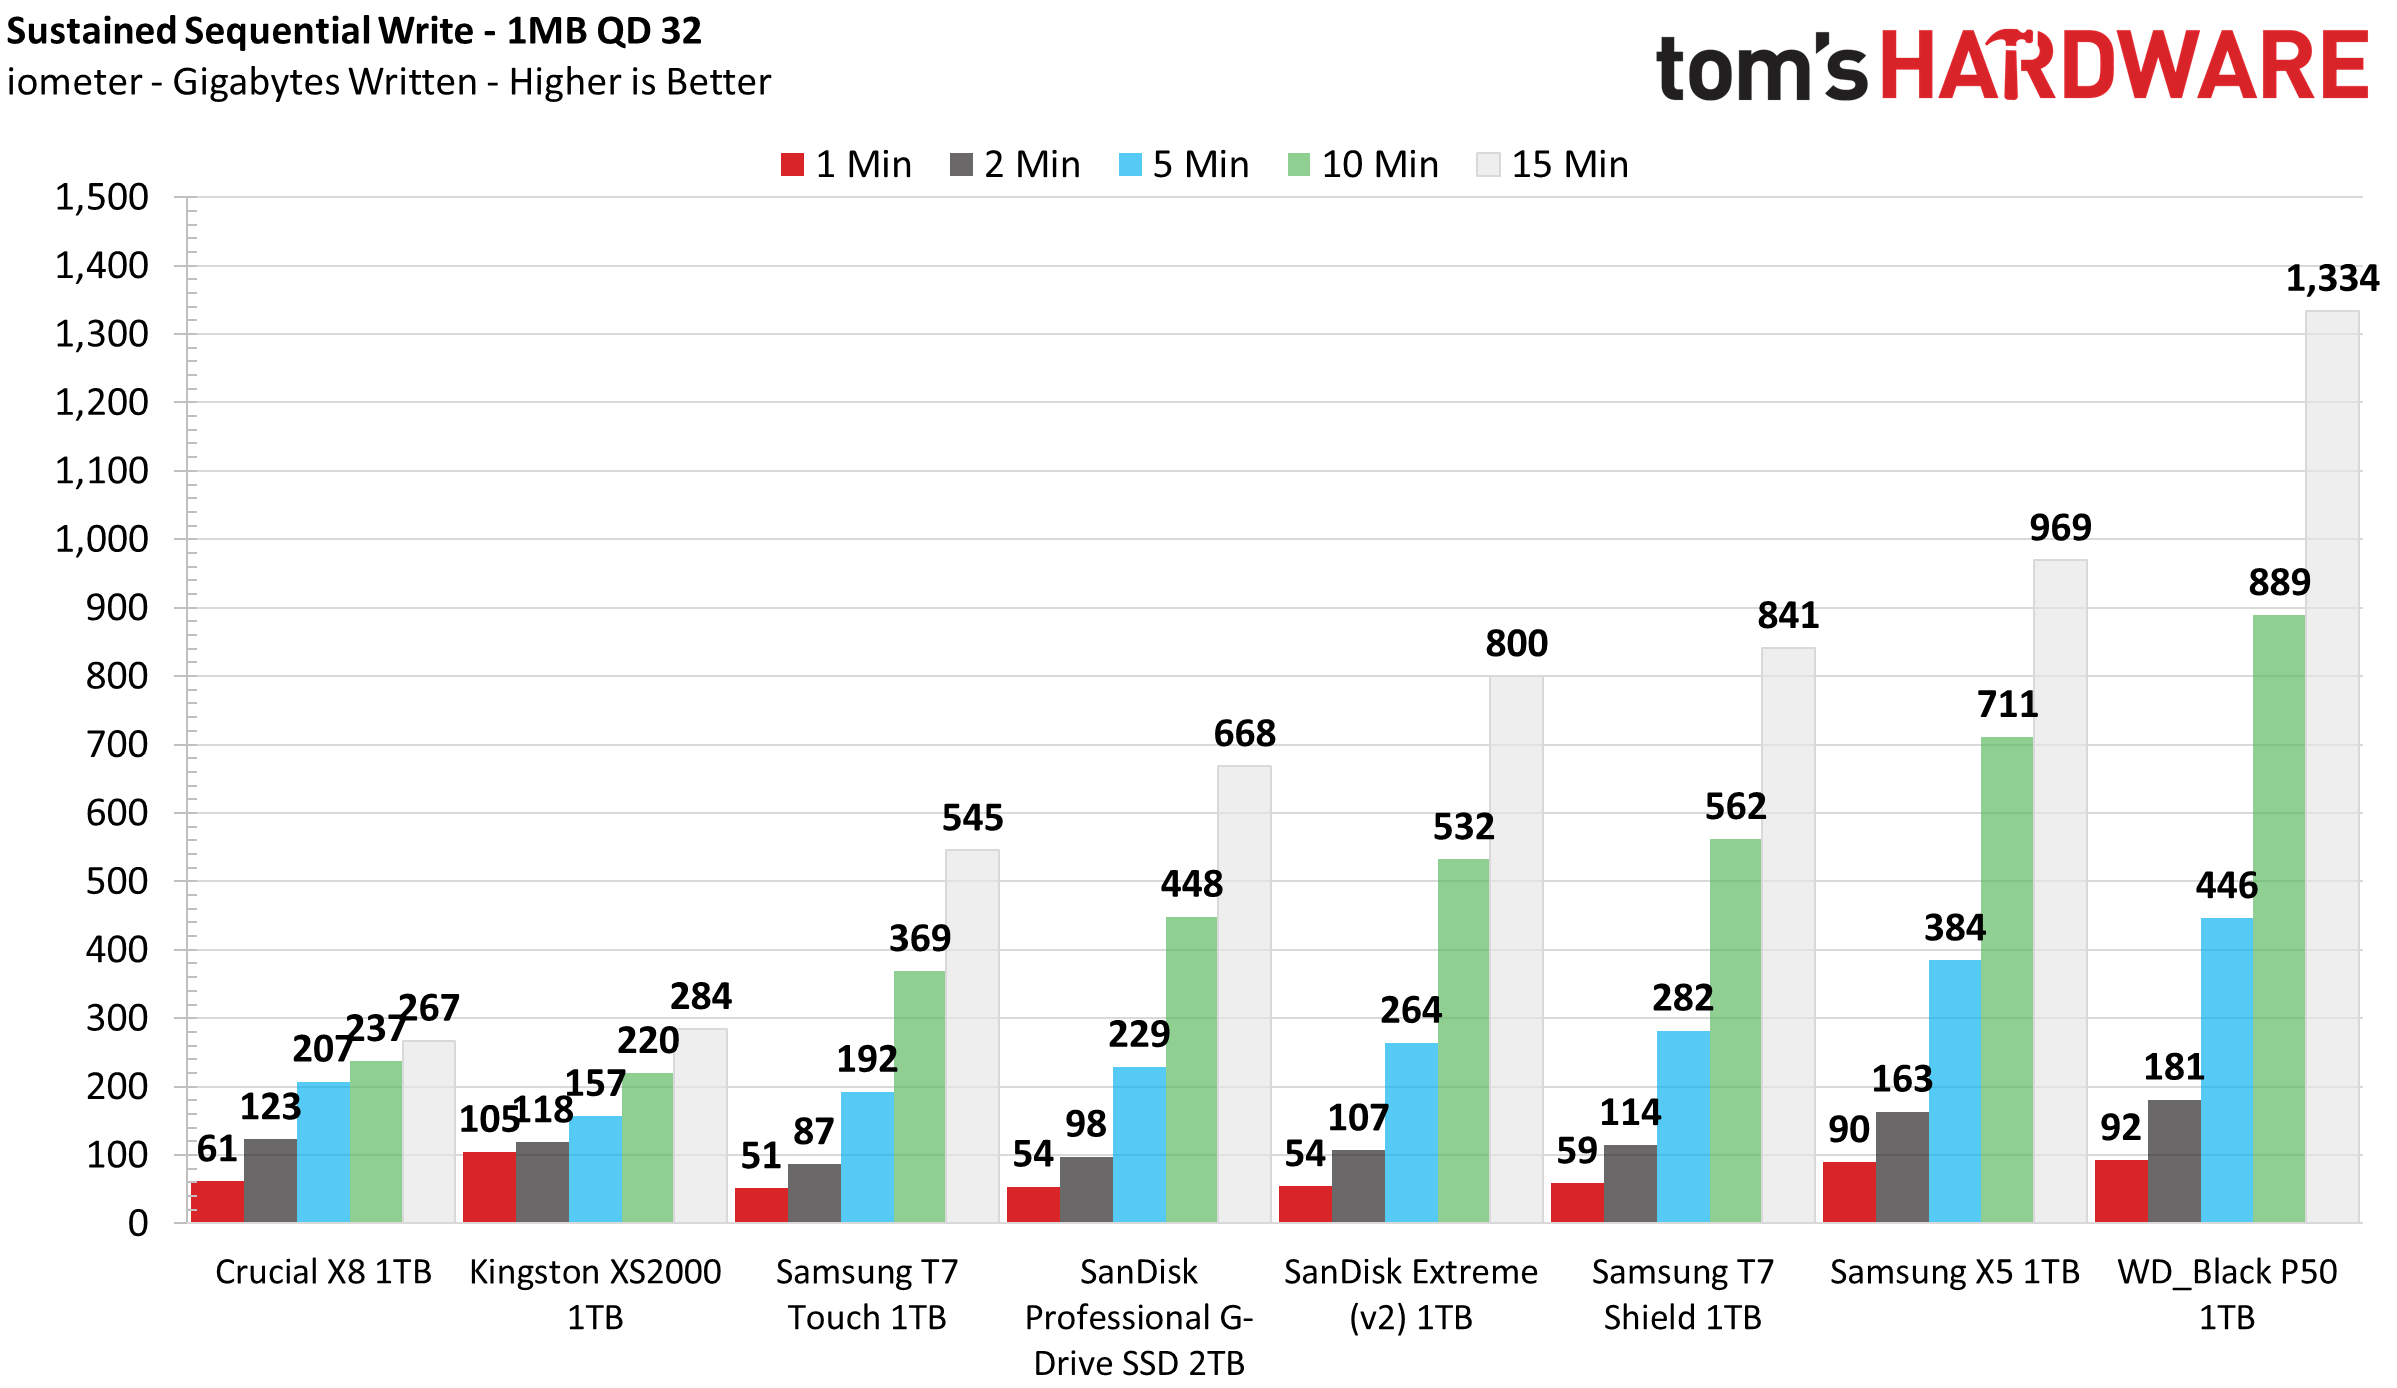
We’re happy to confirm that the T7 Shield meets Samsung’s specifications with very strong sustained write performance. Many users want this in a portable drive, but it’s of particular importance to content creators in the field. Memory cards, for example, are designated by their performance characteristics, including sustained write throughput. Sustained sequential write performance tends to be higher with greater interleaving, meaning they’re faster at higher capacities, but the 1TB Shield gets very close to the 2TB’s performance level.
The 1TB’s SLC cache is about half the size of that found on the 2TB, although it’s easier to see on these charts because it drops down a little more when it hits the TLC portion. This smallish cache manages a bit more than 1 Gbps for around 20 seconds, which is large enough to fit smaller random writes. It’s also likely to remain consistent even as the drive is filled. There’s not much to complain about here, as sustained performance is excellent.
We saw partial cache recovery after a few minutes and full recovery after about half an hour. As with the 2TB model, this isn’t super relevant as the cache is small but sufficient for bursts of random write action. The intended workloads for this type of device would more likely be sequential and sustained, which is one reason we would have liked to see a 20 Gbps interface. However, it would not have been possible to sustain writes at that speed, so Samsung opted for ensured consistency instead.
Test Bench and Testing Notes
| CPU | Intel Core i9-11900K |
| Motherboard | ASRock Z590 Taichi |
| Memory | 2x8GB Kingston HyperX Predator DDR4 5333 |
| Graphics | Intel UHD Graphics 750 |
| CPU Cooling | Alphacool Eissturm Hurricane Copper 45 3x140mm |
| Case | Streacom BC1 Open Benchtable |
| Power Supply | Corsair SF750 Platinum |
| OS Storage | WD_Black SN850 2TB |
| Operating System | Windows 10 Pro 64-bit 20H2 |
We use a Rocket Lake platform with most background applications such as indexing, windows updates, and anti-virus disabled in the OS to reduce run-to-run variability. Each SSD is prefilled to 50% capacity and tested as a secondary device. Unless noted, we use active cooling for all SSDs.
MORE: Best SSDs
MORE: How We Test HDDs And SSDs
MORE: All SSD Content
Current page: 1TB Performance Results
Prev Page Features and Specifications Next Page 2TB Performance Results
Shane Downing is a Freelance Reviewer for Tom’s Hardware US, covering consumer storage hardware.
-
_dawn_chorus_ For those who might already own a regular T5 or T7 or are on a budget, you can get a silicone case that adds protection as well as more grip to the drive for $10. I've been carrying one around in my pocket or bag everyday for 2 years.Reply
https://www.amazon.com/gp/product/B07Z449CWG/ref=ppx_yo_dt_b_search_asin_title?ie=UTF8&psc=1 -
baconcow I am not very technical. Can you clarify why the USB at 10 Gbps limits the sequential read which maxes out at 1050 MB/s (isn't this around 8.4 Gbps or so)?Reply -
Tarbane I disagree with the pinky finger I have two azeron and the article is wrong like usual, you can have lots of profiles games on the azeron. Only two are stored on the game pad. More are available when the software turned on.Reply
