Why you can trust Tom's Hardware
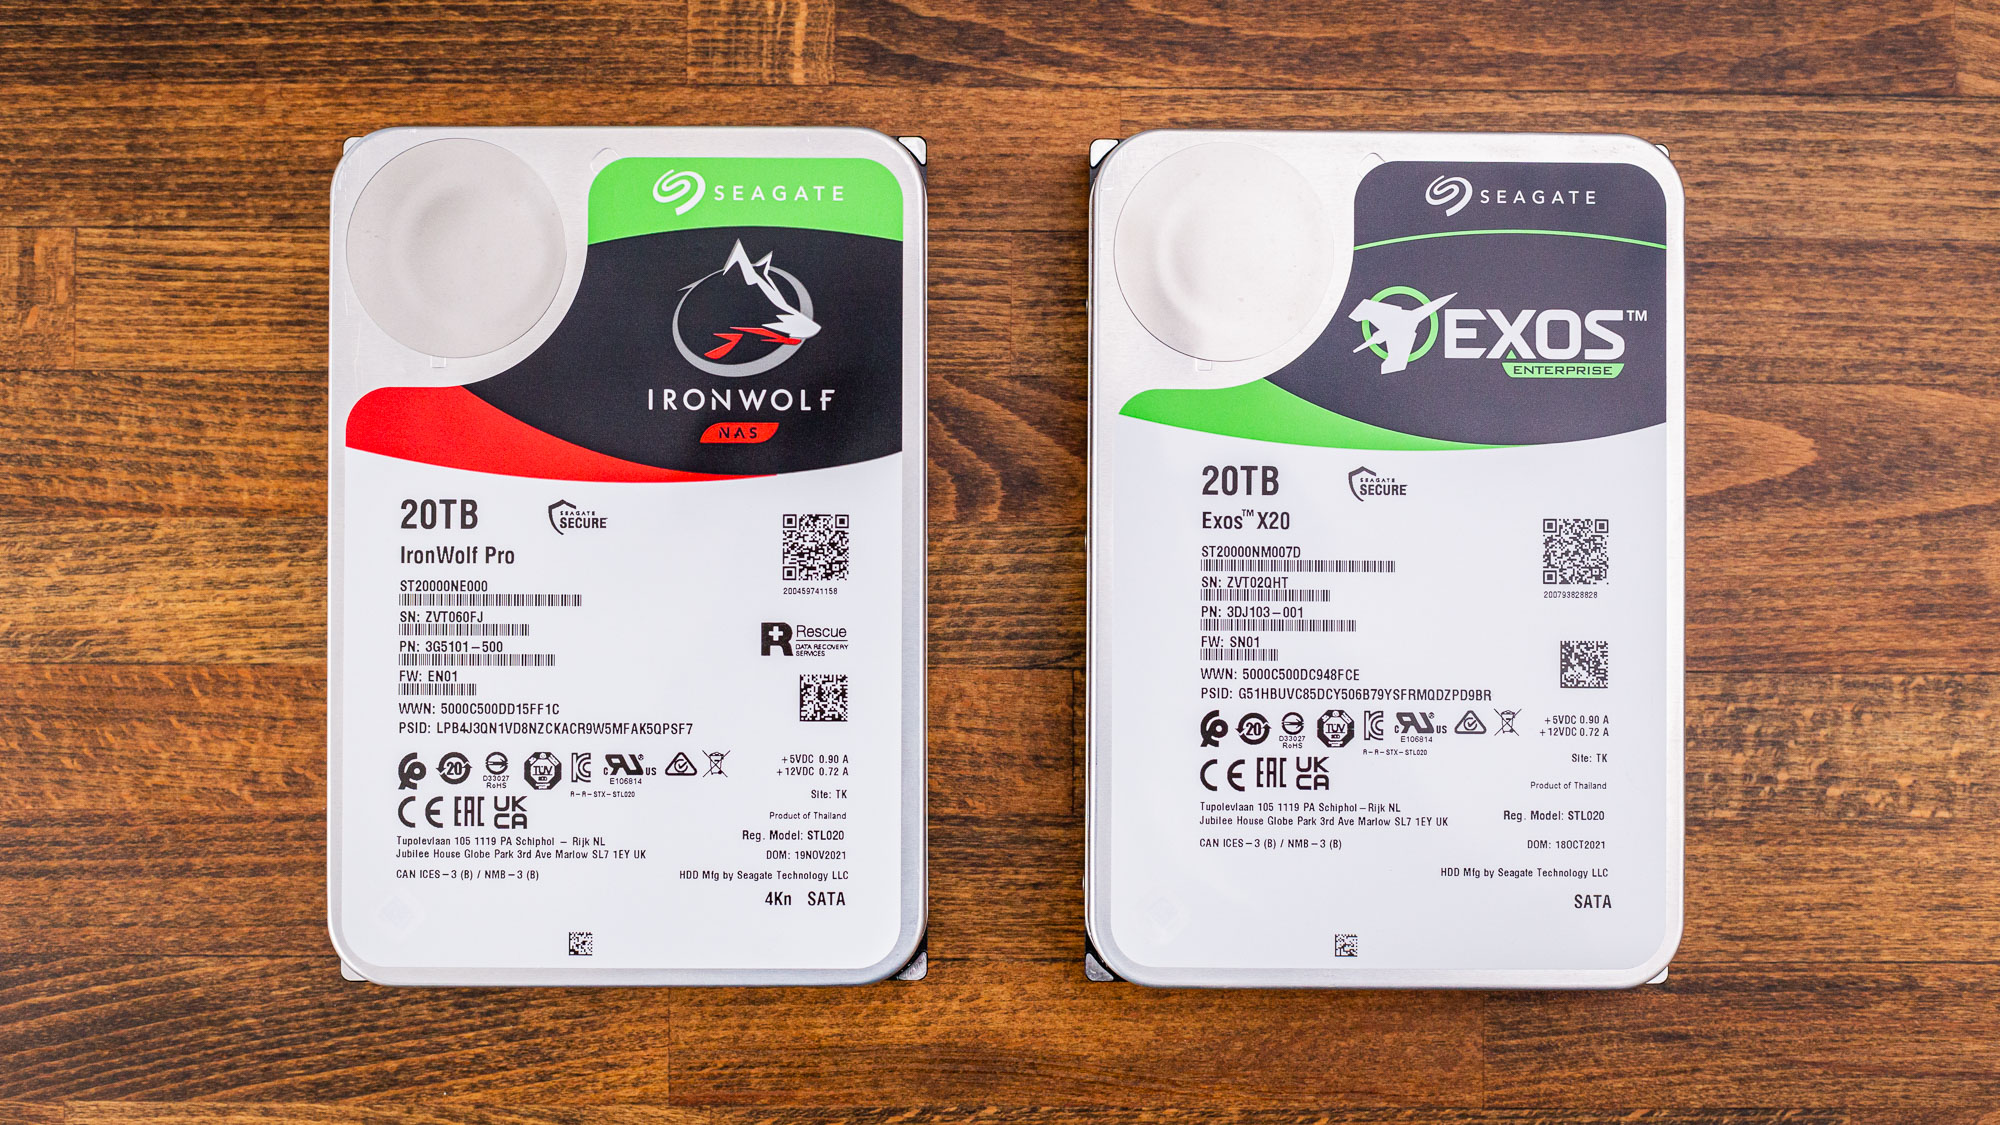
Comparison Products
We’re comparing these two drives against a diverse selection of hard drives, including the 6TB WD Black WD6003FZBX, a gaming HDD, the Seagate IronWolf Pro NAS 8TB, Toshiba’s DT01ACA300 at 3TB, and the helium-filled 8TB HGST UltraStar He8. These drives, as tested, are 7200RPM which indicates an average latency of around 4.17ms. We're building out a more diverse set of comparables for future HDD reviews, but this selection provides a solid comparison of drives aimed at different types of applications.
Trace Testing - 3DMark Storage Benchmark
Built for gamers, 3DMark’s Storage Benchmark focuses on real-world gaming performance. Each round in this benchmark stresses storage based on gaming activities including loading games, saving progress, installing game files, and recording gameplay video streams.
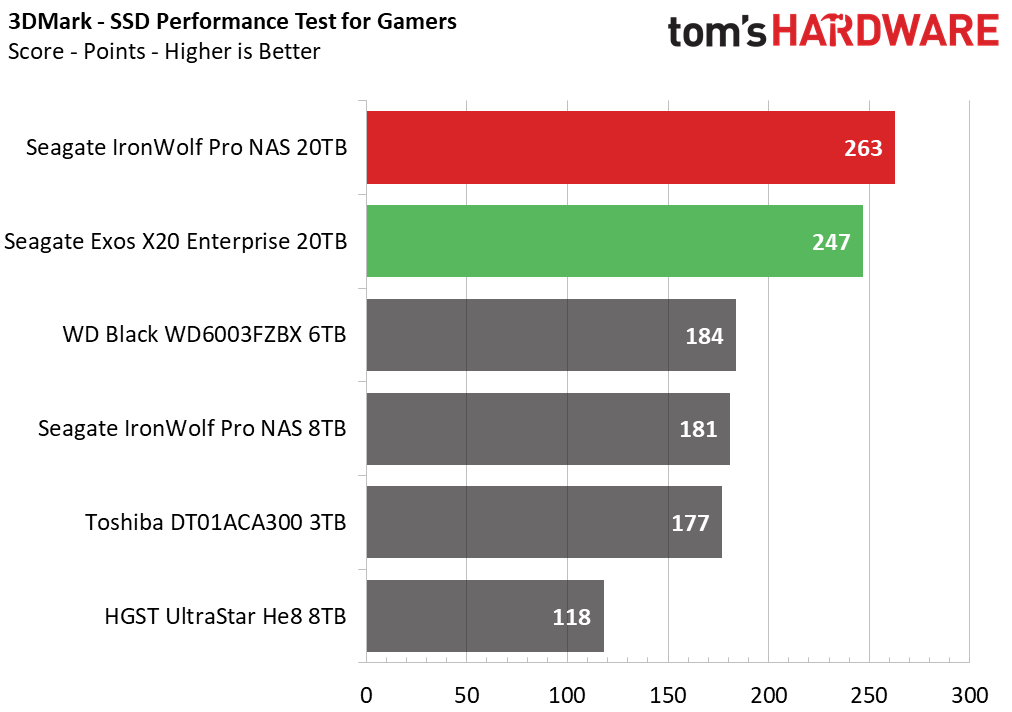
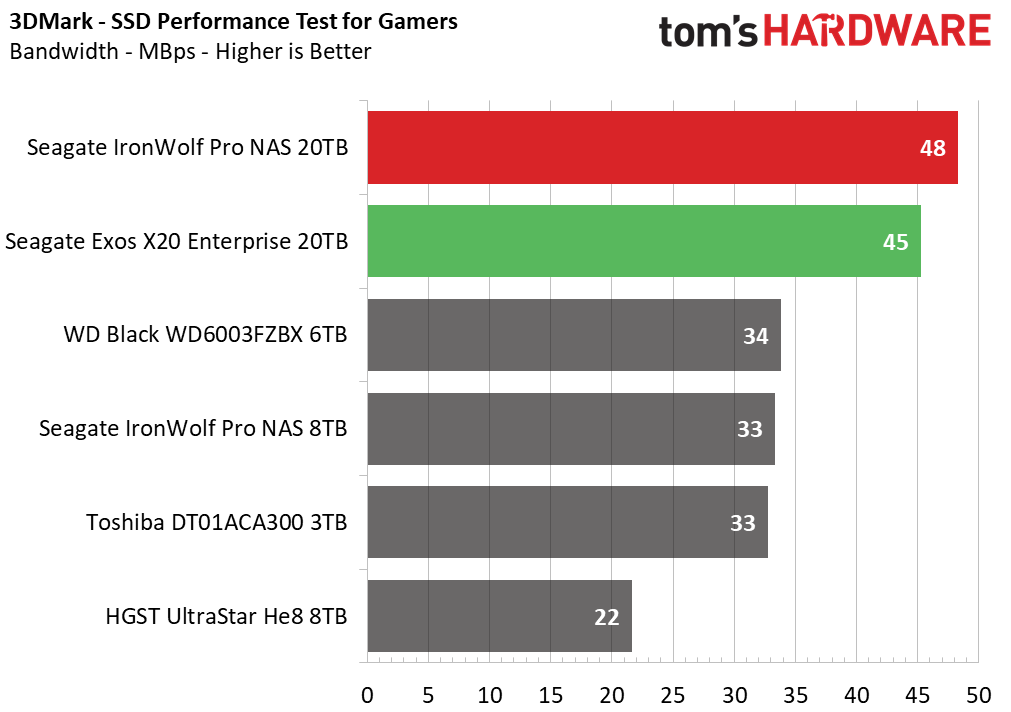
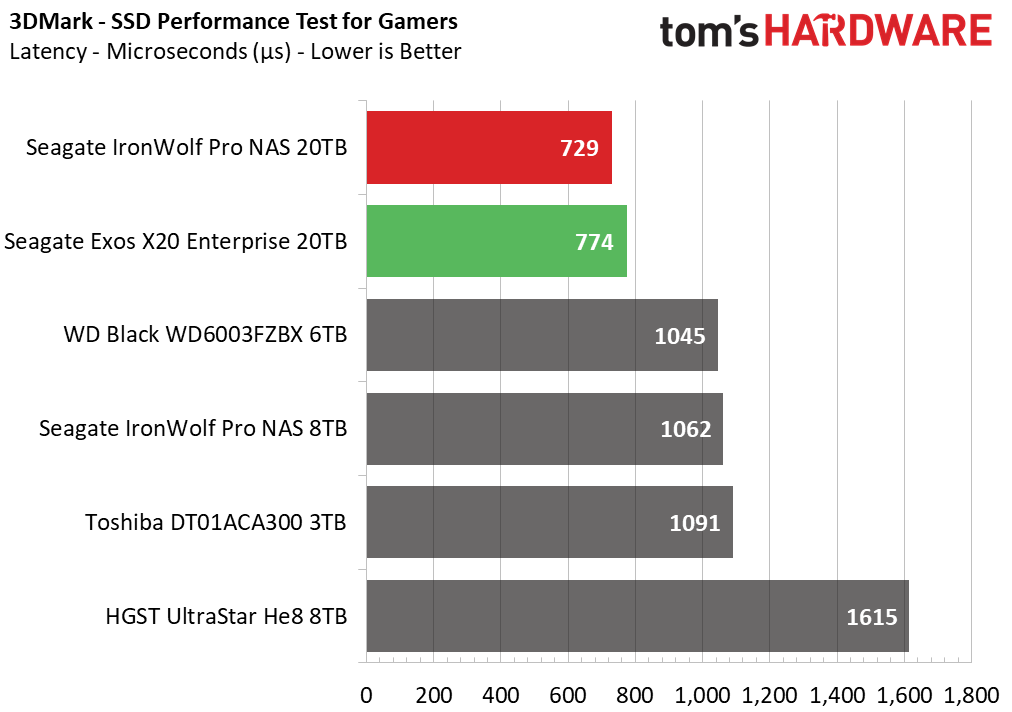
Hard drives are far from ideal for gaming these days — SSDs have become more affordable, and they load games far faster. Games are only getting larger, and technologies like DirectStorage ensure that future titles could require SSDs for the best performance.
Current-gen consoles already use these technologies, and those games will be ported to personal computers (PCs). That is to say, the ability to leverage performance characteristics of SSDs rather than HDDs is the way forward for gaming, although capacity remains an issue. QLC- and PLC-based drives of the future may alter this equation, particularly with the assistance of compression.
Trace Testing – PCMark 10 Storage Benchmark
PCMark 10 is a trace-based benchmark that uses a wide-ranging set of real-world traces from popular applications and everyday tasks to measure the performance of storage devices.
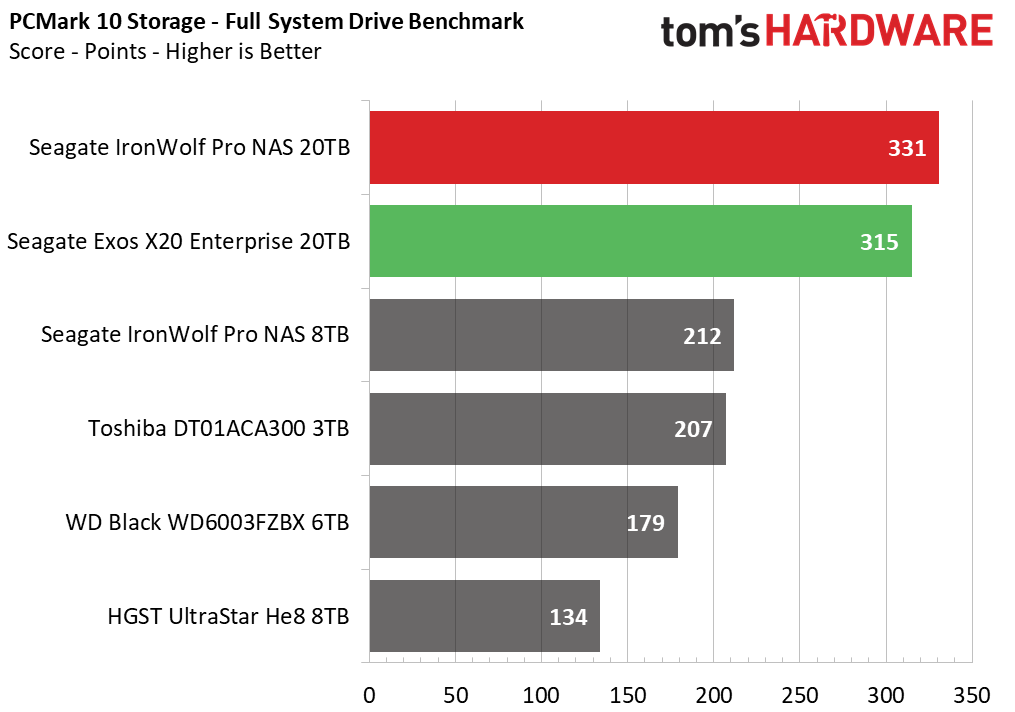
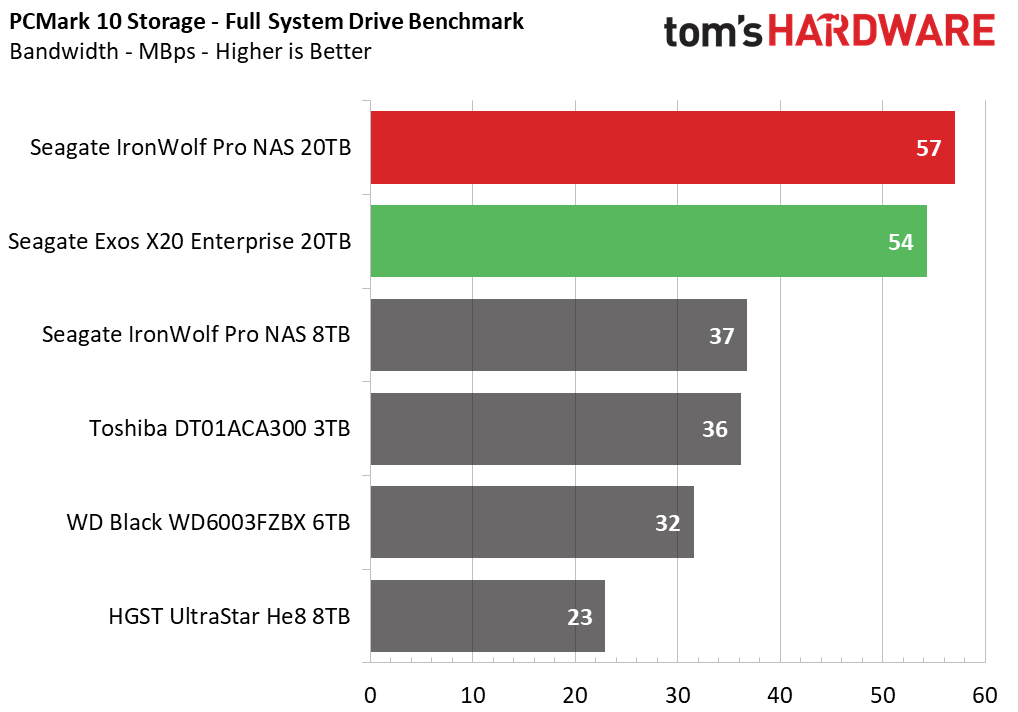
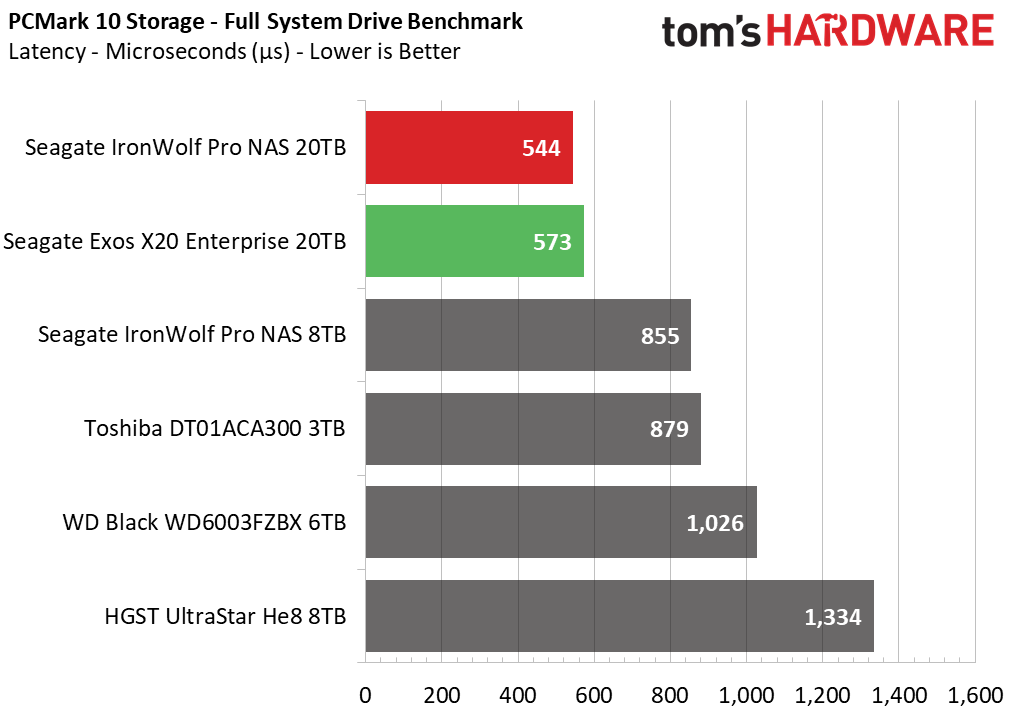
As we expected, Seagate’s 20TB drives are on top here: Functionally the two drives are very similar. HGST’s UltraStar falls behind while the other three contenders perform roughly the same and land in the middle of the pack.
Transfer Rates – DiskBench
We use the DiskBench storage benchmarking tool to test file transfer performance with a custom, 50GB dataset. We copy 31,227 files of various types, such as pictures, PDFs, and videos to a new folder and then follow-up with a reading test of a newly-written 6.5GB zip file.
Get Tom's Hardware's best news and in-depth reviews, straight to your inbox.
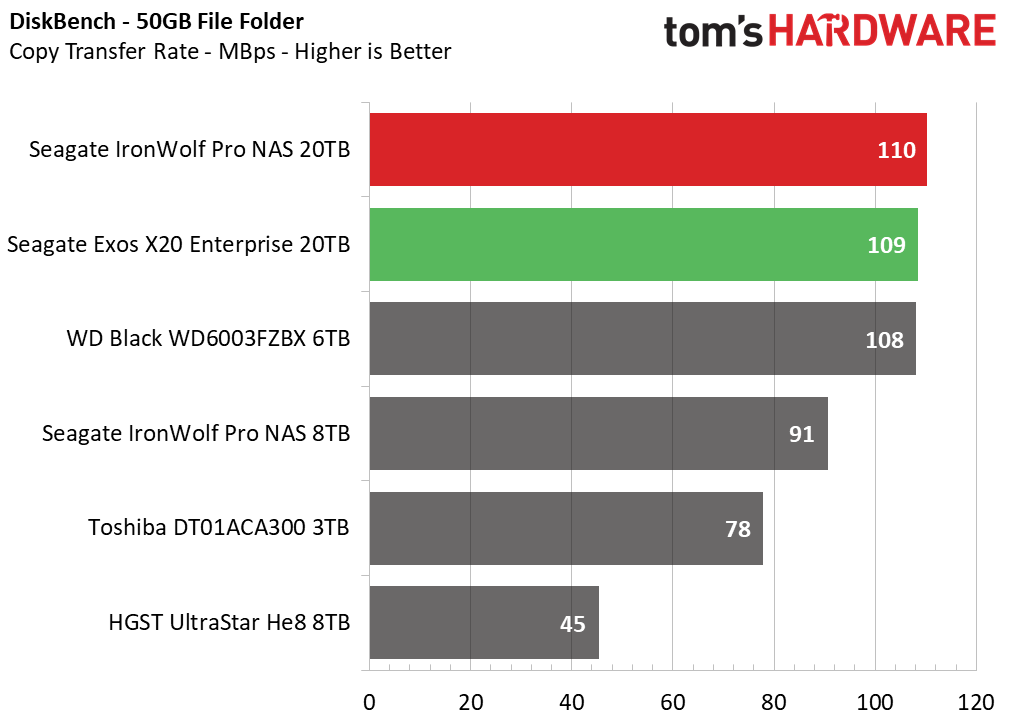
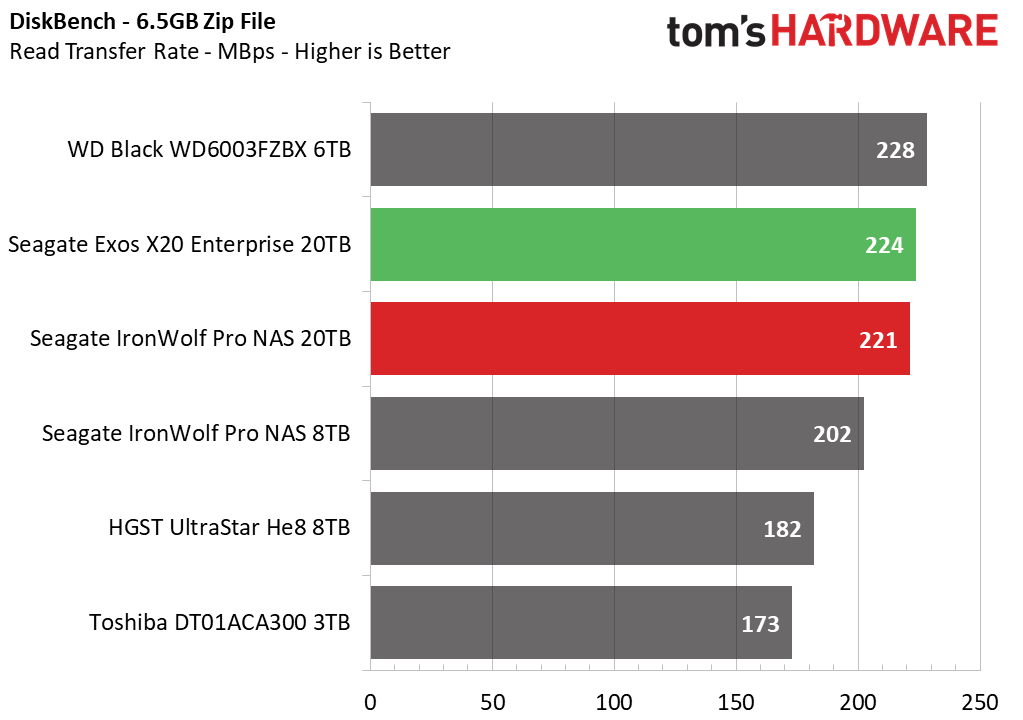
We see HGST’s drive fall behind again. Otherwise, ranks correlate to capacity, except for the WD Black which holds up well.
Synthetic Testing - ATTO / CrystalDiskMark
ATTO and CrystalDiskMark (CDM) are free and easy-to-use storage benchmarking tools that SSD vendors commonly use to assign performance specifications to their products. Both of these tools give us insight into how each device handles different file sizes.
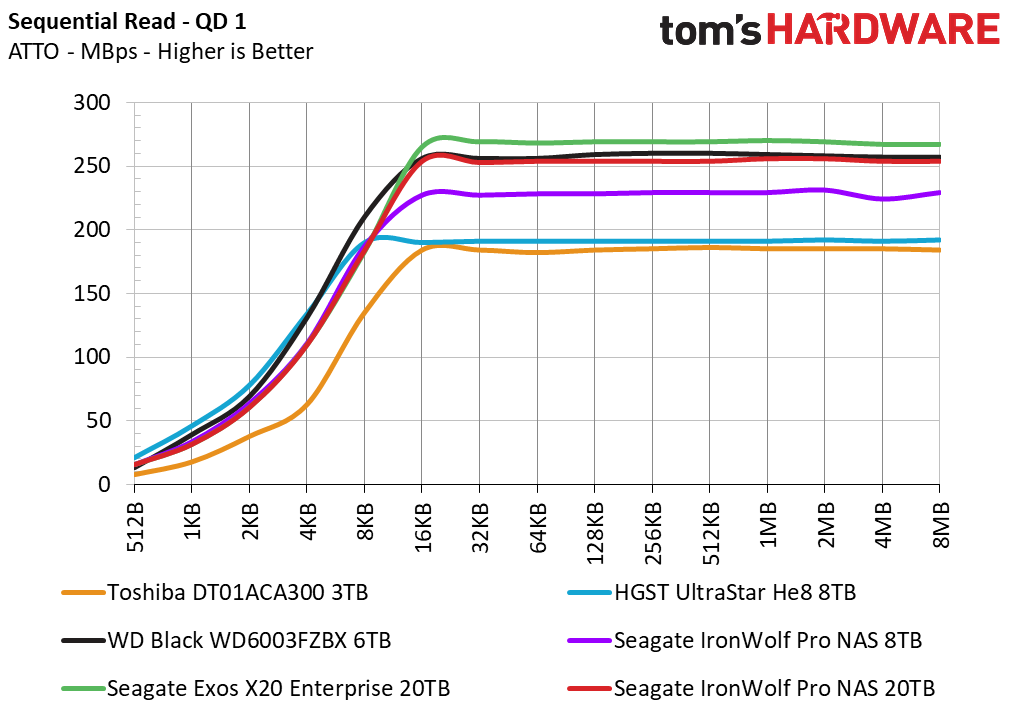
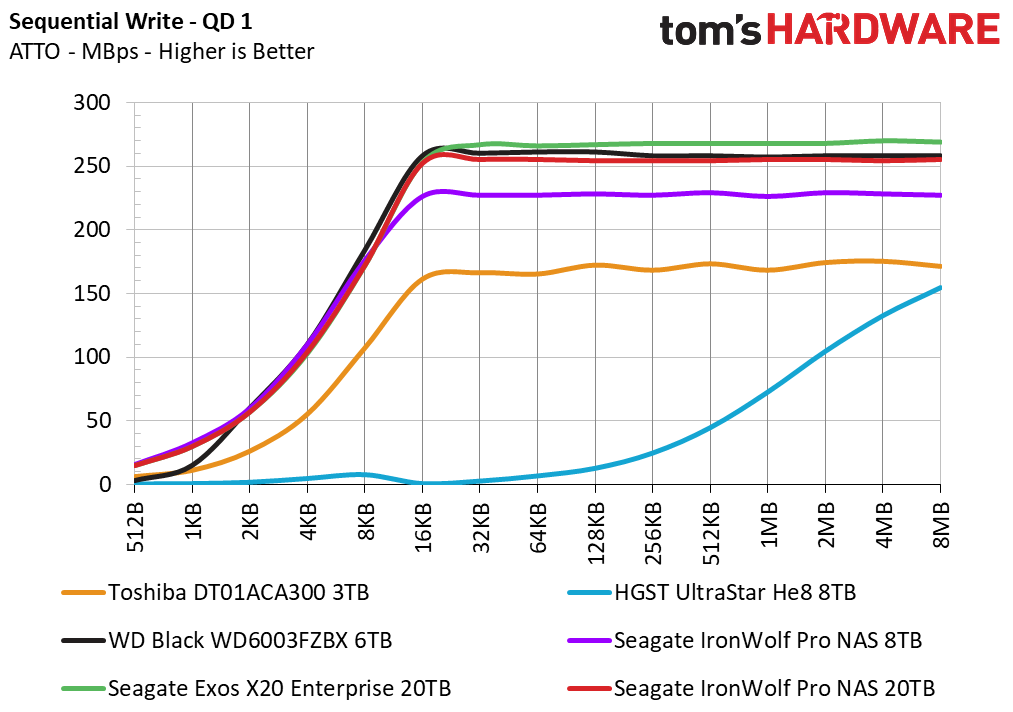
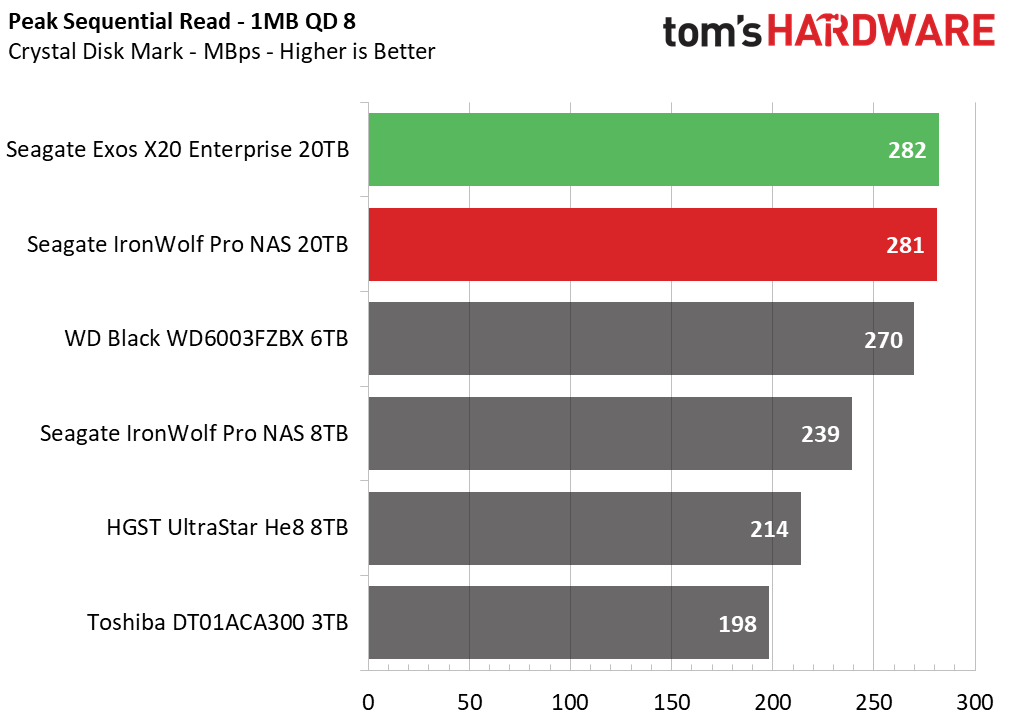
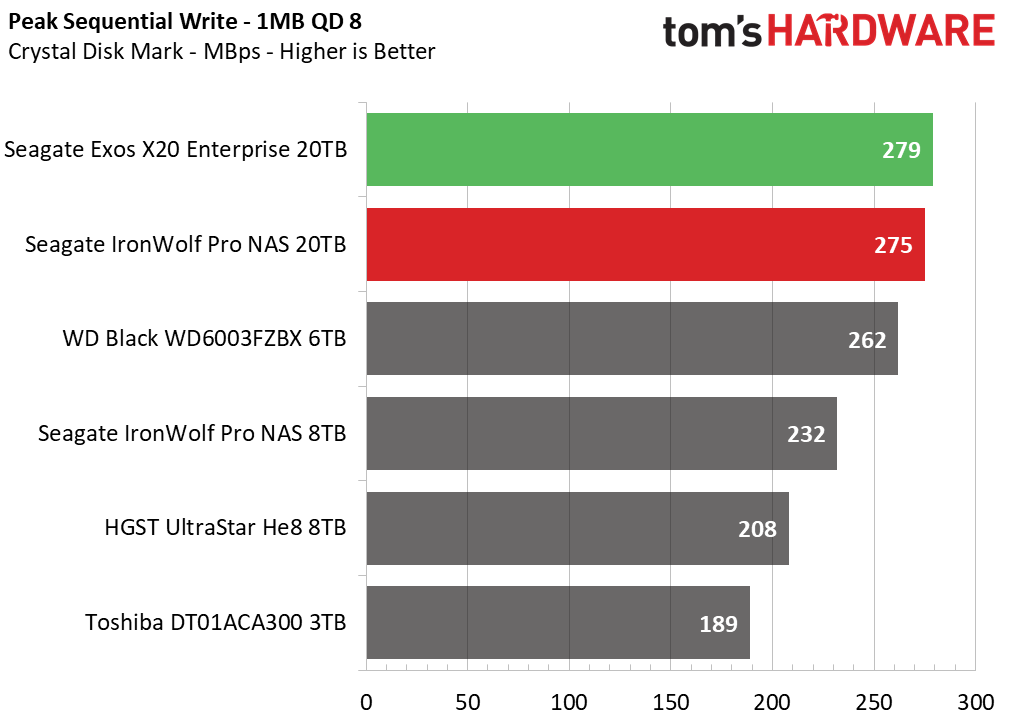
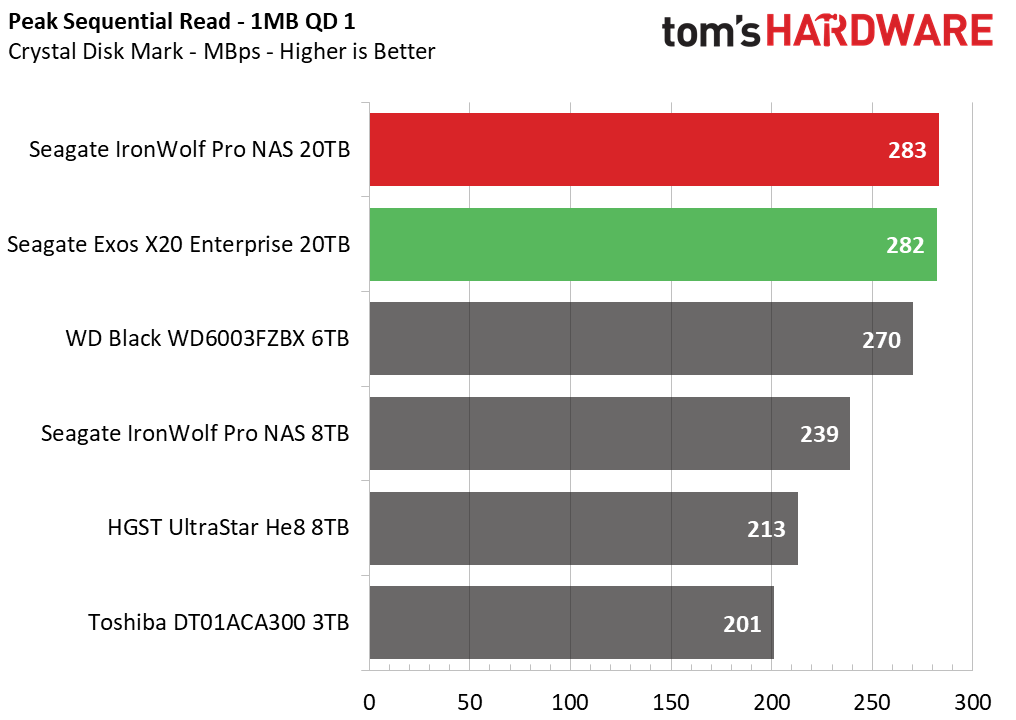
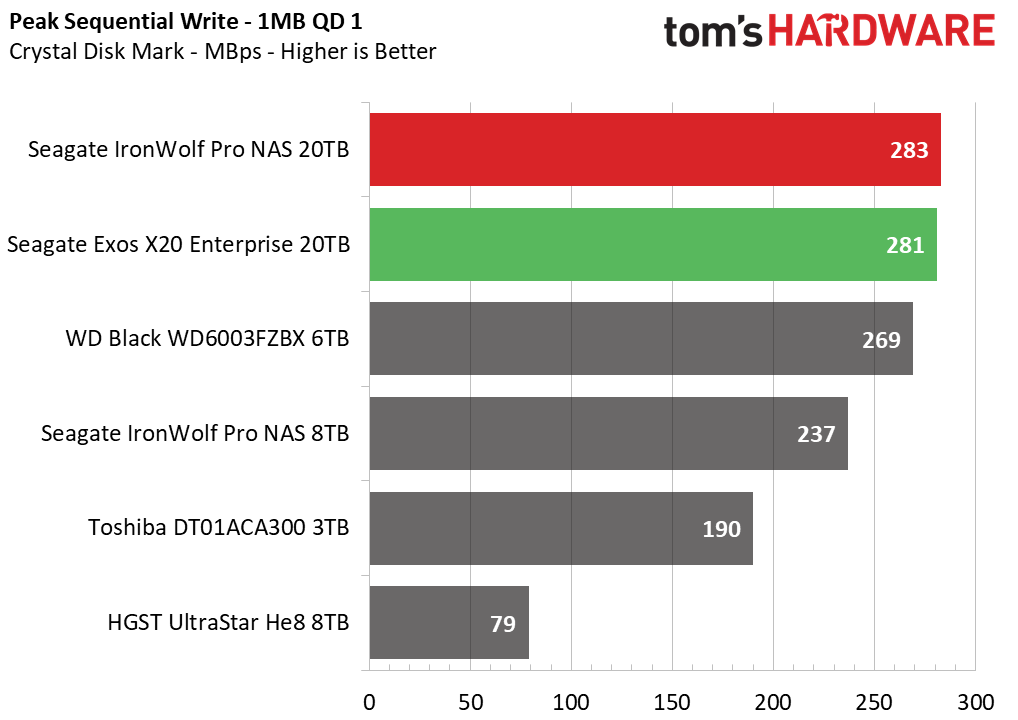
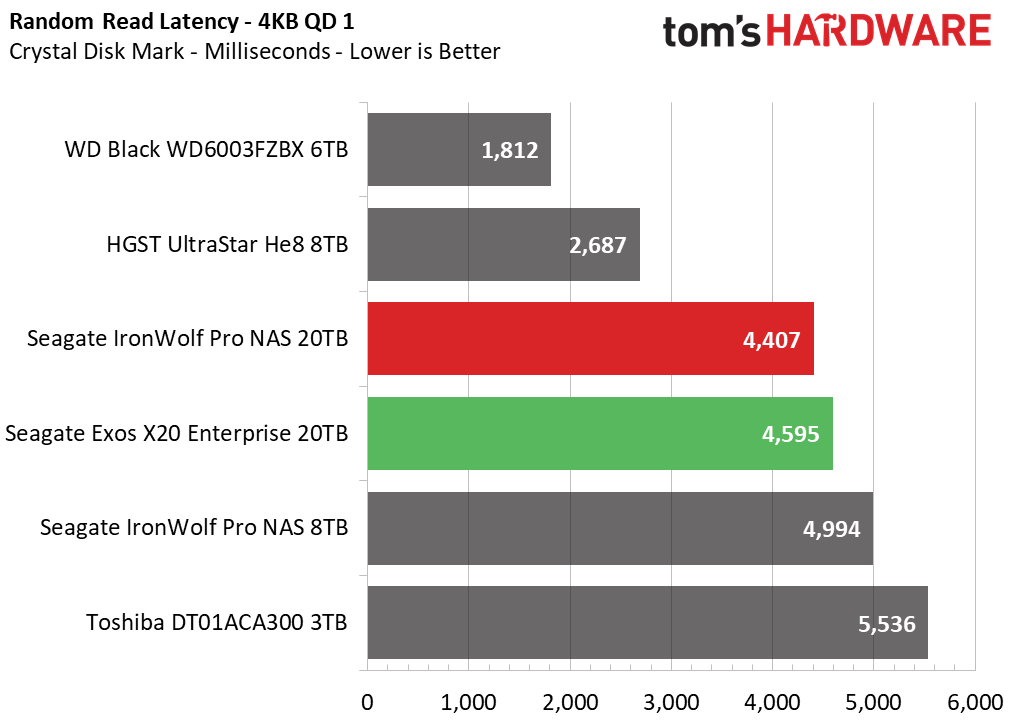
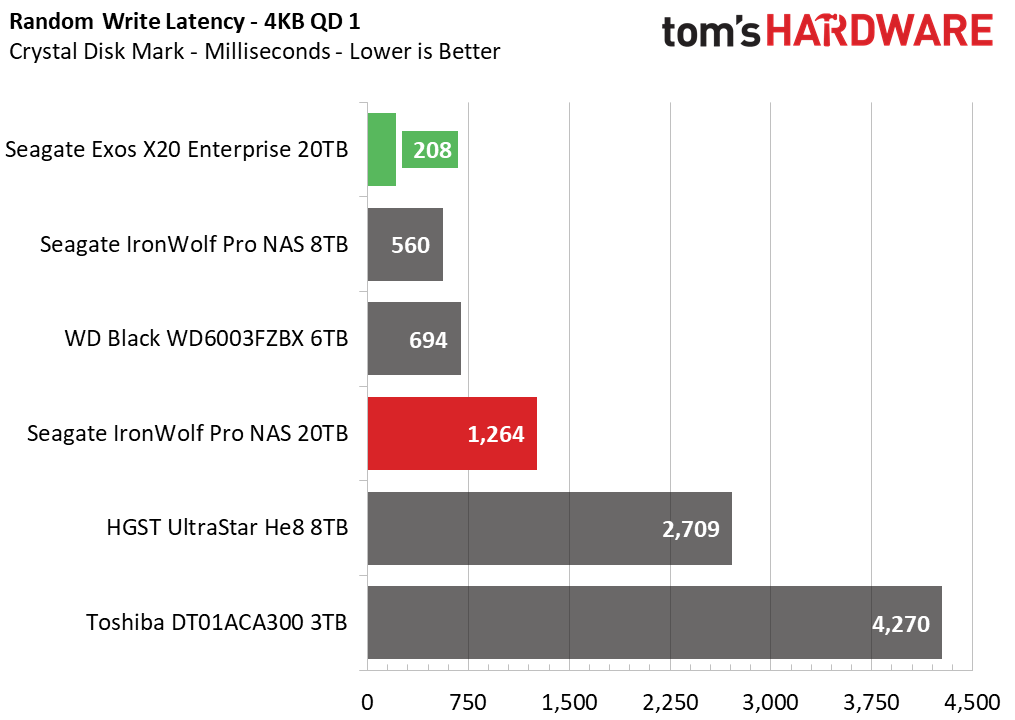
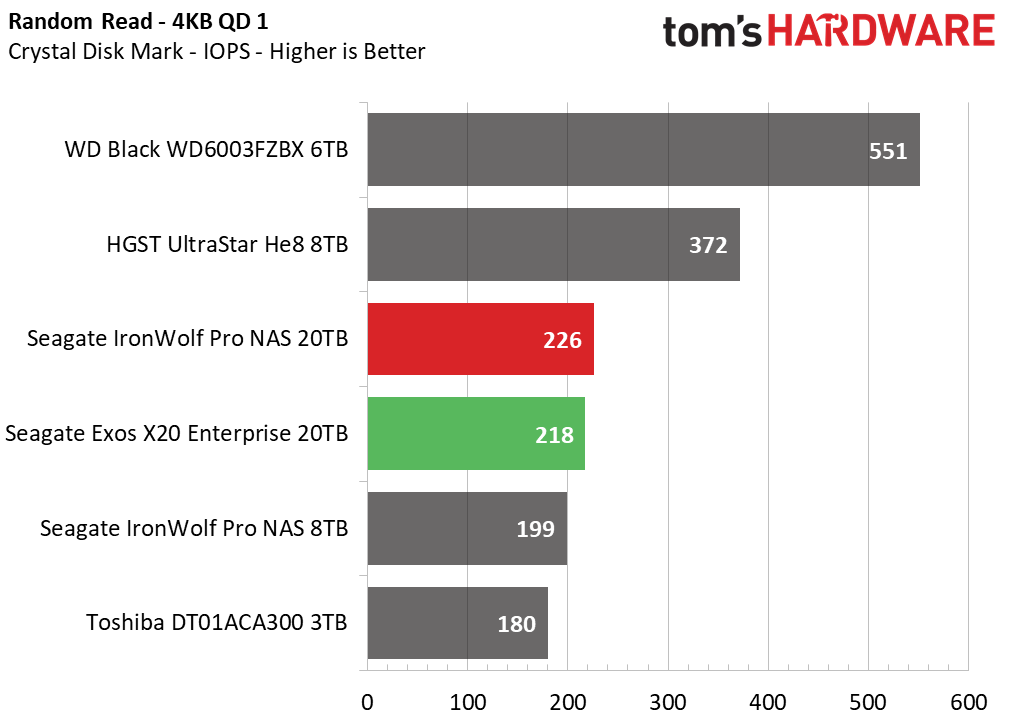
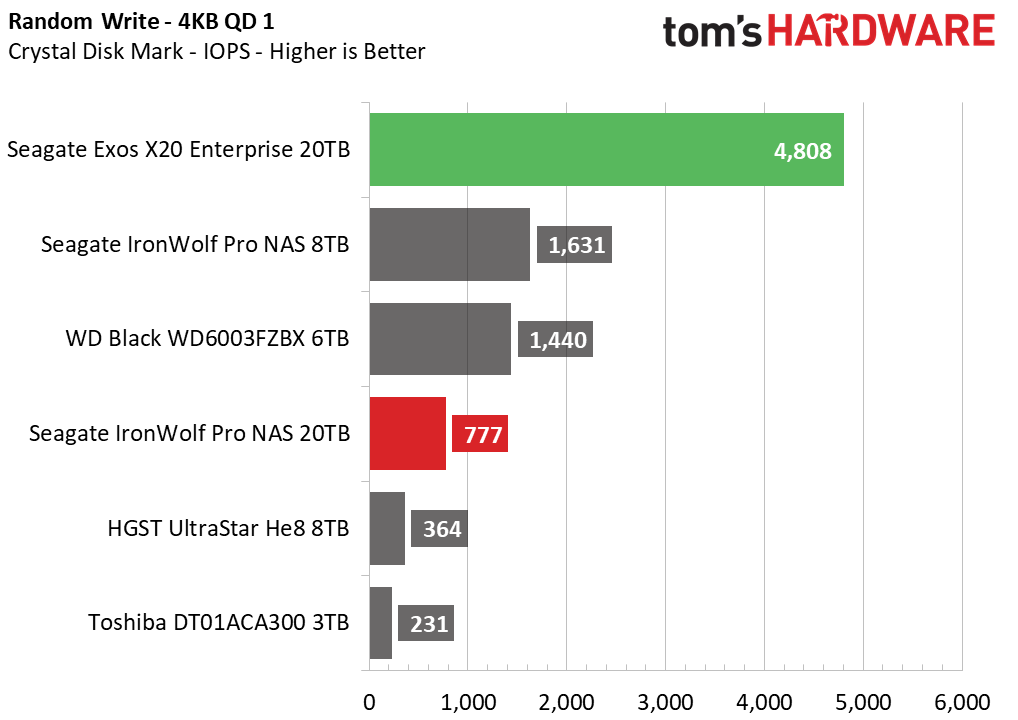
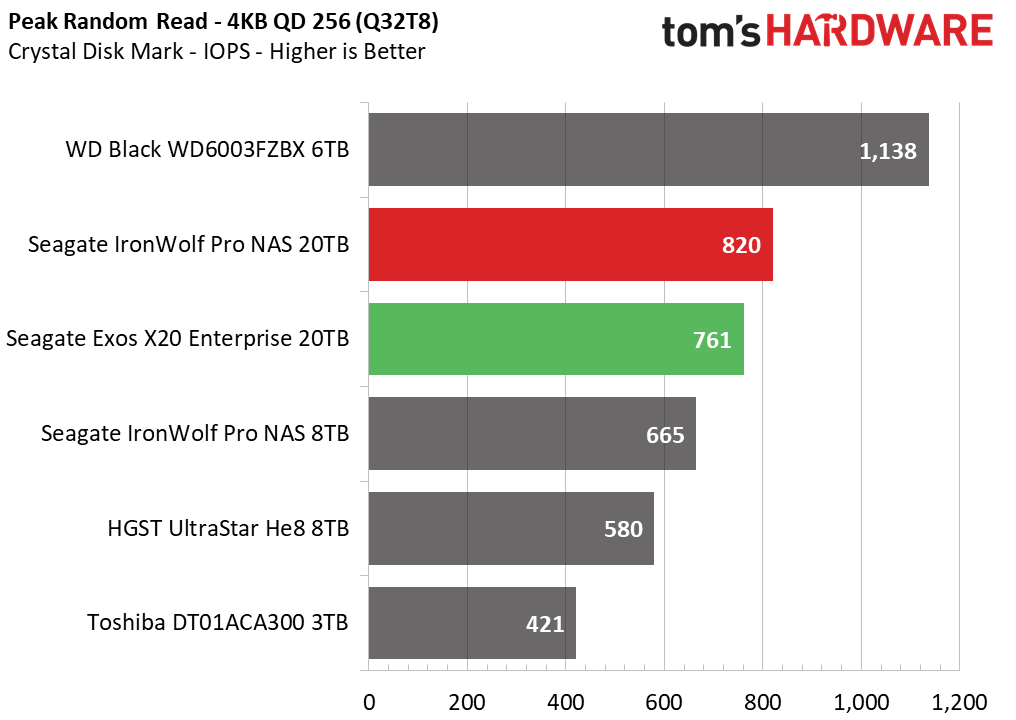
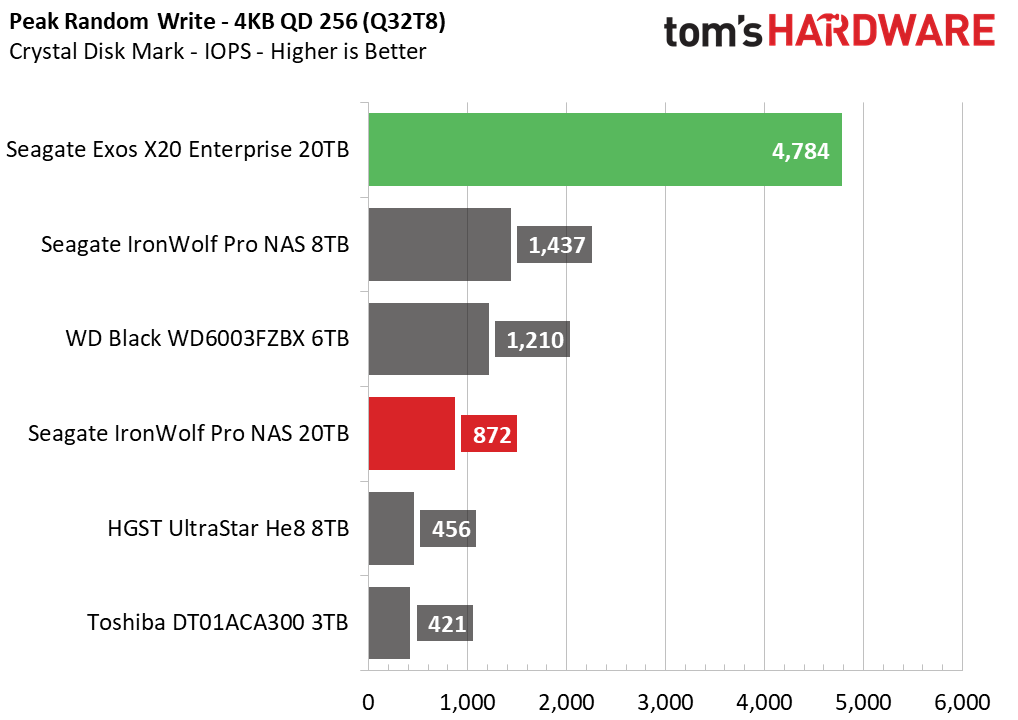
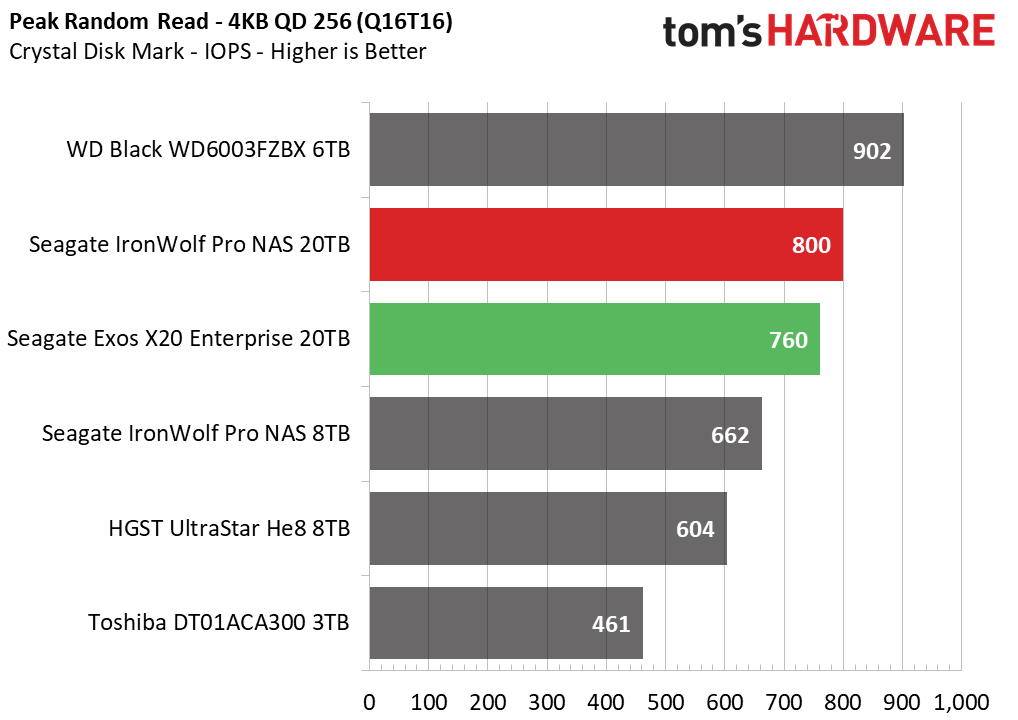
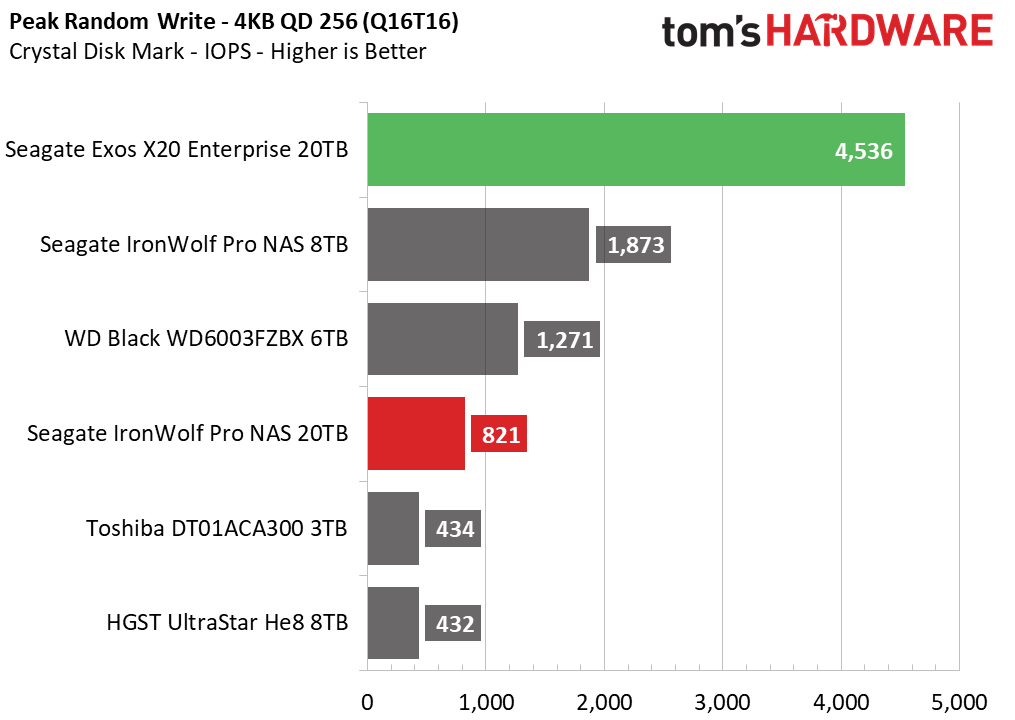
Here we see results that align with what we saw in DiskBench: the WD Black is hanging with the 20TB drives while the alternatives are slower, roughly stratifying along capacity lines. The He8 is again a stand-out — in a bad way — with particularly poor sequential write performance. We can see that HDDs prefer larger block sizes, and, of course, we know they cannot compete with SSDs with smaller I/O, especially the random I/O we see in some CrystalDiskMark (CDM) tests.
Of course, higher capacity is not always better, as we see there with 4KB QD1 random reads that tend to dictate how fast a drive feels in an operating system environment. However, the He8 finally shows up for those two tests, and the WD Black continues to do well.
However, we can see the Exos X20, in particular, does well with random writes. Here the drive is better than its IronWolf Pro sibling, suggesting the possibility of firmware optimization.
Sustained Write Performance
Official write specifications are only part of the performance picture. Most HDDs implement a write cache which is a fast area of volatile memory, like DRAM. Sustained write speeds hit the platters directly and tend to be consistent. There are exceptions to both of these statements, as there are SSHDs (flash-containing hybrid HDDs), OptiNAND drives, and SMR drives that deviate from the traditional configuration. We use Iometer to detect the maximum sustained write speed of the HDD.
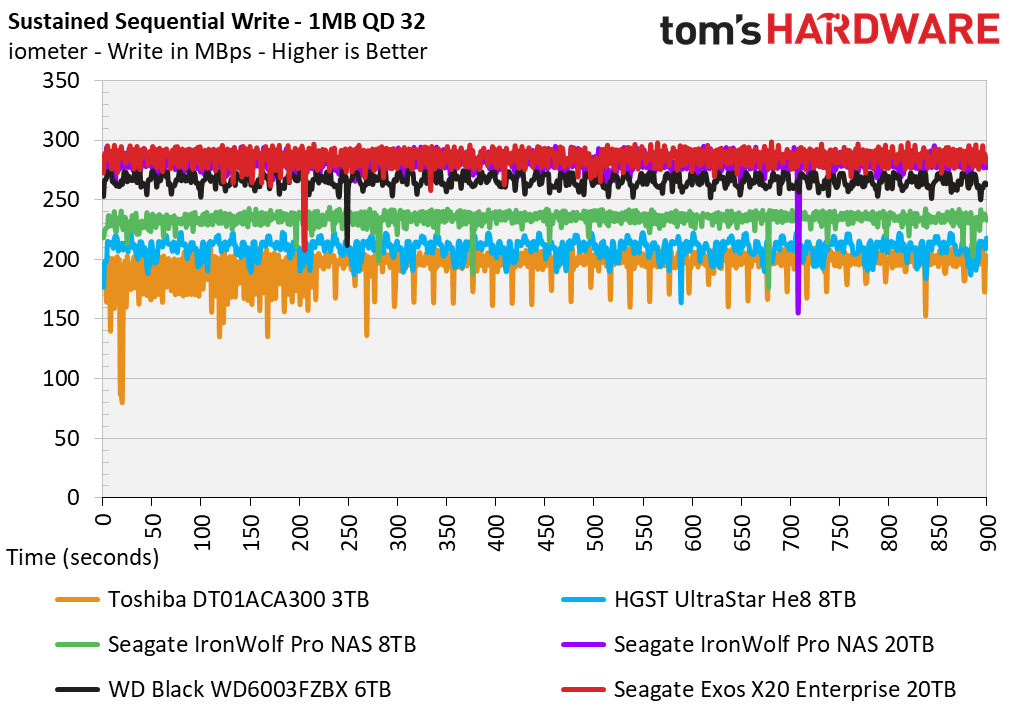
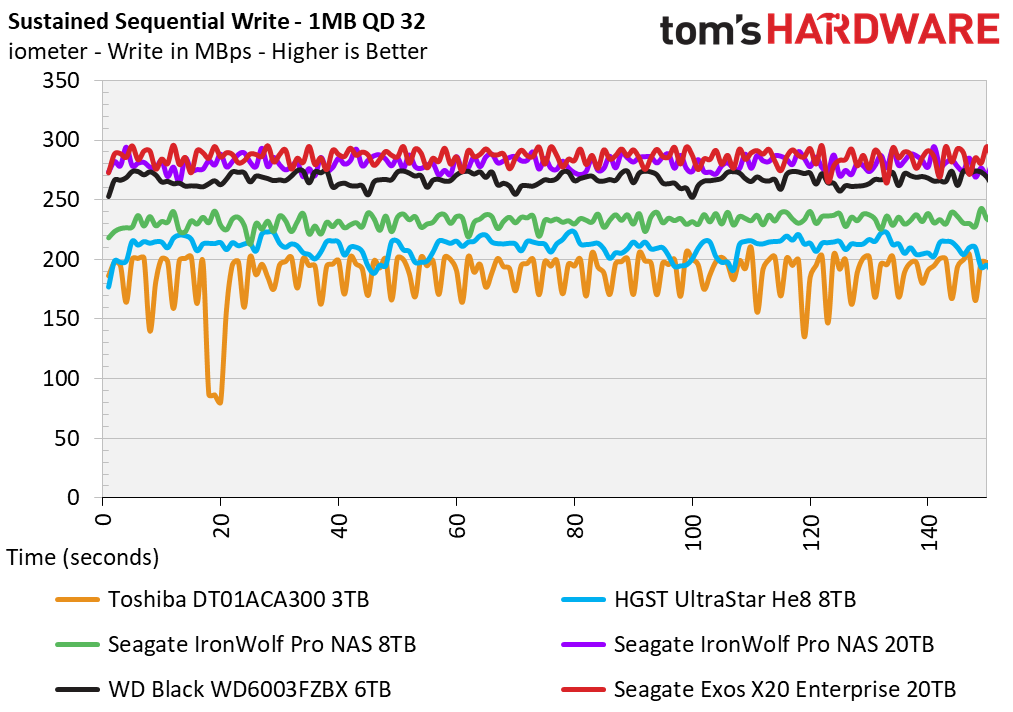
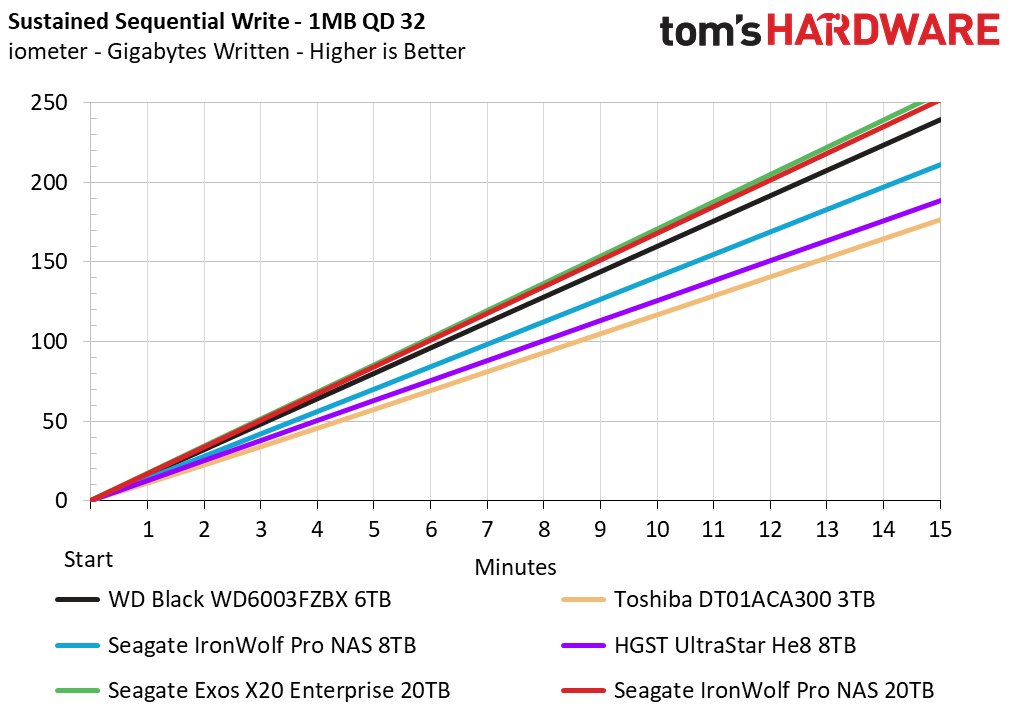
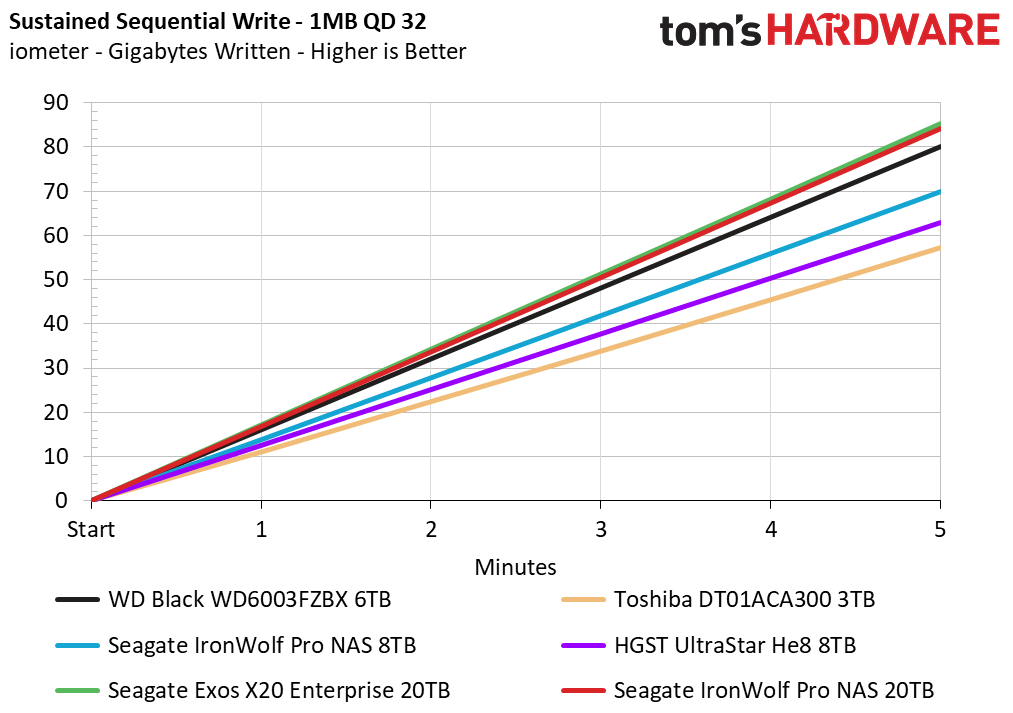
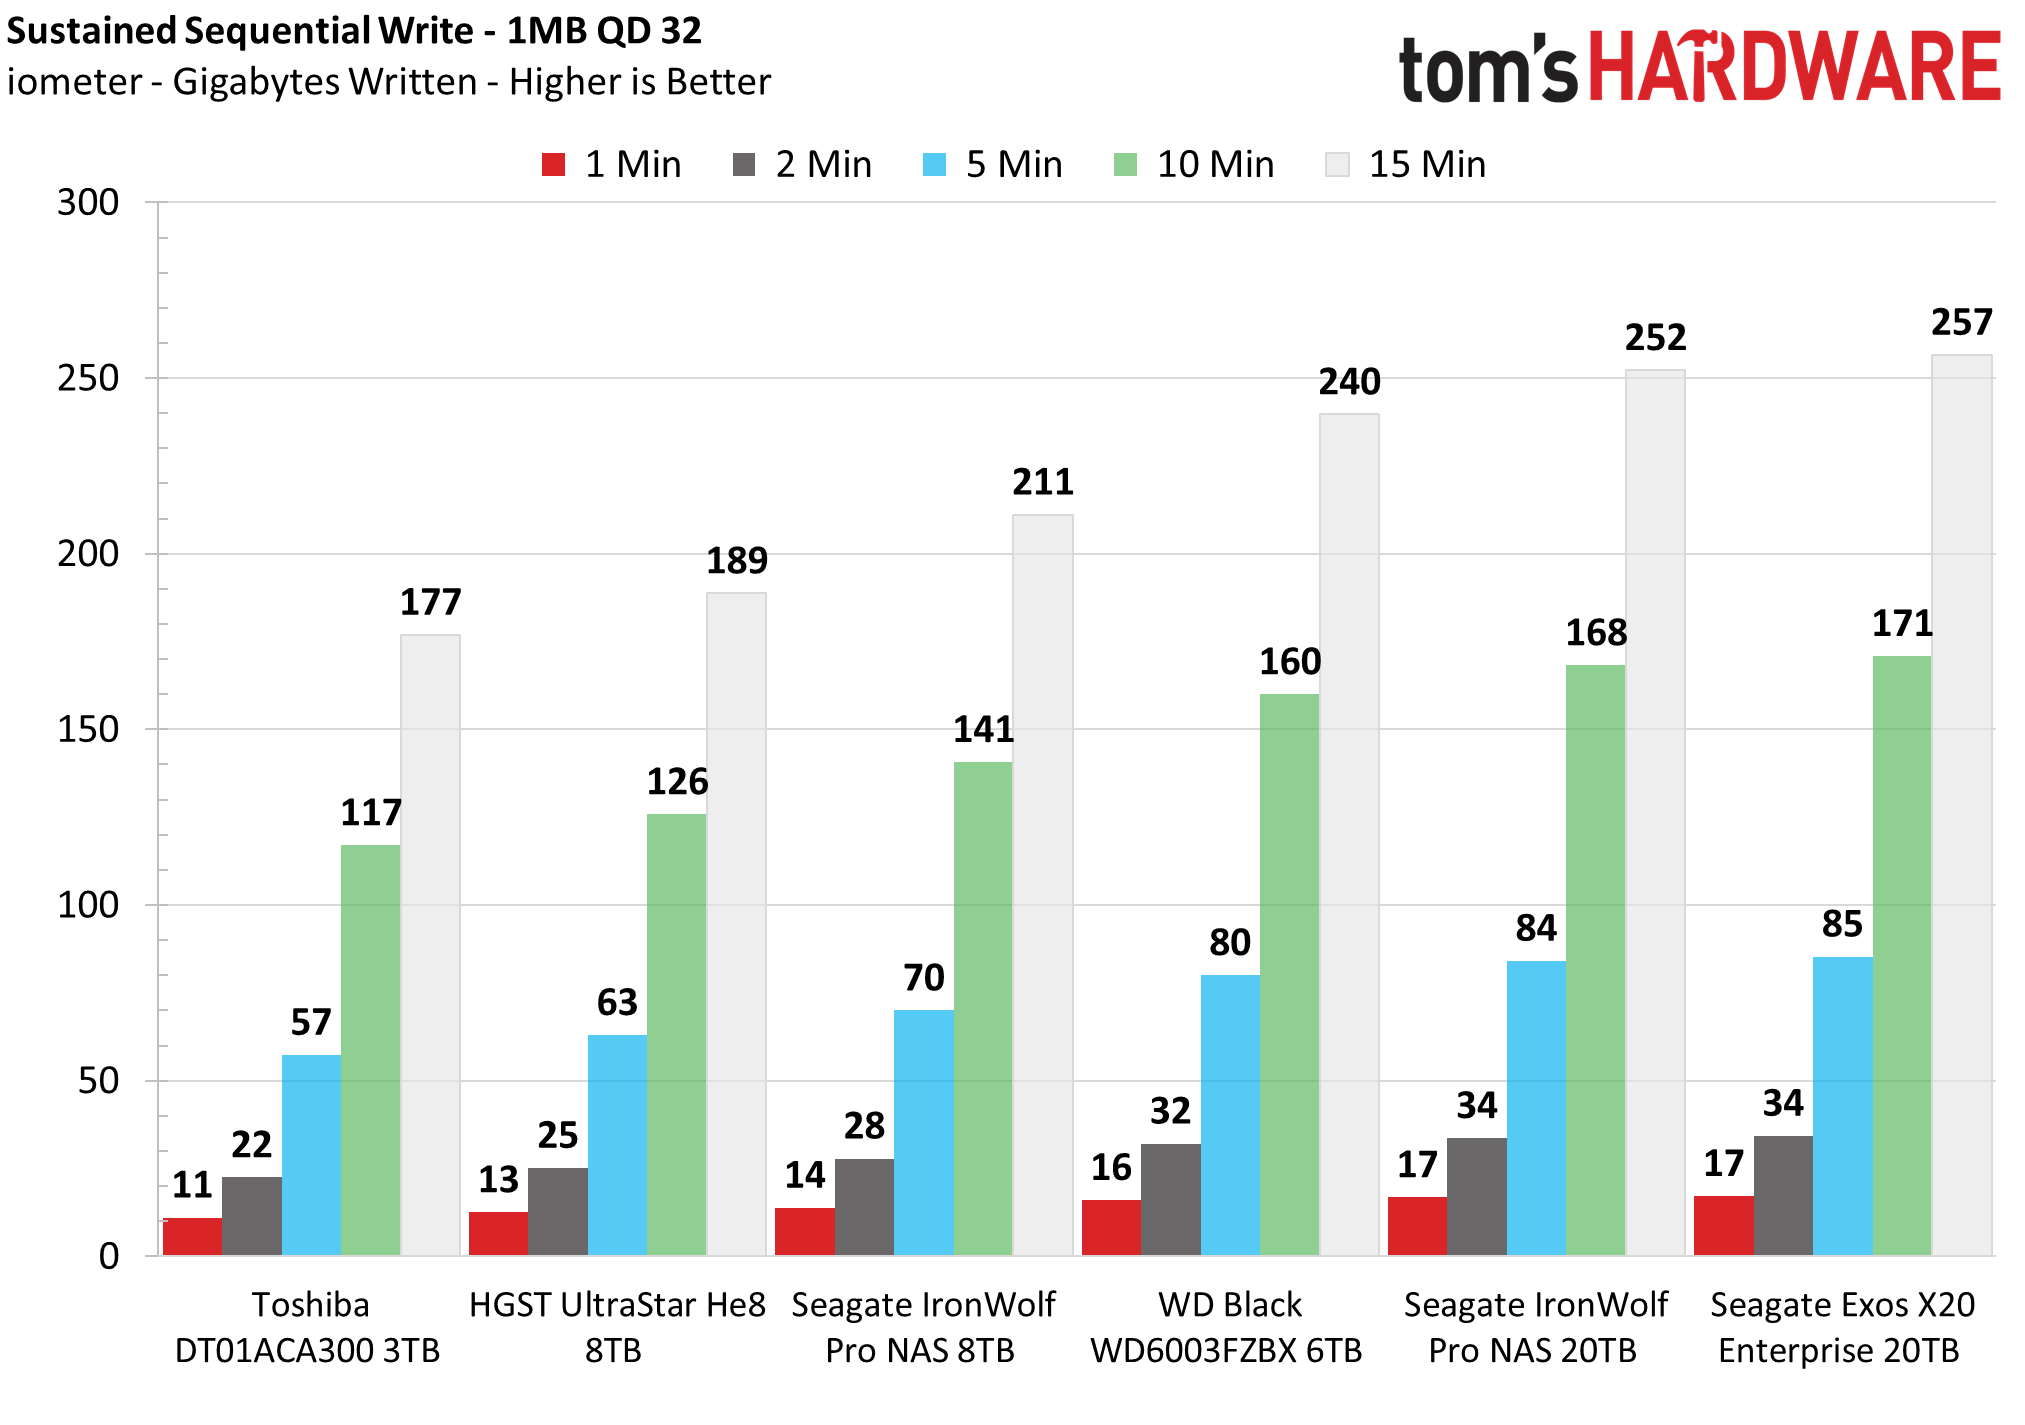
One area HDDs can be consistent is with sustained, sequential writes. SSD performance in this space is much more variable. Performance consistency is always valued in non-consumer markets, and products are often selected to match anticipated workloads. In this case, there’s a general trend towards better write performance with higher capacity, although again, the WD Black outperforms this expectation while the He8 underperforms. HDDs in the future may be faster here, for example, by using multiple actuators, and there is a trend towards unifying mechanical storage with flash vis-a-vis the NVMe Specification 2.0.
While SSDs rely on SLC caching (native flash in a single-bit, pseudo-SLC mode) and have some small write combining in volatile memory, hard drives traditionally rely on substantial volatile DRAM to act as a cache to mitigate physical performance pitfalls. As such, speaking of cache recovery here is unnecessary, particularly given that the cache is small relative to the capacity of the drives.
Power Consumption and Temperature
We use the Quarch HD Programmable Power Module to gain a deeper understanding of power characteristics. Average workload power consumption and max consumption are important aspects of power consumption, but performance-per-watt is more important. A drive might consume more power during any given workload, but accomplishing a task faster allows the drive to drop into an idle state more quickly, ultimately saving energy.
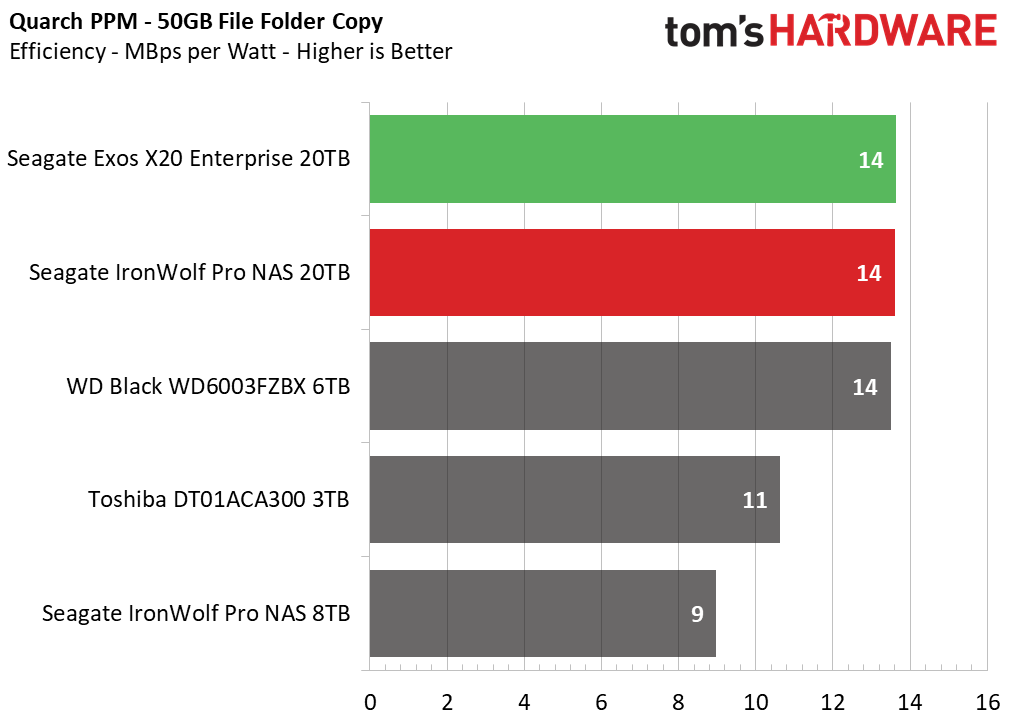
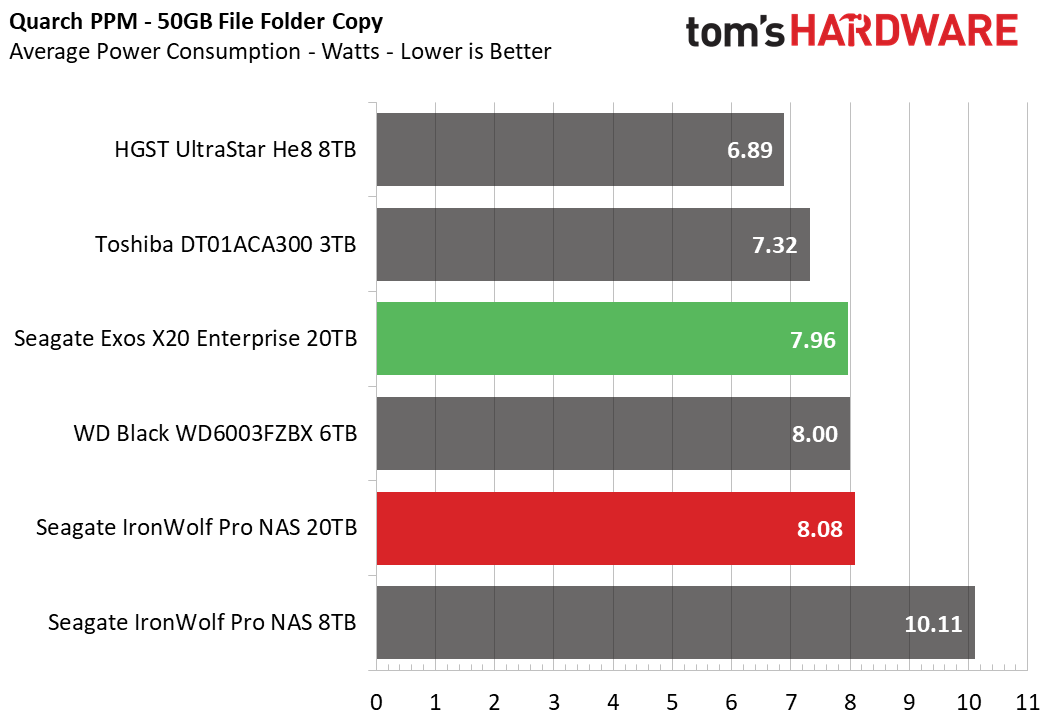
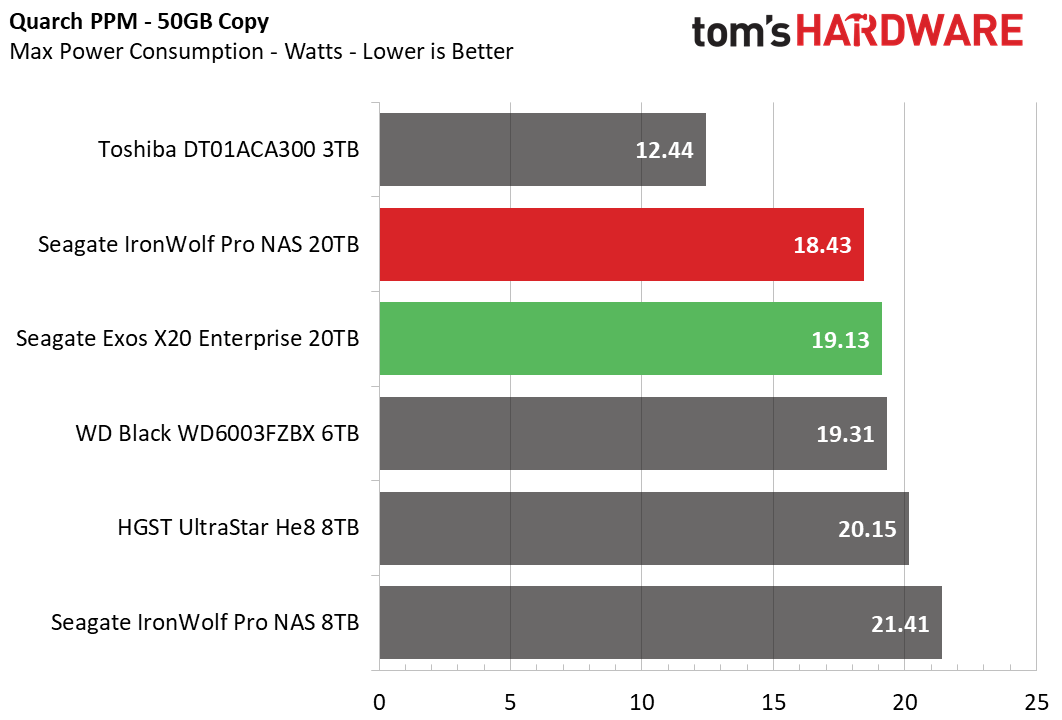
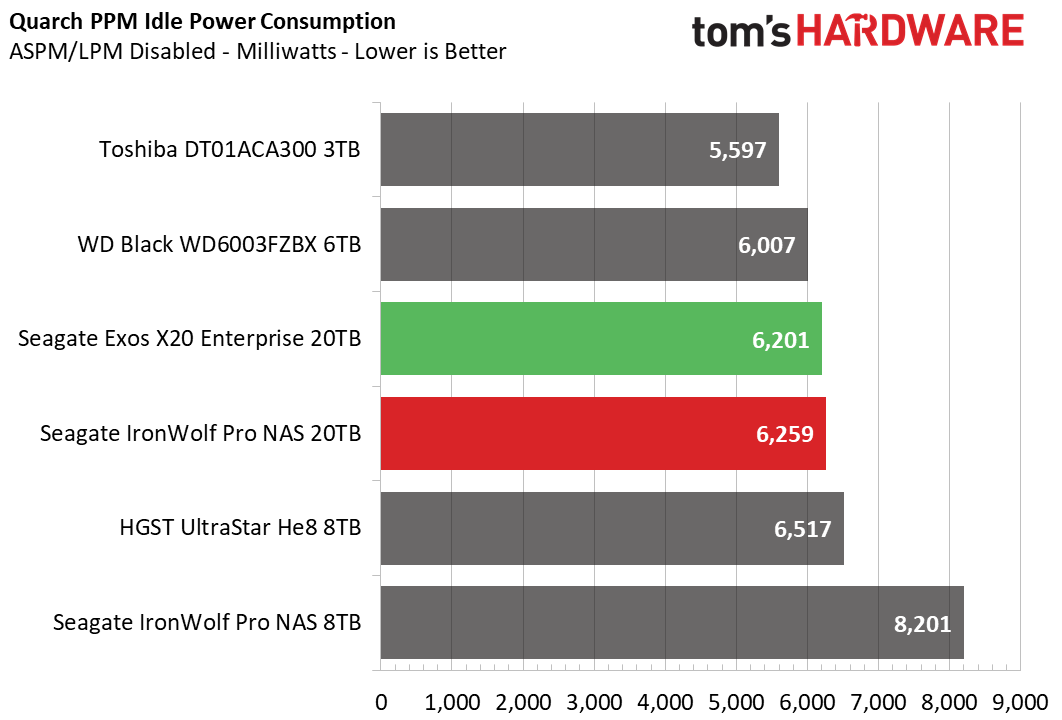
Efficiency is the name of the game with hyper-scaled systems, and here we see that the 20TB Seagate drives deliver on a watts-per-TB of capacity measure, pulling less power than some drives with less capacity. The WD Black again matches up, but it’s worth considering that it provides less than one-third of the capacity in the same space.
Physical space is often a premium in enterprise and, further, NAS systems may have a limited number of bays — not to mention that cost can scale with the bay count. There are secondary effects here, such as with efficiency and cooling, but the idea is that one is considering these drives predominately for their high capacities within a given power footprint.
Test Bench and Testing Notes
| CPU | Intel Core i9-11900K |
| Motherboard | ASRock Z590 Taichi |
| Memory | 2x8GB Kingston HyperX Predator DDR4 5333 |
| Graphics | Intel UHD Graphics 750 |
| CPU Cooling | Alphacool Eissturm Hurricane Copper 45 3x140mm |
| Case | Streacom BC1 Open Benchtable |
| Power Supply | Corsair SF750 Platinum |
| OS Storage | WD_Black SN850 2TB |
| Operating System | Windows 10 Pro 64-bit 20H2 |
We use a Rocket Lake platform with most background applications such as indexing, windows updates, and anti-virus disabled in the OS to reduce run-to-run variability.
Conclusion
If you’re looking for 20TB of capacity in a conventional hard drive, these two options from Seagate are spot-on. It will be interesting to see what the competition can do, although WD’s OptiNAND will fundamentally operate a bit differently. Ultimately there is more than one way to increase the limits of HDD capacity, with various trade-offs to consider, with performance a secondary concern. Sometimes you just want a lot of reliable capacity that matches your performance threshold, and these drives fit the bill with solid performance and reliability metrics.
While the Exos X20 and IronWolf Pro 20TB are nearly the same drives there are some differences in how they are both tuned and marketed. It’s worth looking at Seagate’s datasheets to determine what you need. We give these drives high marks because they do exactly what they should do — but with the caveat that you’ll be paying a hefty premium to push the limits of capacity. Naturally, lower capacity points are more forgiving on a dollar-per-TB basis.
These drives do not seem well-suited for the general consumer since there are smaller drives that perform as well or better at a significantly lower cost per gigabyte. On the other hand, those who really need this kind of capacity and reliability in the smallest amount of physical space possible have some solid options.
MORE: Best SSDs
MORE: How We Test HDDs And SSDs
MORE: All SSD Content

Shane Downing is a Freelance Reviewer for Tom’s Hardware US, covering consumer storage hardware.
-
seanwebster Reply
We already have. If you can take another look, it’s the last chart in the power section gallery. Consumption is shown in milliwatts.Feistyweasel said:Can you measure idle power consumption for the two drives under review please? -
Feistyweasel Reply
Thank you! That's very useful :) I didn't realise the power section was a gallery.seanwebster said:We already have. If you can take another look, it’s the last chart in the power section gallery. Consumption is shown in milliwatts.
