Tom's Hardware Verdict
Silicon Power’s XD80 is a solid-performing mainstream PCIe 3.0 M.2 NVMe SSD that comes with Samsung-beating endurance ratings and a heatsink, all at a low price.
Pros
- +
+ Heatsink
- +
+ Low-cost
- +
+ Strong sustained write speeds
- +
+ SLC cache recovers quickly
- +
+ 5-year warranty and Samsung beating endurance
Cons
- -
Small SLC cache
Why you can trust Tom's Hardware
The Silicon Power’s XD80 comes armed with a Phison E12S SSD controller, BICS4 TLC, and a heatsink. This combo delivers solid, cool performance at an affordable price point, making the PCIe 3.0 x4 drive a good value for those looking to save a few bucks over premium drives.
The XD80 competes against other mainstream SSDs like the Crucial P5, WD_Black SN750, and Samsung’s 970 EVO Plus. In addition, the drive features a unique design for a Phison-based SSD — it's one of only a few slim PS5012-E12S-based designs with TLC flash that still retains a single-sided M.2 form factor, even for the 2TB model.
The XD80 also features a pre-installed thin aluminum heatsink that hardly adds to the XD80’s thickness, perhaps even making it suitable for some laptops. Based on our testing, the XD80 equipped with a heatsink fit into a relatively recent Dell ultrabook in our testing without clearance issues, which is an important consideration if you’re looking for a laptop drive.
Specifications
| Product | 256GB | 500GB | 1TB | 2TB |
|---|---|---|---|---|
| Pricing | $45.99 | $64.99 | $109.99 | $219.99 |
| Capacity (User / Raw) | 256GB / 256GB | 512GB / 512GB | 1024GB / 1024GB | 2048GB / 2048GB |
| Form Factor | M.2 2280 | M.2 2280 | M.2 2280 | M.2 2280 |
| Interface / Protocol | PCIe 3.0 x4 / NVMe 1.3 | PCIe 3.0 x4 / NVMe 1.3 | PCIe 3.0 x4 / NVMe 1.3 | PCIe 3.0 x4 / NVMe 1.3 |
| Controller | Phison PS5012-E12S | Phison PS5012-E12S | Phison PS5012-E12S | Phison PS5012-E12S |
| DRAM | DDR3L | DDR3L | DDR3L | DDR3L |
| Memory | BiCS4 96L TLC | BiCS4 96L TLC | BiCS4 96L TLC | BiCS4 96L TLC |
| Sequential Read | 3,100 MBps | 3,400 MBps | 3,400 MBps | 3,400 MBps |
| Sequential Write | 1,100 MBps | 2,300 MBps | 3,000 MBps | 3,000 MBps |
| Random Read | 180,000 IOPS | 290,000 IOPS | 390,000 IOPS | 500,000 IOPS |
| Random Write | 240,000 IOPS | 510,000 IOPS | 450,000 IOPS | 600,000 IOPS |
| Security | N/A | N/A | N/A | N/A |
| Endurance (TBW) | 200 TB | 400 TB | 800 TB | 1,600 TB |
| Part Number | SP256GBP34XD8005 | SP512GBP34XD8005 | SP001TBP34XD8005 | SP002TBP34XD8005 |
| Warranty | 5-Years | 5-Years | 5-Years | 5-Years |
The Silicon Power XD80 is available in capacities of 256, 512GB, 1TB, and 2TB, each priced aggressively low at roughly $0.11 to $0.13-per-GB. The company rates the XD80 for up to 3.4/3.0 GBps of sequential read/write throughput and upwards of 500,000/600,000 random read/write IOPS over its PCIe 3.0 x4 interface. It has a 52GB SLC cache, though, so real-world sustained write performance will be slower than the spec if you write more than 52GB as one operation. We’ll show what that looks like on the following page.
The XD80 comes backed by high endurance ratings within its five-year warranty and should be suitable for heavy content creation. The 2TB model can endure 1,600 TB of written data within its warranty period (400TB higher than the Samsung 980 Pro). Moreover, it serves up this impressive endurance with less factory overprovisioning than competing drives, at roughly 7.4% vs 10%, giving you a bit more usable storage capacity than other SSDs.
Software and Accessories
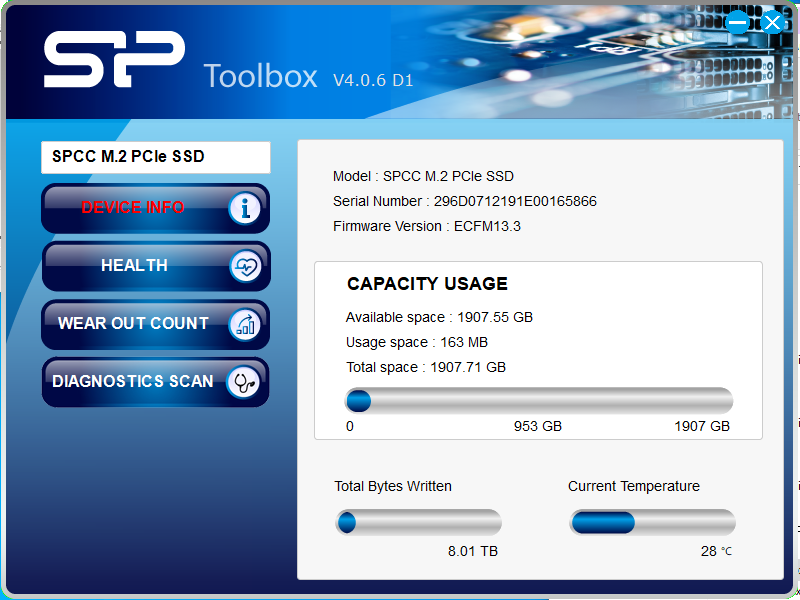
Silicon Power provides a very basic SSD Toolbox. With it, you can monitor the capacity used, the total bytes written to the drive, and temperature as reported by the SSD’s S.M.A.R.T. data. It also has a built-in diagnostic scanner.
A Closer Look
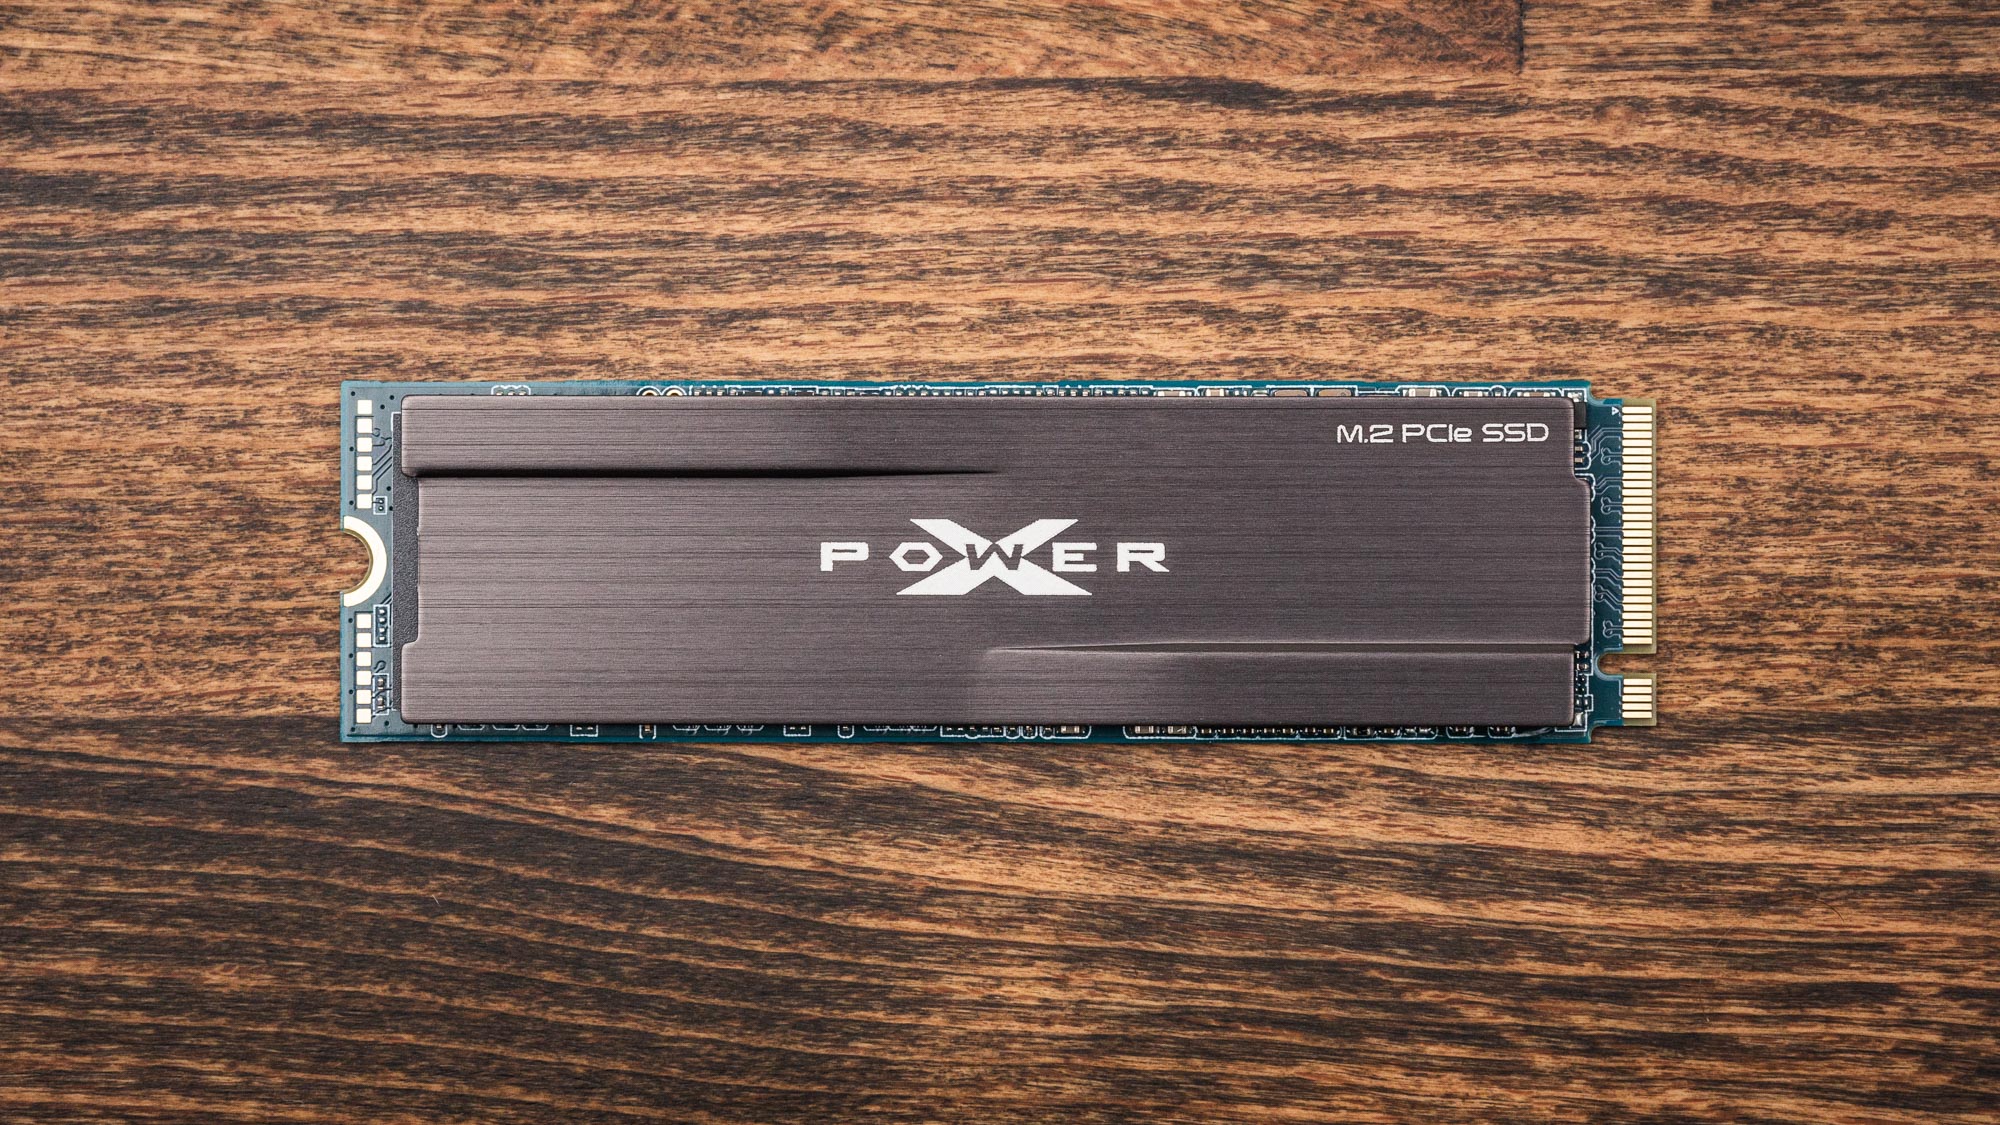
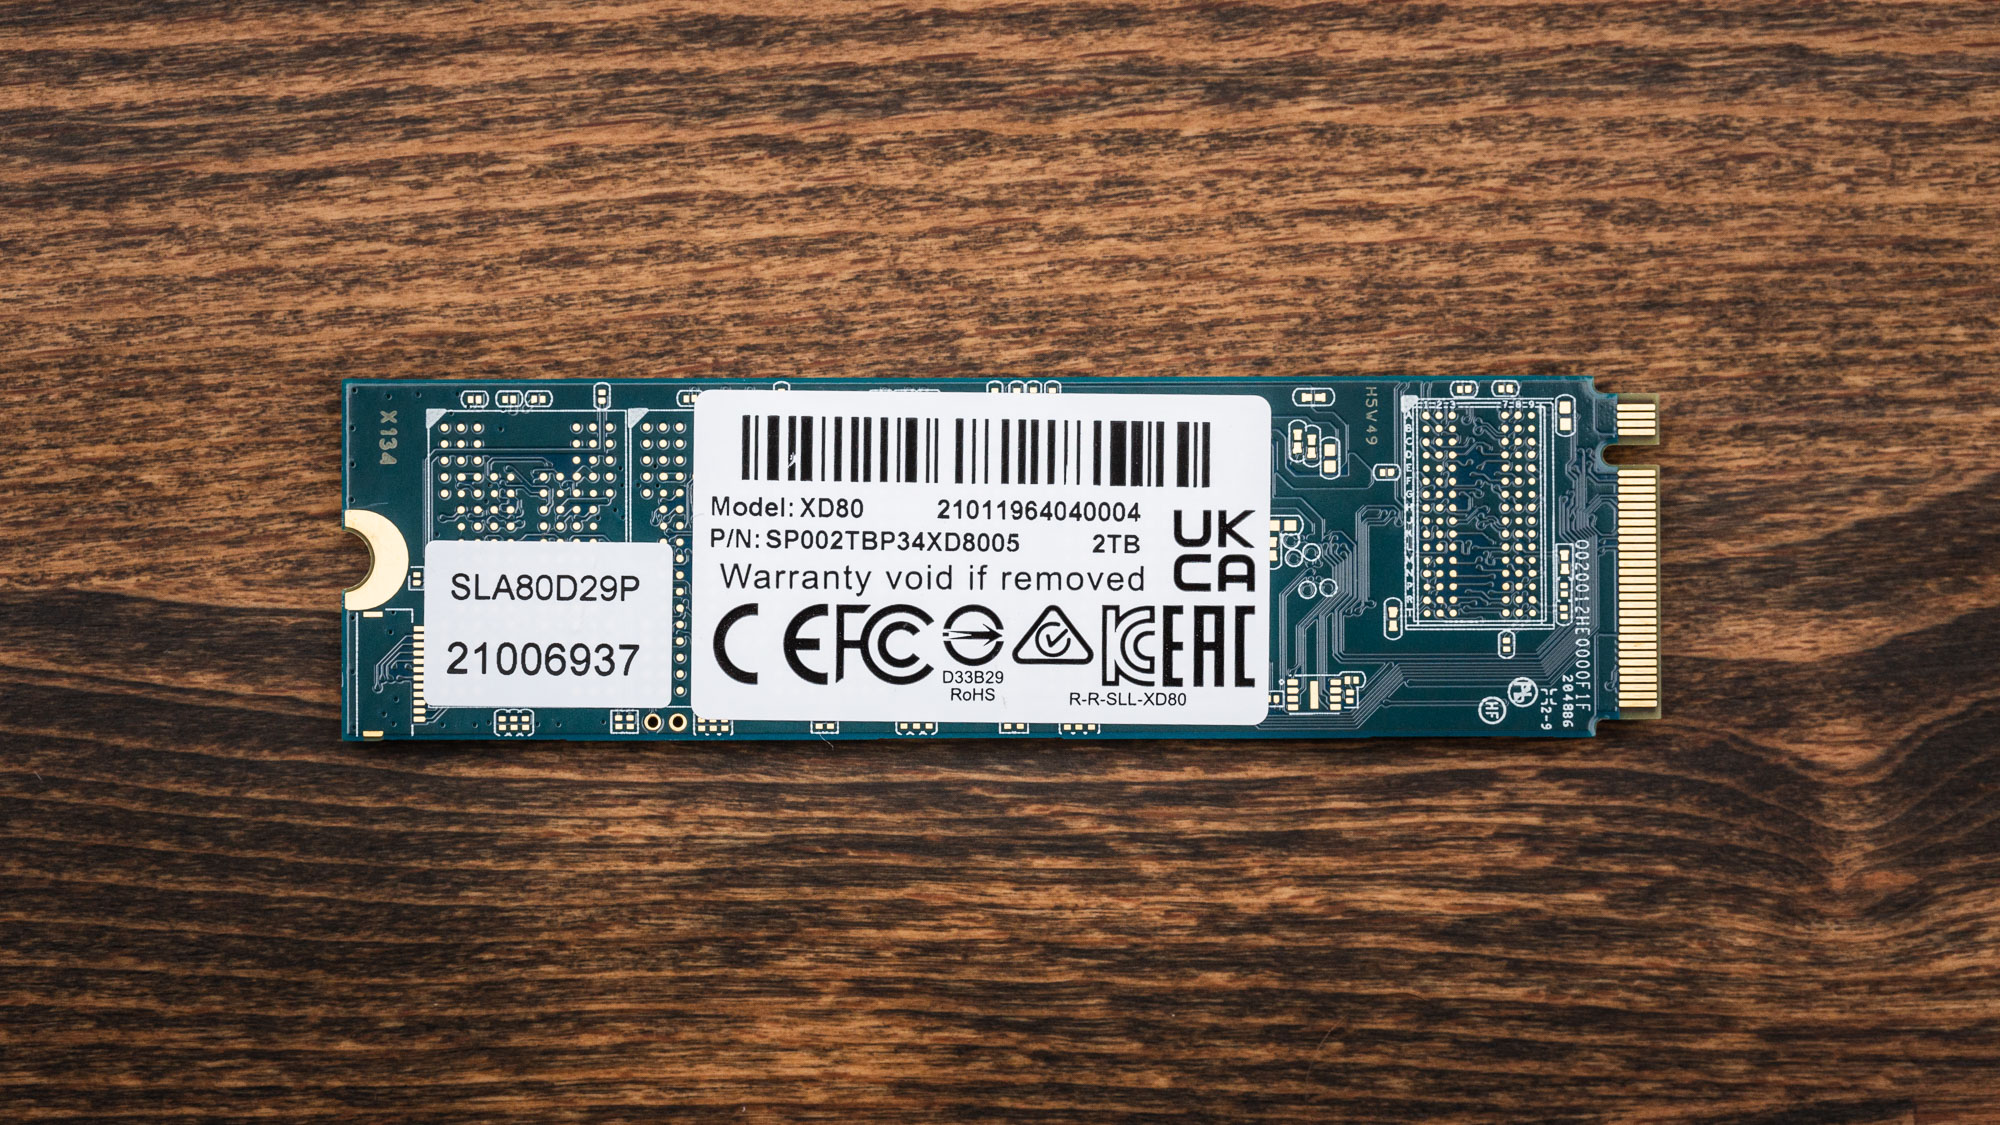
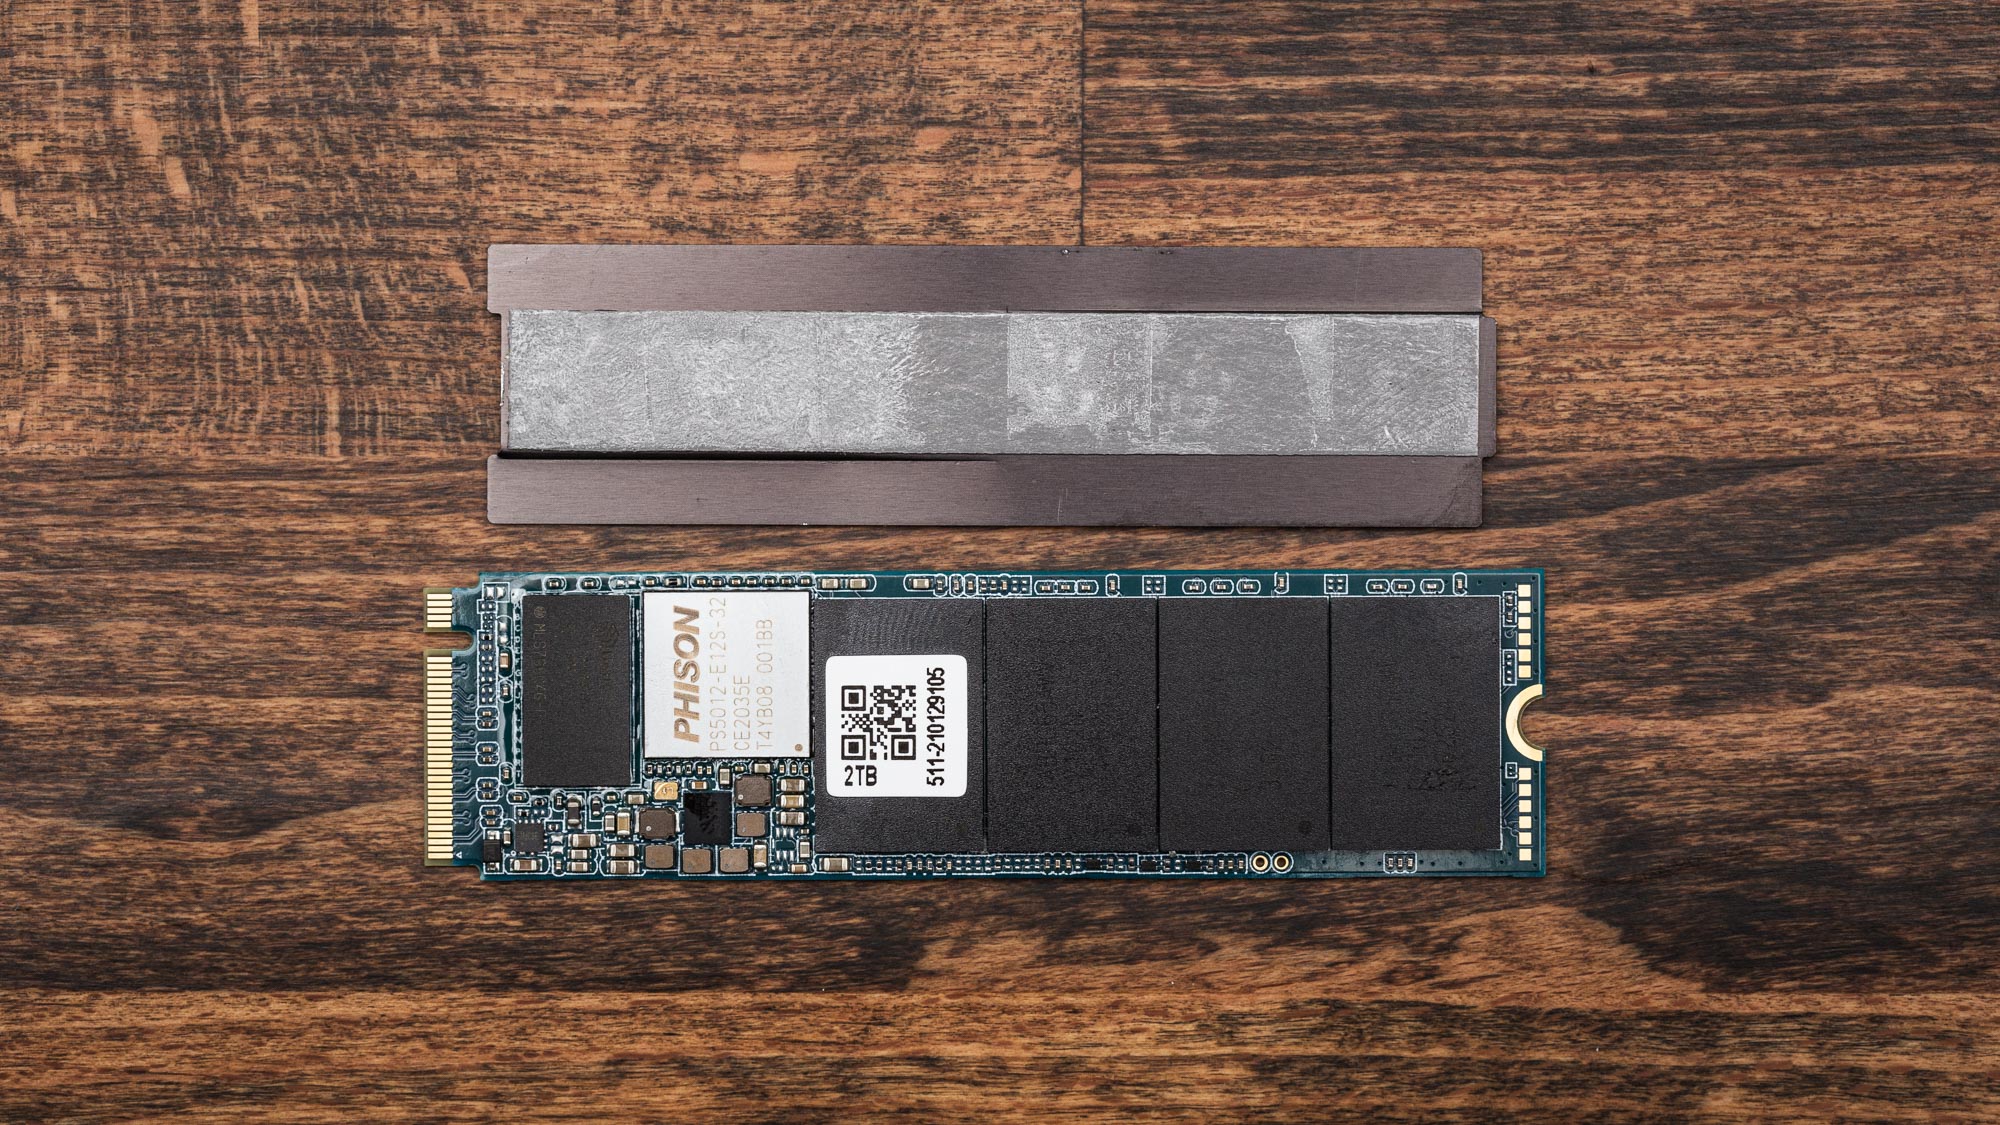
As mentioned, the XD80 comes in an M.2 2280 single-sided form factor – even at the 2TB capacity. It features a grey-colored, pre-applied aluminum heatsink. Silicon Power claims the heatsink reduces temperatures by up to 20%. The XD80 also supports low-power ASPM and ASPT for cooler, more efficient operation.
Get Tom's Hardware's best news and in-depth reviews, straight to your inbox.
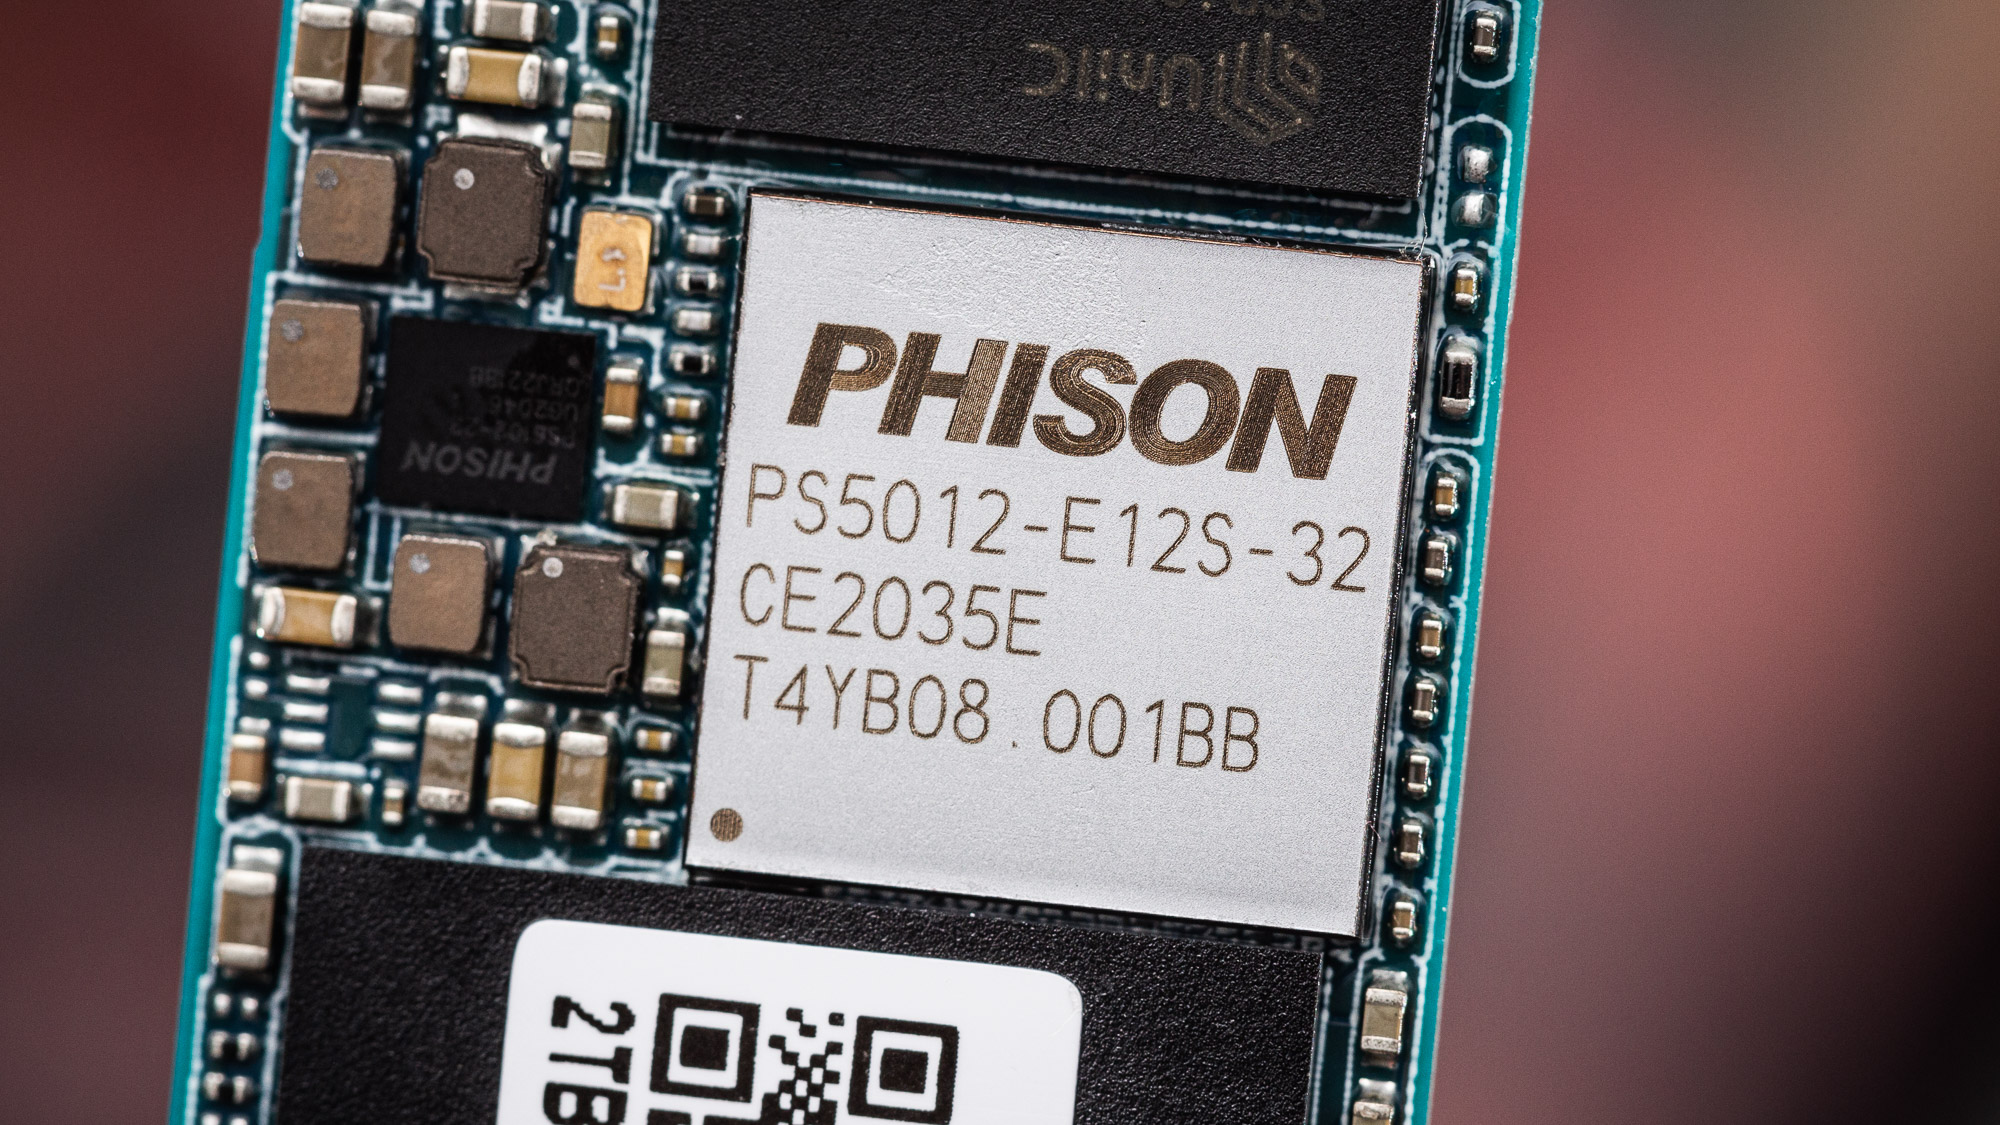
Phison’s PS5012-E12S PCIe 3.0 x4 NVMe SSD controller is a quad-core, NVMe 1.3-compliant design that leverages two Arm Cortex R5 CPUs clocked at 666 MHz alongside lower-clocked dual co-processors. Phison’s third-generation Low-Density Parity-Check (LDPC) ECC, a RAID engine, and end-to-end data path protection ensures reliability and consistency. The drive supports S.M.A.R.T. data reporting and Trim, but it doesn’t support AES 256-bit hardware encryption.
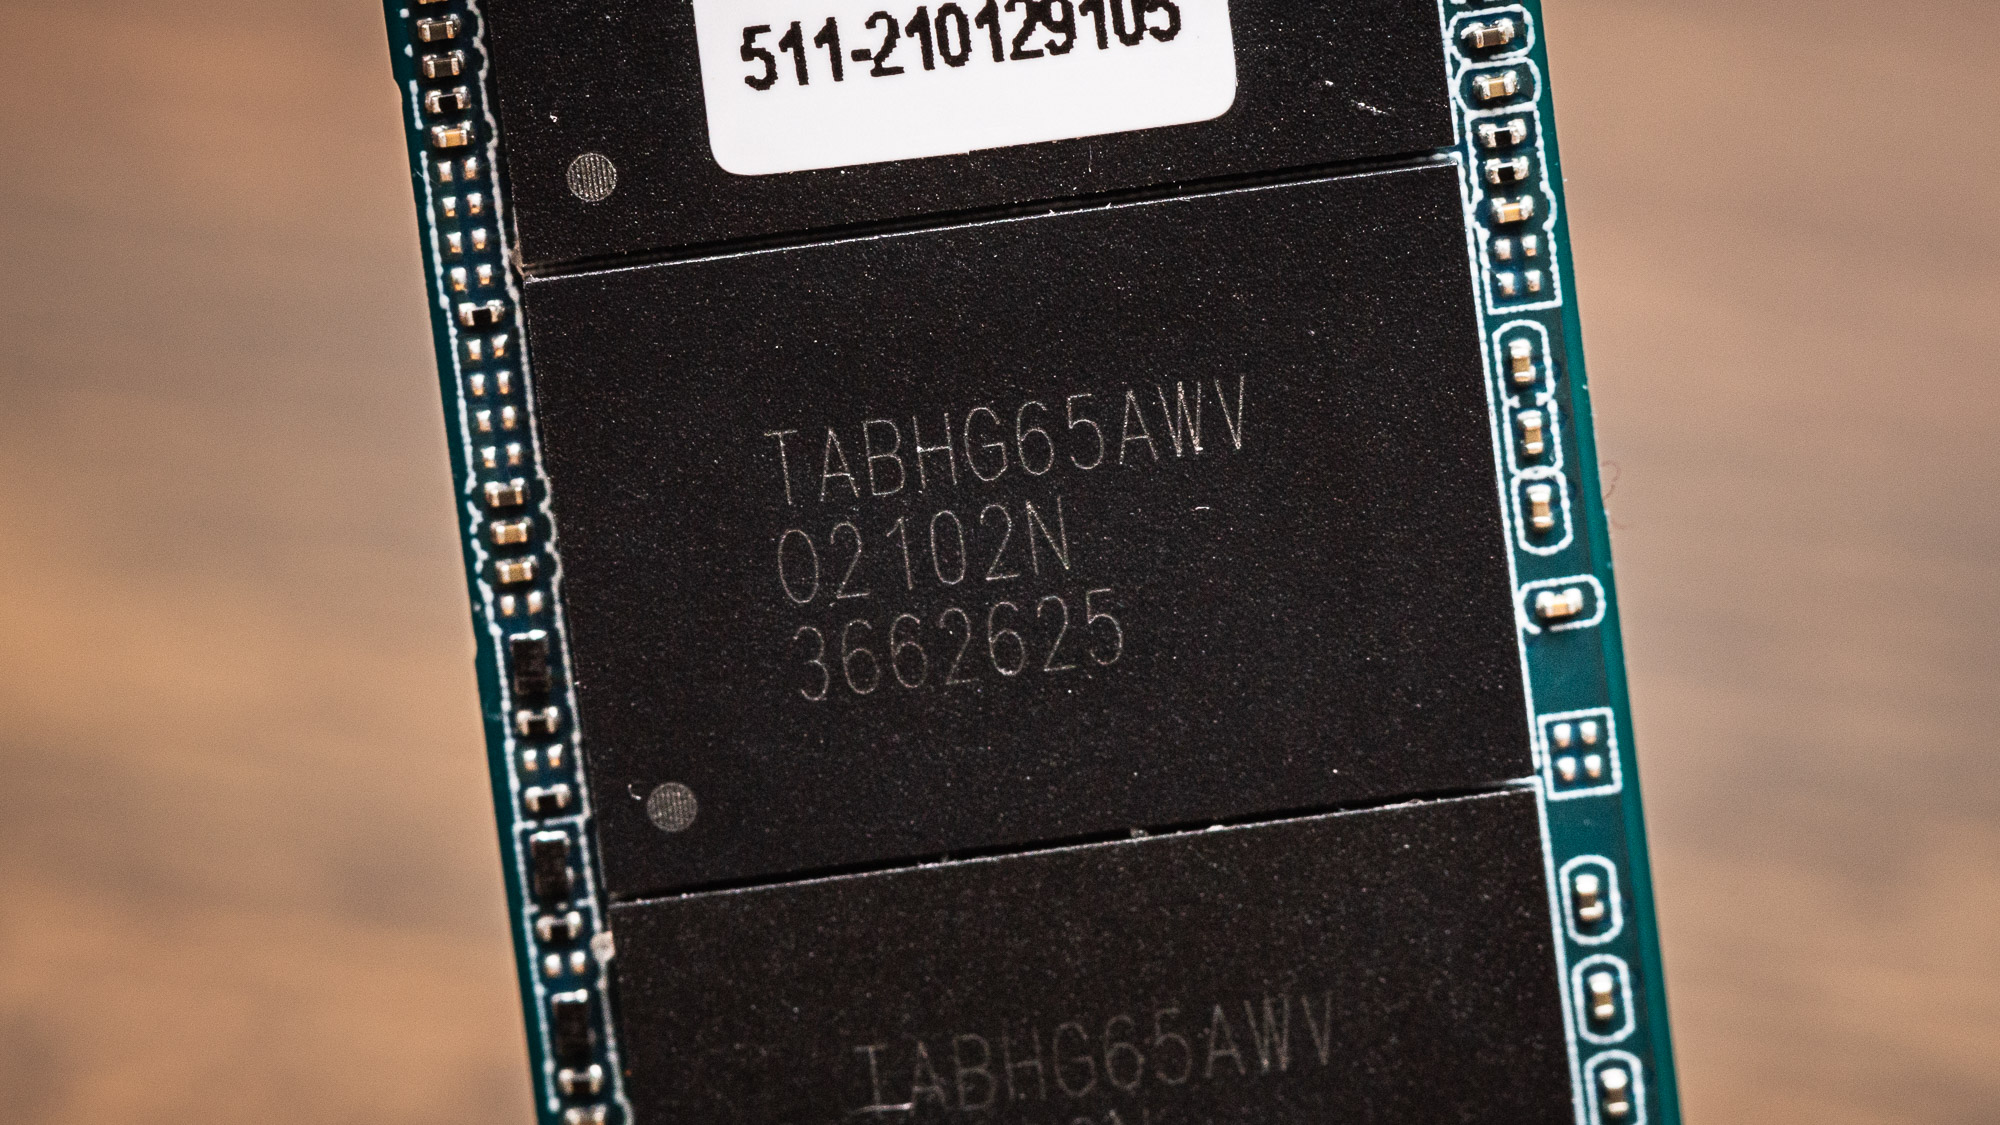
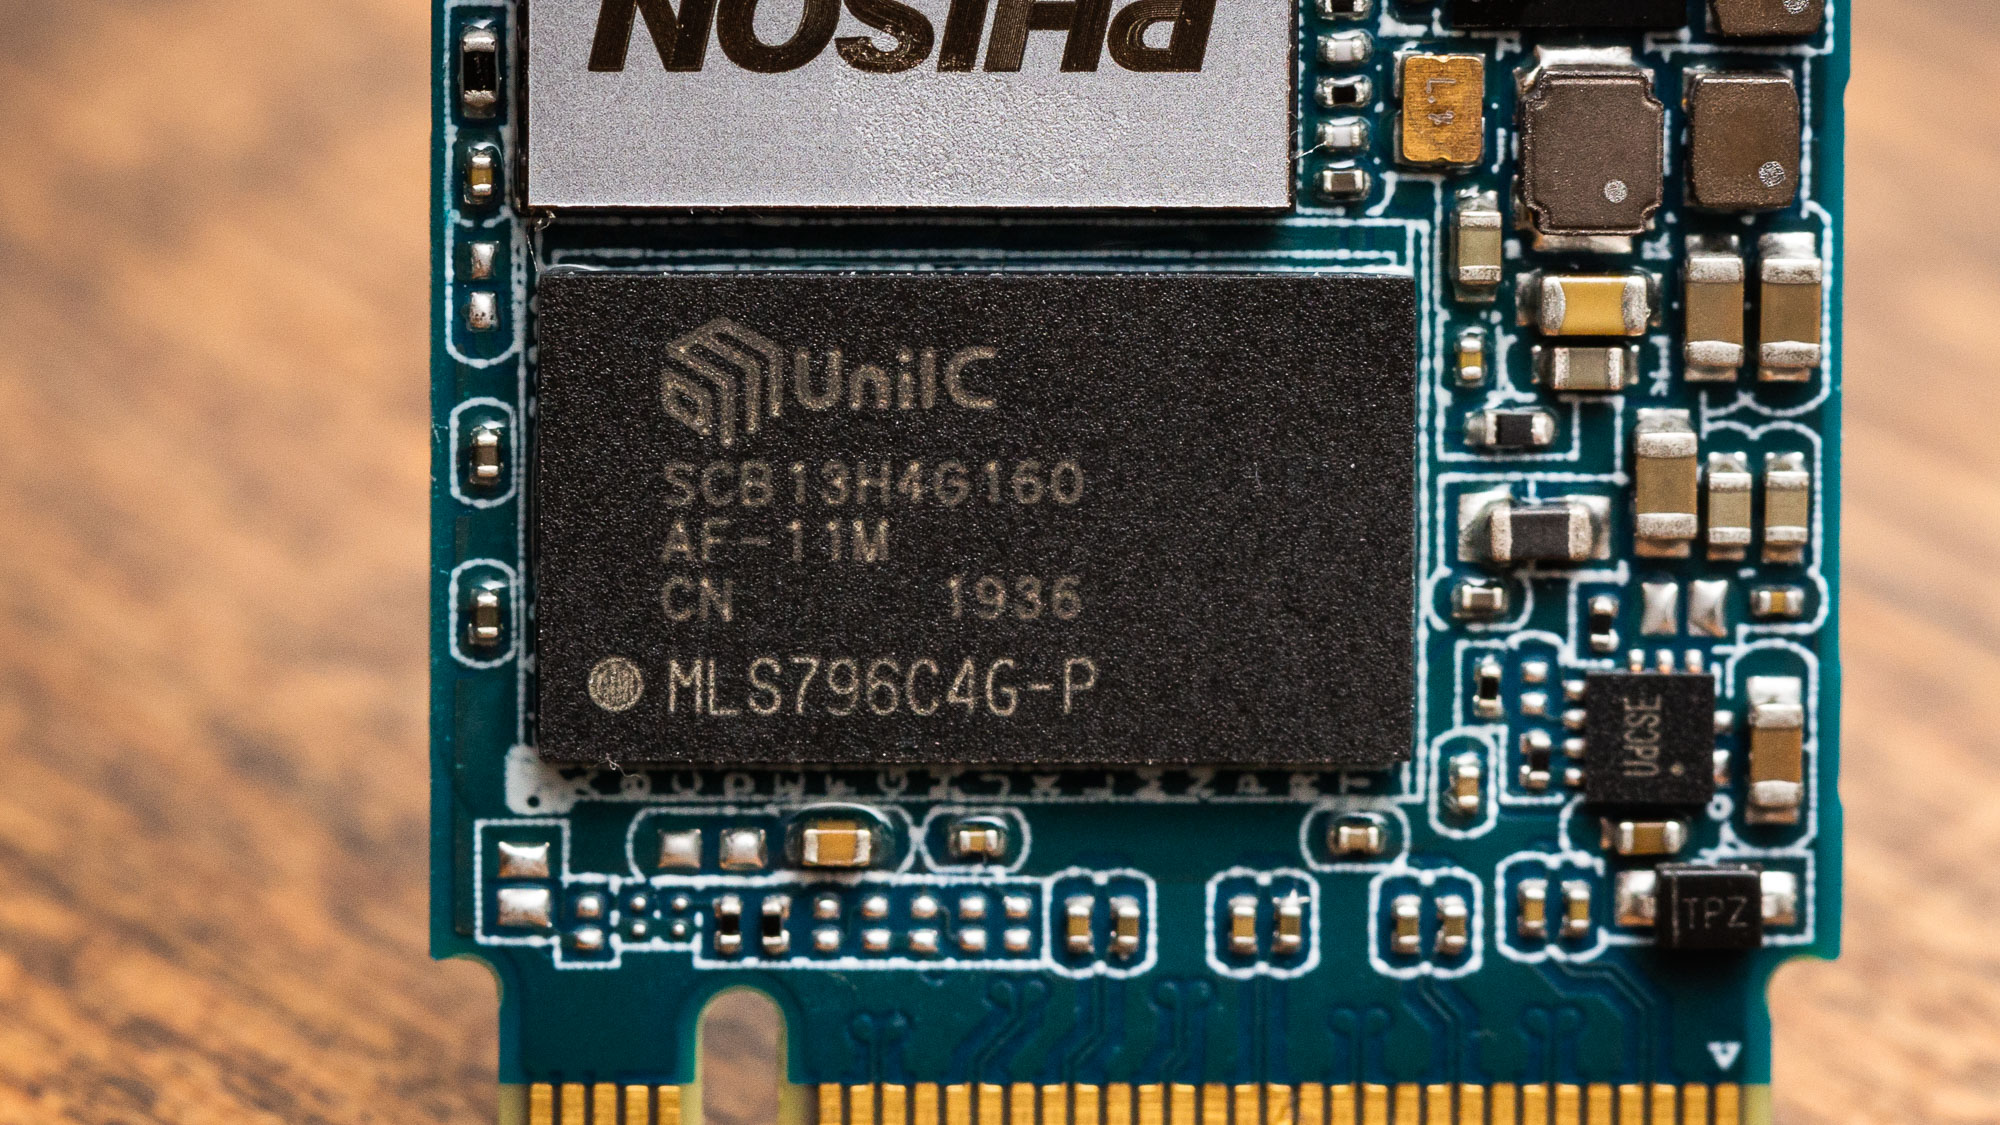
The controller has DRAM for buffering the FTL mapping tables, interfacing with 4Gb of DDR3L from Xi'an UniIC Semiconductors for the task. The controller also interfaces with Kioxia’s BiCS4 96L TLC flash. Our 2TB XD80 packs thirty-two 512Gb dies that are spread among four NAND packages. This flash operates at 533 MTps and has a dual-plane design.
MORE: Best SSDs
MORE: How We Test HDDs And SSDs
MORE: All SSD Content
- 1
- 2
Current page: Features and Specifications
Next Page Silicon Power 2TB Performance Results and Conclusion
Sean is a Contributing Editor at Tom’s Hardware US, covering storage hardware.
-
Alvar "Miles" Udell Would have been nice to see the PNY CS2130 2TB on the charts as well, as it's a 2TB drive right now on sale for $200 ($20 less than the SP XD80), and TH did an article on it last year but never did a followup.Reply
PNY Technologies CS2130 2TB M.2 NVMe SSD M280CS2130-2TB-RB B&H (bhphotovideo.com)
PNY CS2310: Use That Empty NVMe Slot | Tom's Hardware (tomshardware.com) -
froggx On these disk reviews, why is it that the line graphs for the iometer sustained sequential write, gigabytes written don't use properly spaced values along the X-axis? By this I mean the intervals are labeled "0, 0.5, 1, 2, 5,10, 15 (minutes)" yet spaced in such a way to indicate that the amount of time between 1 and 2 minutes and the amount of time between 2 and 5 minutes is the same (which it isn't). Last time I did math the median value of the numbers 0 through 15 wasn't 2, nor does the median value of 0-2 minutes work out to 45 second.Reply
When graphed with equally spaced X values (based on the values at 1, 2, 5, 10 and 15 minutes as provided on the bar graph for this test), most of the drives write at a linear rate within 2 minutes of starting the test (because the SLC cache has run out by then). However, when I look at the 15 minute graph, it looks like the drives start the test slowly, then around the halfway point they all (metaphorically) rail a line of blow and the amount of data written skyrockets (not how drives out of SLC cache work). The graph for 2 minutes isn't all that much better.
I've added the links to the 2 problematic graph images here for convenience:
Graph Linky and another Graph Linky. -
seanwebster Replyfroggx said:On these disk reviews, why is it that the line graphs for the iometer sustained sequential write, gigabytes written don't use properly spaced values along the X-axis? By this I mean the intervals are labeled "0, 0.5, 1, 2, 5,10, 15 (minutes)" yet spaced in such a way to indicate that the amount of time between 1 and 2 minutes and the amount of time between 2 and 5 minutes is the same (which it isn't). Last time I did math the median value of the numbers 0 through 15 wasn't 2, nor does the median value of 0-2 minutes work out to 45 second.
When graphed with equally spaced X values (based on the values at 1, 2, 5, 10 and 15 minutes as provided on the bar graph for this test), most of the drives write at a linear rate within 2 minutes of starting the test (because the SLC cache has run out by then). However, when I look at the 15 minute graph, it looks like the drives start the test slowly, then around the halfway point they all (metaphorically) rail a line of blow and the amount of data written skyrockets (not how drives out of SLC cache work). The graph for 2 minutes isn't all that much better.
I've added the links to the 2 problematic graph images here for convenience:
Graph Linky and another Graph Linky.
I mainly used the gigabytes written data for the bar graph and throw that same data in for line graph to have another way to look at the data. The second is just a crop/zoomed-in view of the same to see the differences in cache a little easier since these are small charts. I went ahead and did some adjustments for you based on your feedback. Personally, I prefer looking at the data how I've been publishing it since it enhances the tail whip effect and SLC cache size differences, which I can more quickly differentiate, but can start throwing in this new graph instead if you prefer it.
Do you prefer the charts on the left? I appreciate the feedback. If you have any more, let me know. Thanks.
92 -
Co BIY Replyseanwebster said:I mainly used the gigabytes written data for the bar graph and throw that same data in for line graph to have another way to look at the data. The second is just a crop/zoomed-in view of the same to see the differences in cache a little easier since these are small charts. I went ahead and did some adjustments for you based on your feedback. Personally, I prefer looking at the data how I've been publishing it since it enhances the tail whip effect and SLC cache size differences, which I can more quickly differentiate, but can start throwing in this new graph instead if you prefer it.
Do you prefer the charts on the left? I appreciate the feedback. If you have any more, let me know. Thanks.
92
I 'd vote for charts on the left. It's a better presentation of the information. -
Sleepy_Hollowed Wow, this is a true steal, and absolutely all you need for PC gaming.Reply
If I didn’t use my machine for IO intensive stuff I’d buy two of these puppies, and even then I’m considering them anyways.
power-wise I’d need to test it a bit more on Linux to see if laptops would do well with it, but holy moly. -
MechGalaxy Does anyone have the idle power usage of these or can someone explain why the samsung 970 evo and intel 660p are so low?Reply
The review says just under half a watt. That seems abnormally high. It doesn't make sense given the temps and efficiencies compared to the samsung.
In contrast the (samsung 970 evo pro) uses 30 - 72mW with ASPM on or off according to the review here Samsung 970 evo Plus. -
seanwebster Reply
For lower power consumption figures ASPM needs to be enabled in the UEFI. Not all systems support toggling this in the UEFI. Therefore, we test power consumption with ASPM disabled on our latest test benches.MechGalaxy said:Does anyone have the idle power usage of these or can someone explain why the samsung 970 evo and intel 660p are so low?
The review says just under half a watt. That seems abnormally high. It doesn't make sense given the temps and efficiencies compared to the samsung.
In contrast the (samsung 970 evo pro) uses 30 - 72mW with ASPM on or off according to the review here Samsung 970 evo Plus.
Additionally, the lowest desktop idle idle state data, while important, isn’t as important as laptop idle state data. That, however takes more effort to attain and is something outside the scope of a normal review.
