Why you can trust Tom's Hardware
Comparison Products
We put the Silicon Power XD80 up against some of the Best SSDs on the market, including the Samsung 970 EVO Plus, Team Group T-Create Expert, Crucial P5, Intel SSD 670p, and WD_Black SN750. We also threw in some PCIe 4.0 competitors, including the Samsung 980 Pro and Mushkin Gamma, for good measure.
Game Scene Loading - Final Fantasy XIV
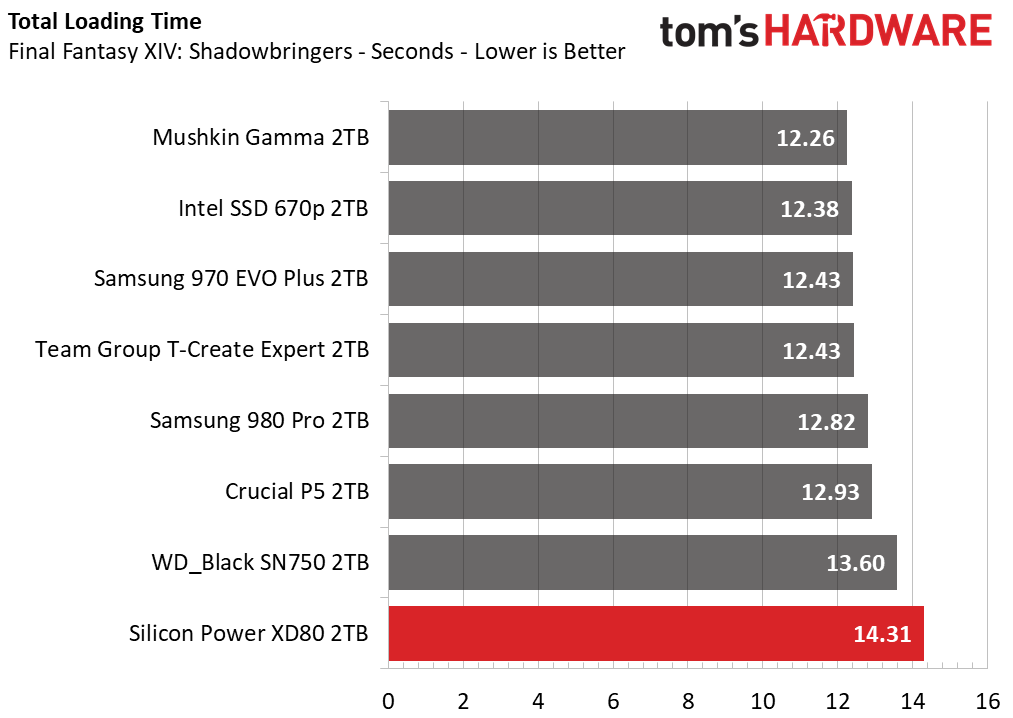
Final Fantasy XIV Shadowbringers is a free real-world game benchmark that easily and accurately compares game load times without the inaccuracy of using a stopwatch.
The WD_Black SN750 and Crucial P5 are among the slowest in this test, but the Silicon Power XD80 was even slower as it lagged the group by 1-2 seconds overall.
Transfer Rates – DiskBench
We use the DiskBench storage benchmarking tool to test file transfer performance with a custom dataset. We copy a 50GB dataset including 31,227 files of various types, like pictures, PDFs, and videos to a new folder and then follow-up with a reading test of a newly-written 6.5GB zip file.
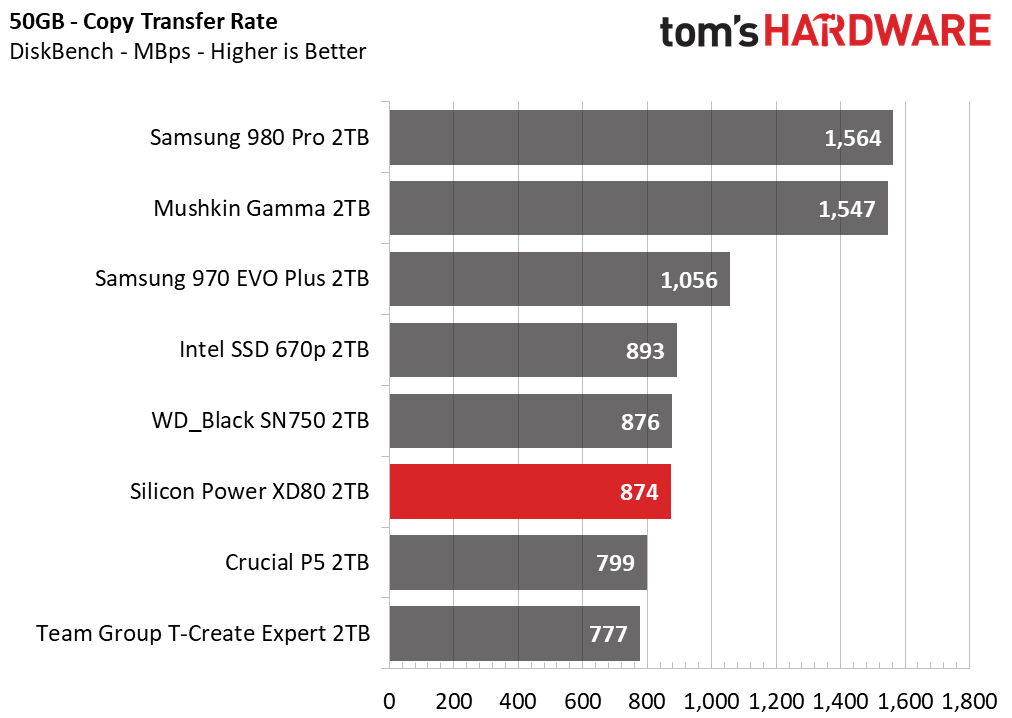
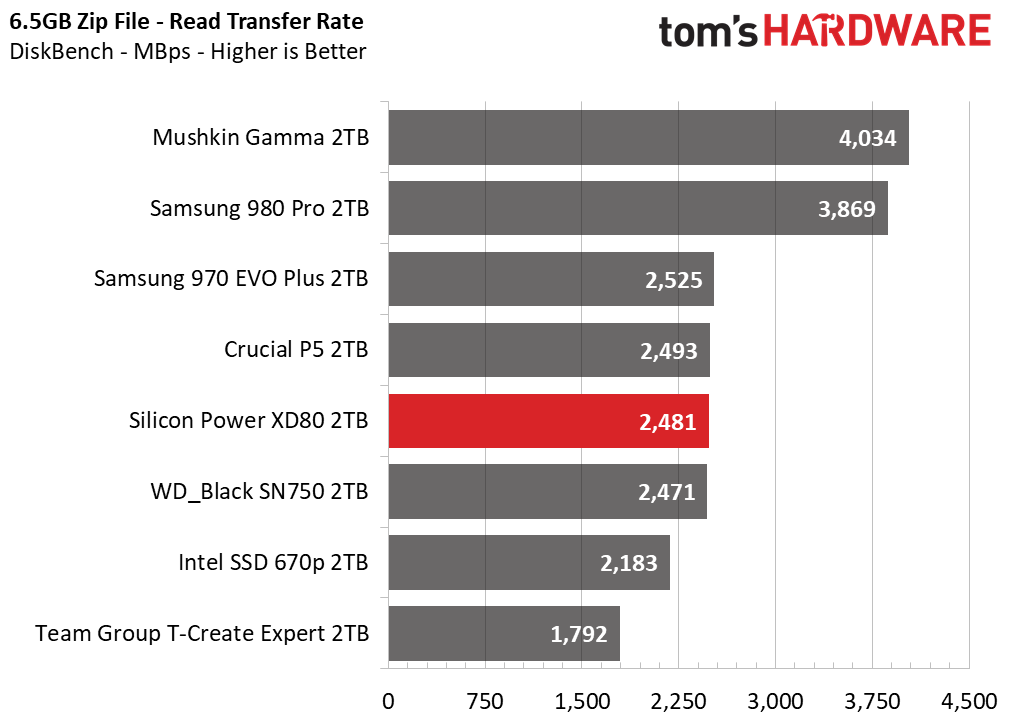
The XD80 did well transferring around large files. It wasn’t as fast as Samsung’s 970 EVO Plus or the Gen4 SSDs, but it traded blows with the WD_Black SN750 and Crucial P5, making it plenty fast in its own right.
Trace Testing – PCMark 10 Storage Test
PCMark 10 is a trace-based benchmark that uses a wide-ranging set of real-world traces from popular applications and everyday tasks to measure the performance of storage devices. The quick benchmark is more relatable to those who use their PCs for leisure or basic office work, while the full benchmark relates more to power users.
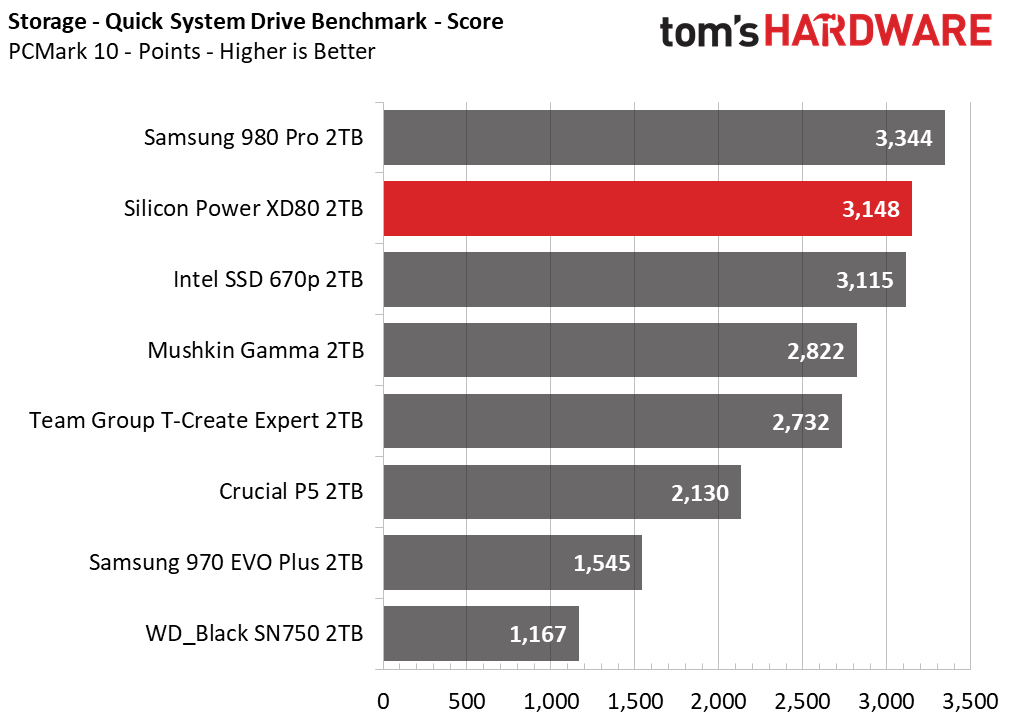
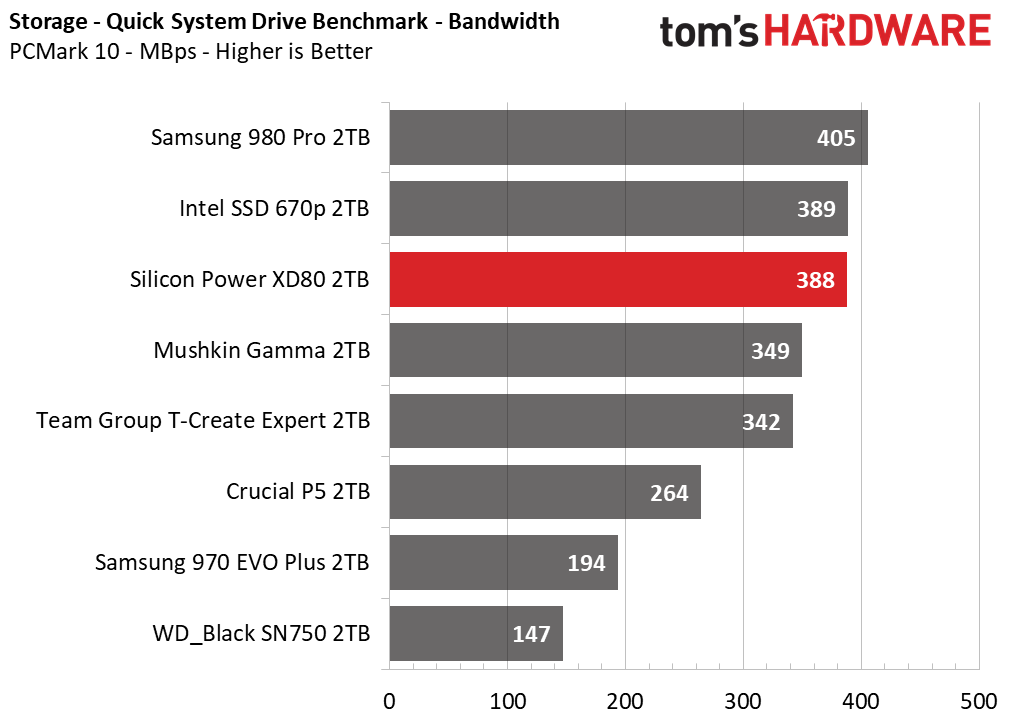
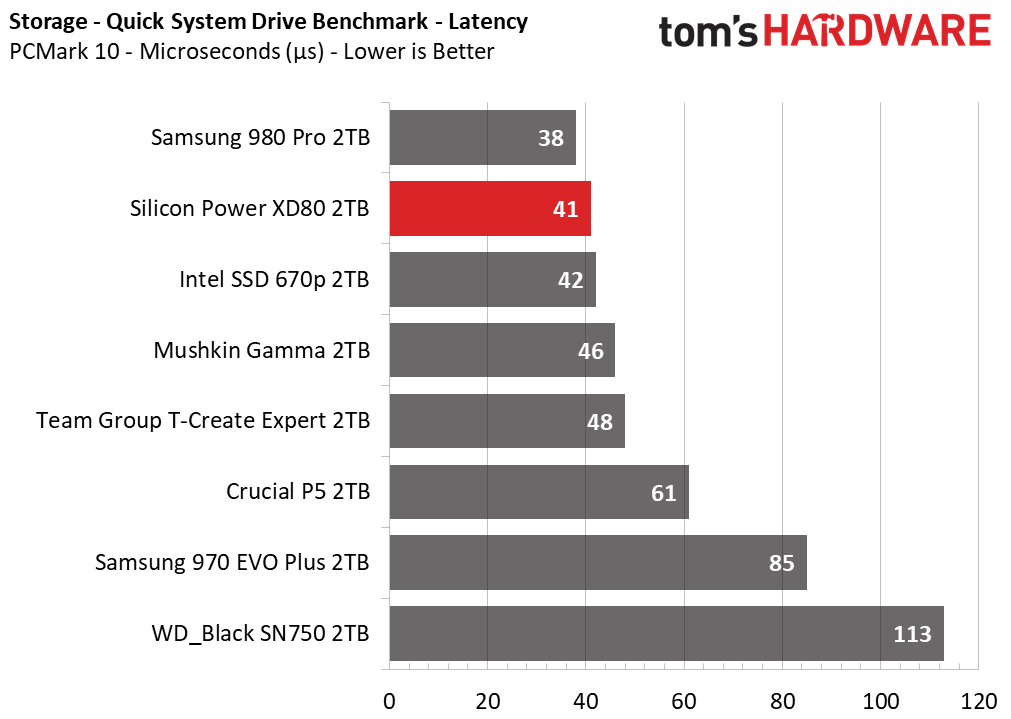
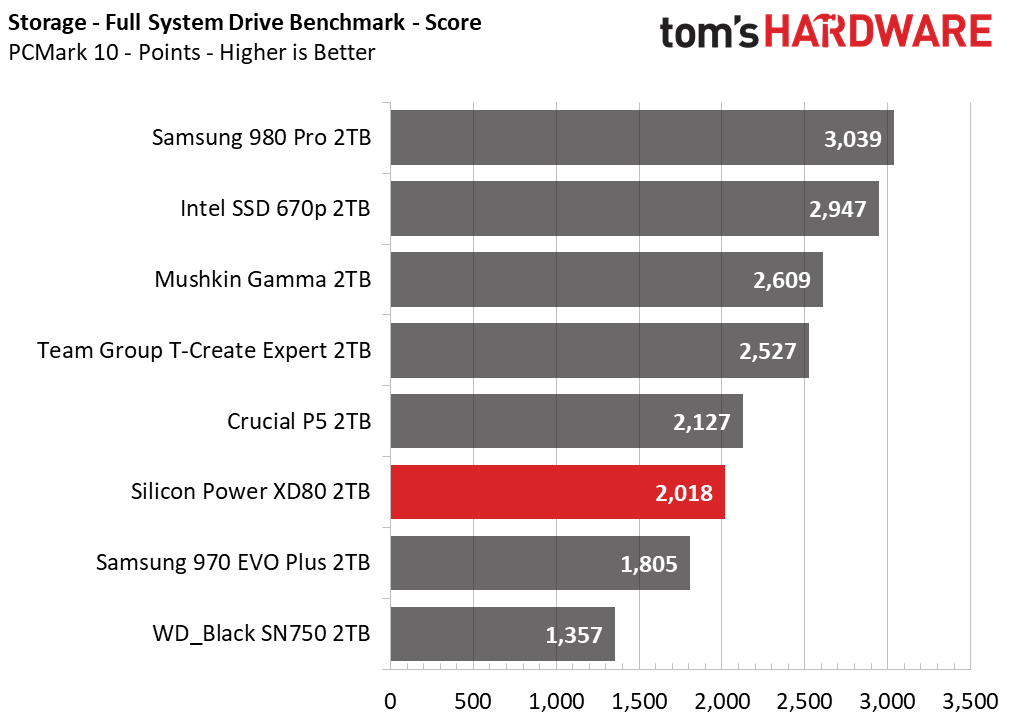
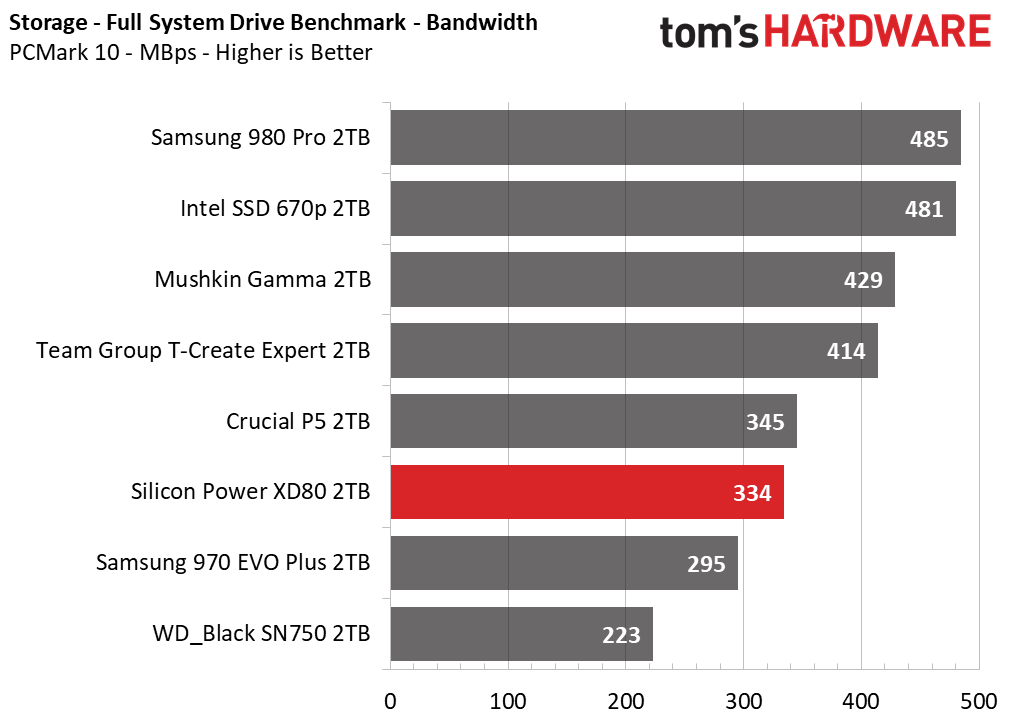
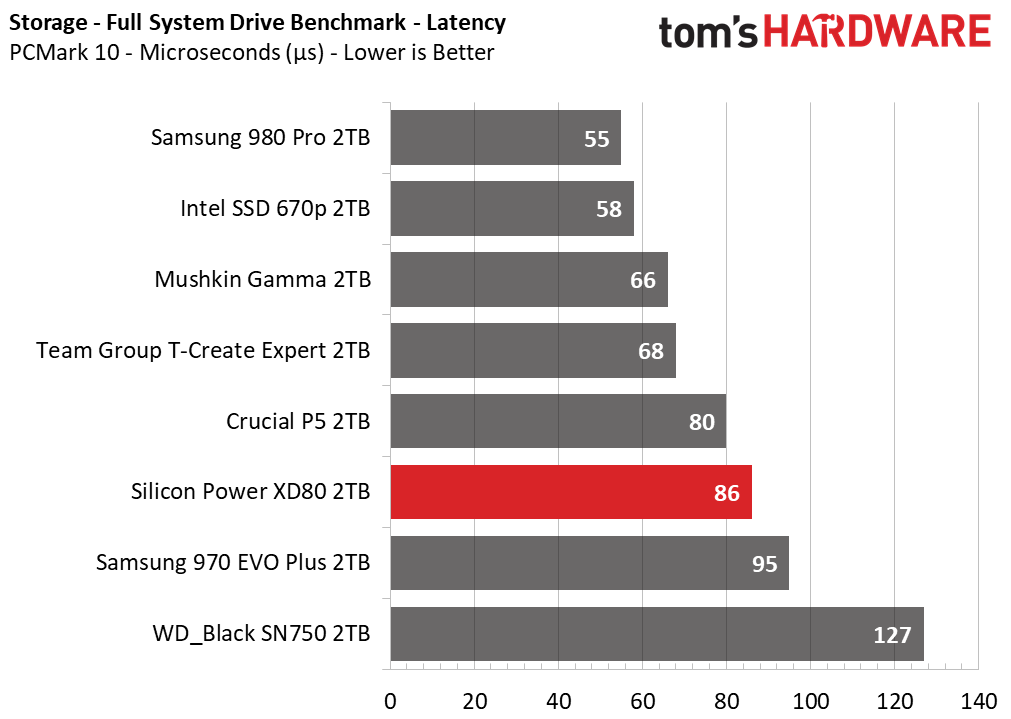
The XD80 did well in the Quick System Drive benchmark, scoring second place and edging out ahead of the QLC-powered Intel SSD 670p while landing just below the Samsung 980 Pro. However, the XD80 quickly fell to third from the last place in the Full System Drive benchmark. Although outpaced both the Samsung 970 EVO Plus and WD_Black SN750, the XD80 couldn’t keep up with Crucial’s P5 or Intel’s SSD 670p when the workloads became more intense.
Get Tom's Hardware's best news and in-depth reviews, straight to your inbox.
Synthetic Testing - ATTO / CrystalDiskMark
ATTO and CrystalDiskMark (CDM) are free and easy-to-use storage benchmarking tools that SSD vendors commonly use to assign performance specifications to their products. Both of these tools give us insight into how each device handles different file sizes.
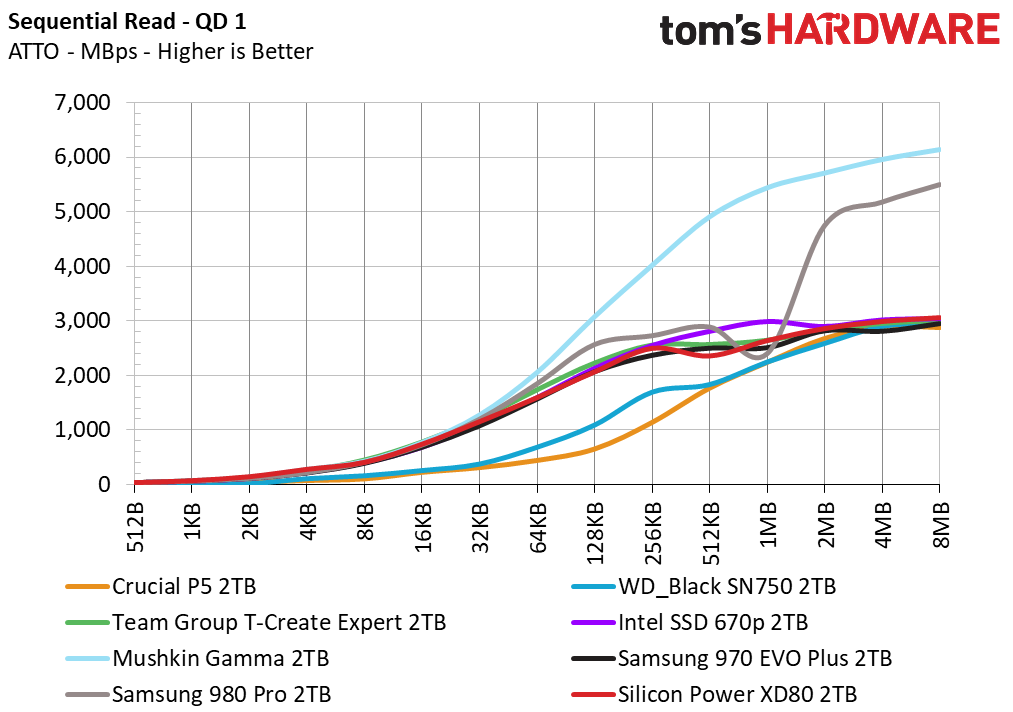
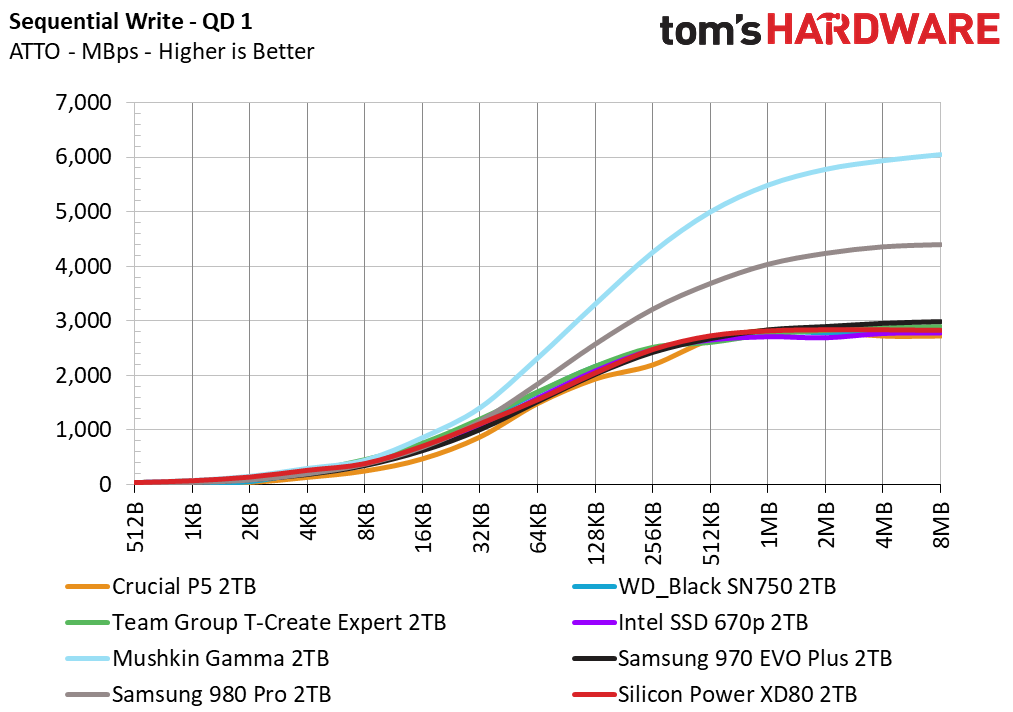
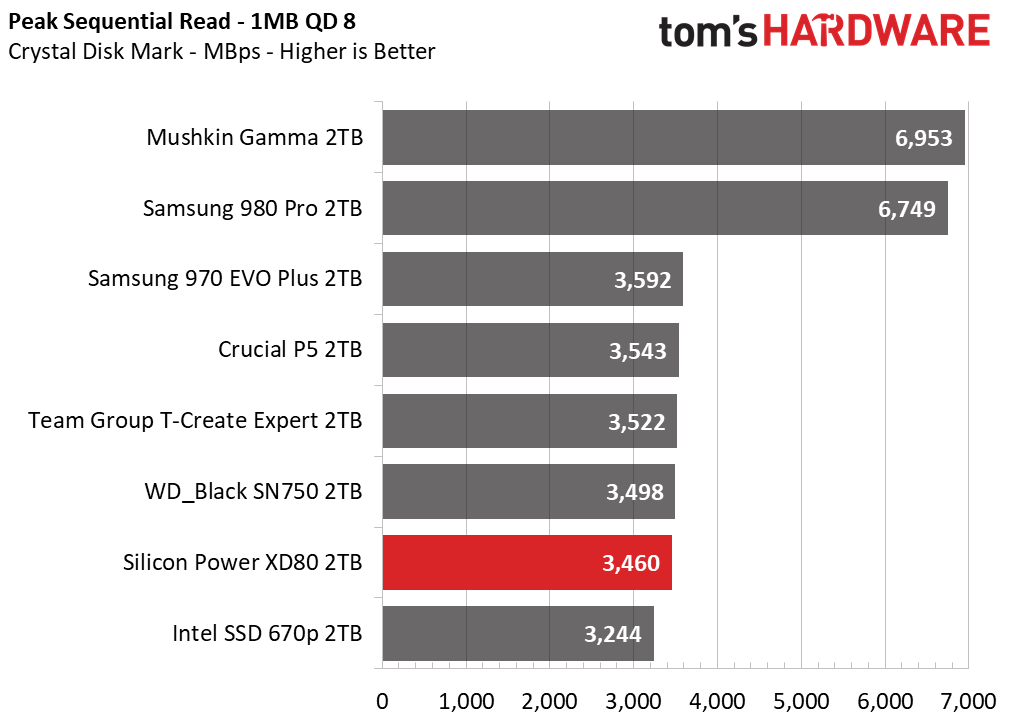
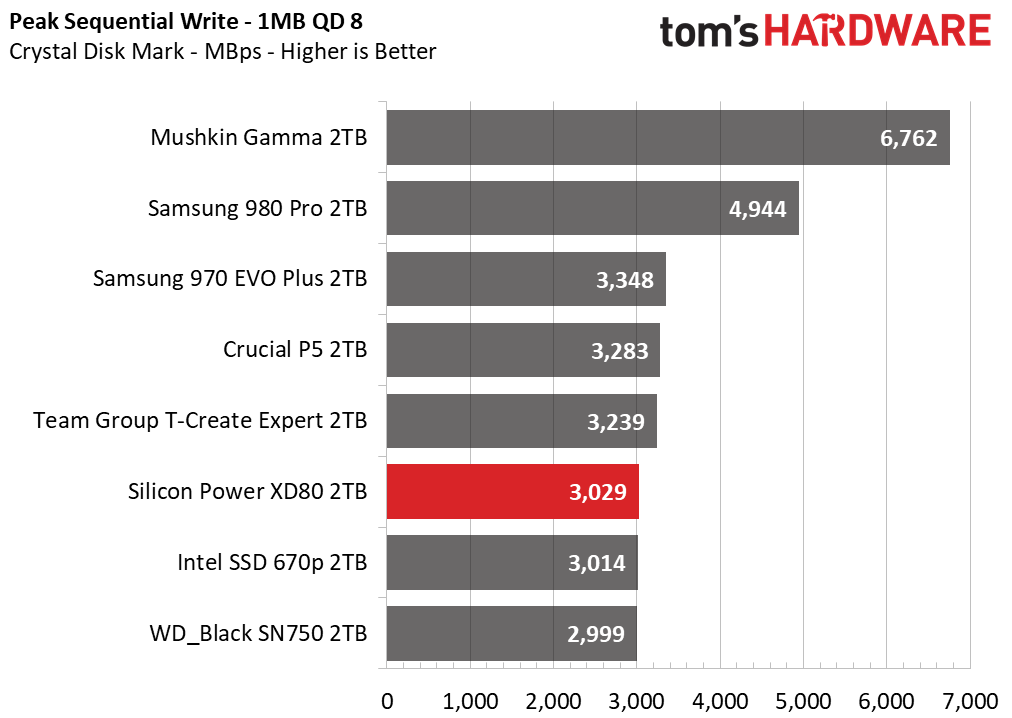
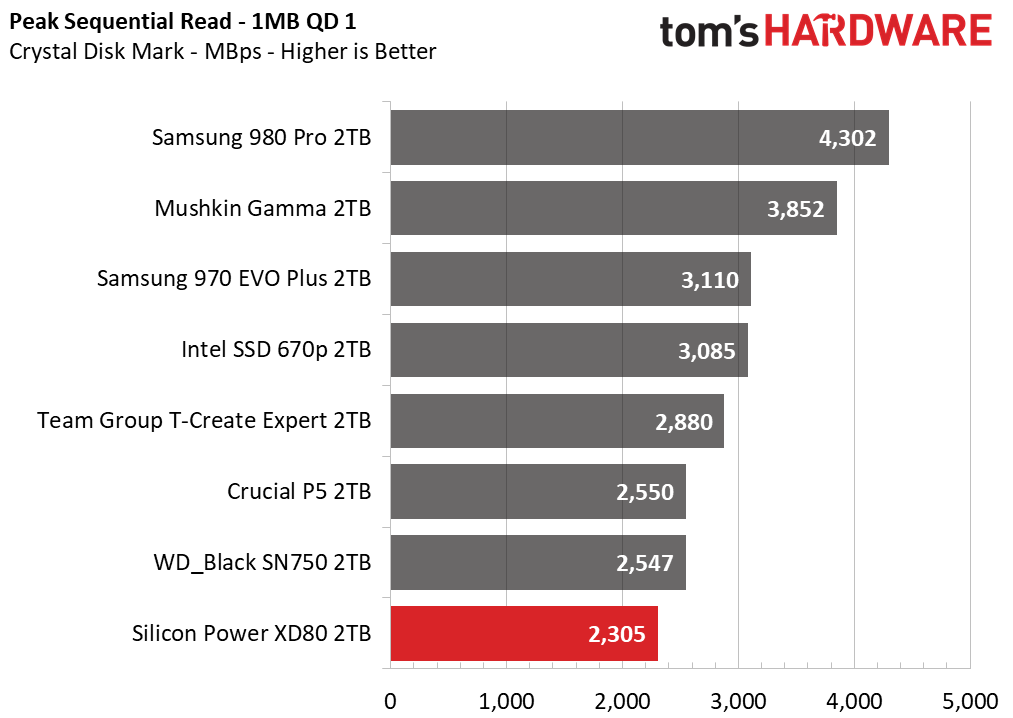
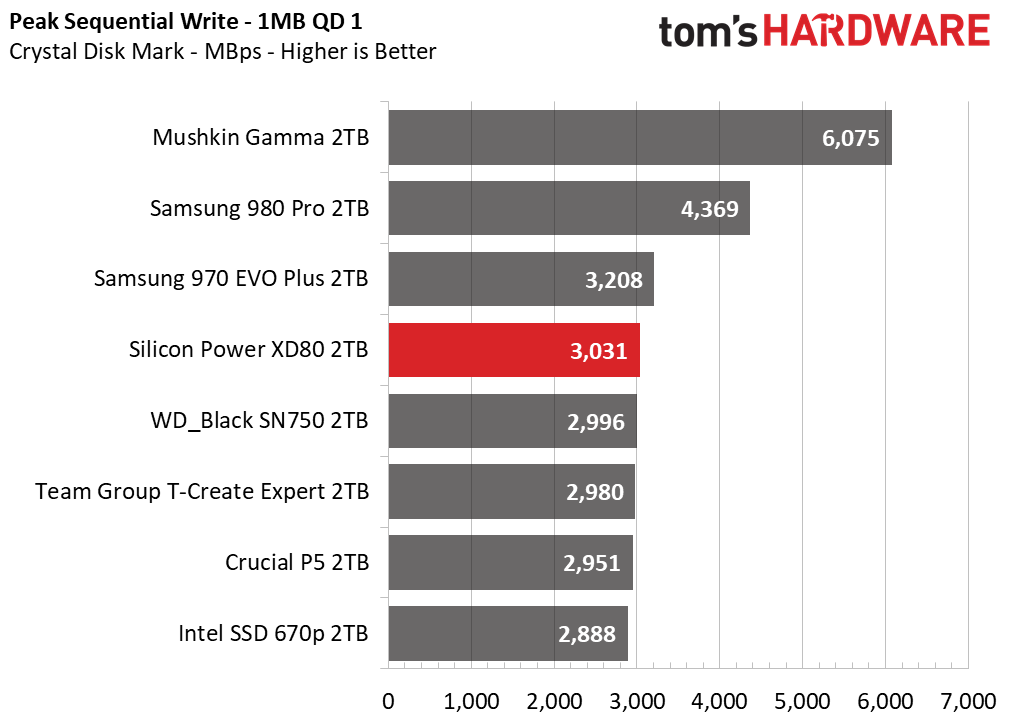
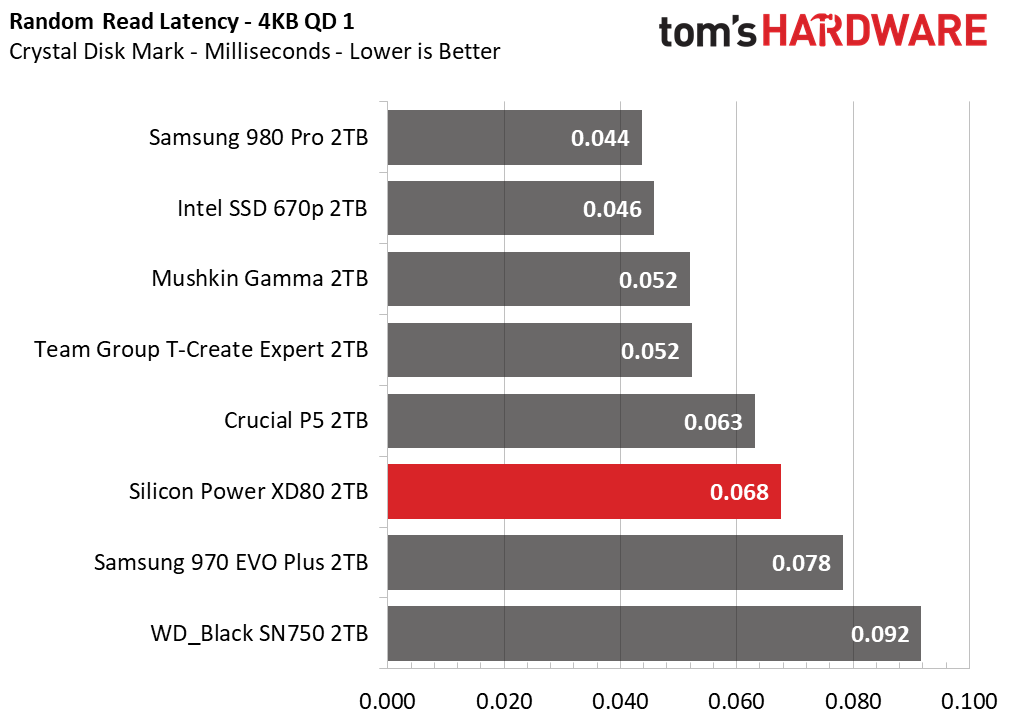
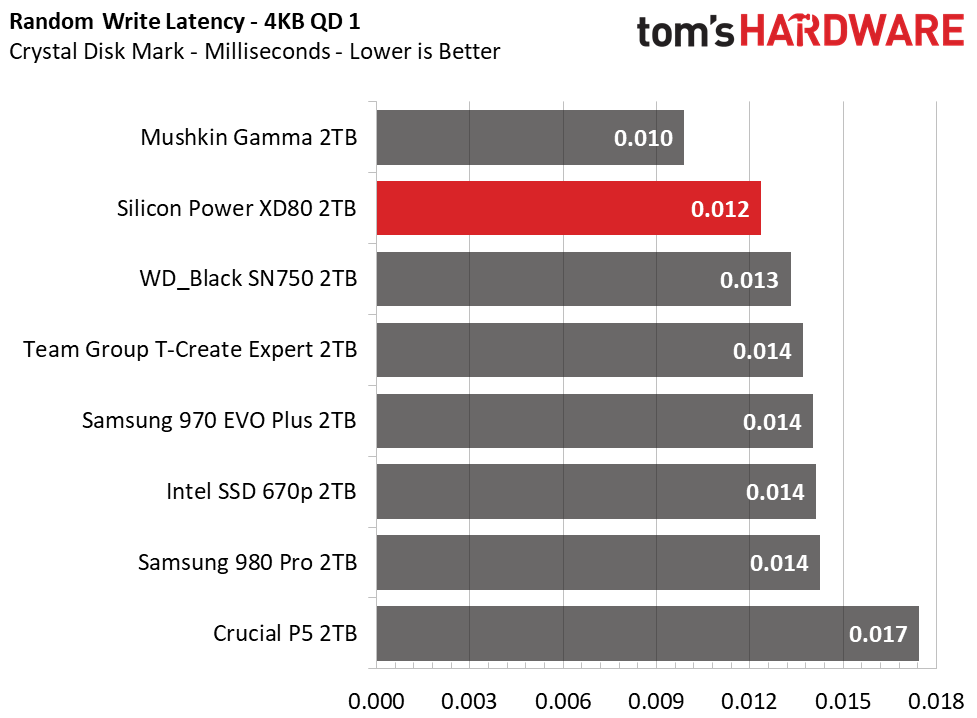
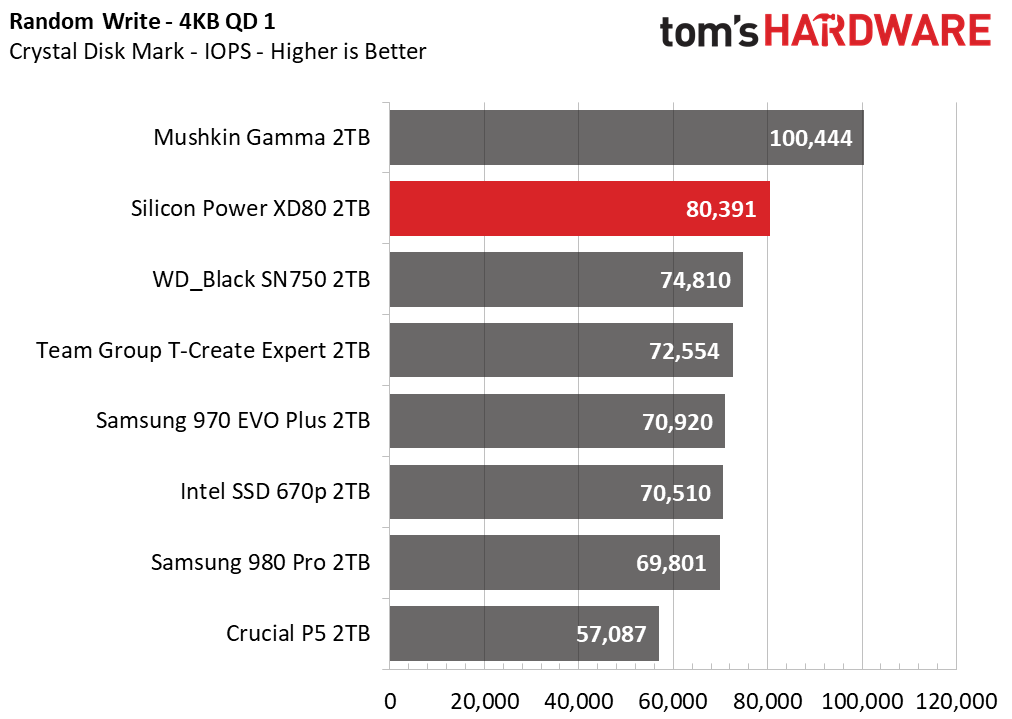
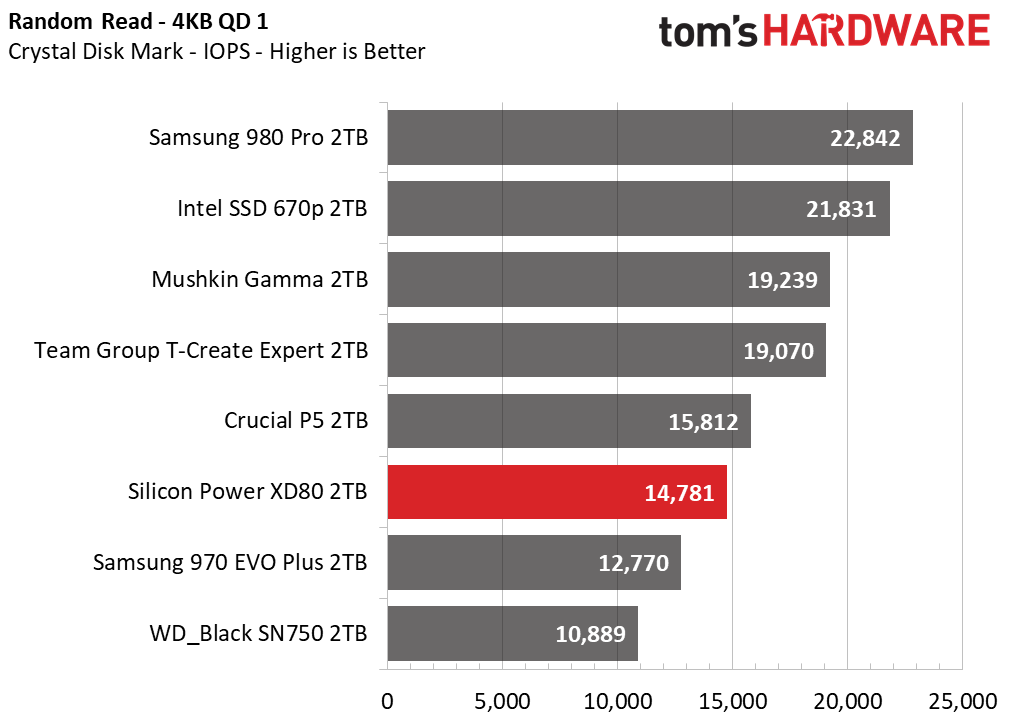
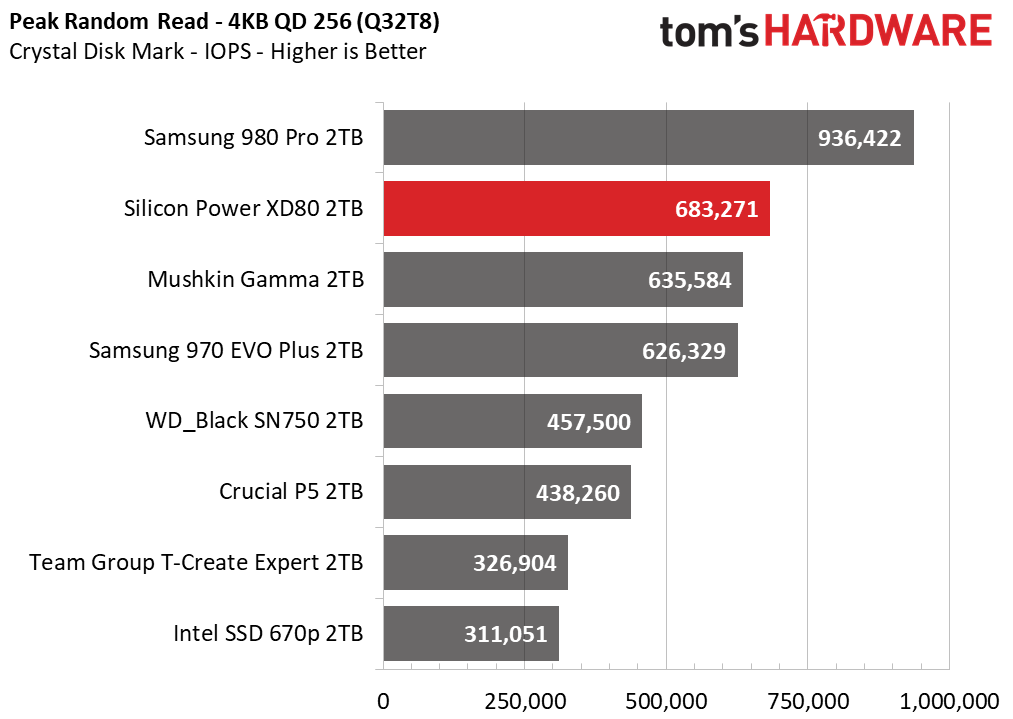
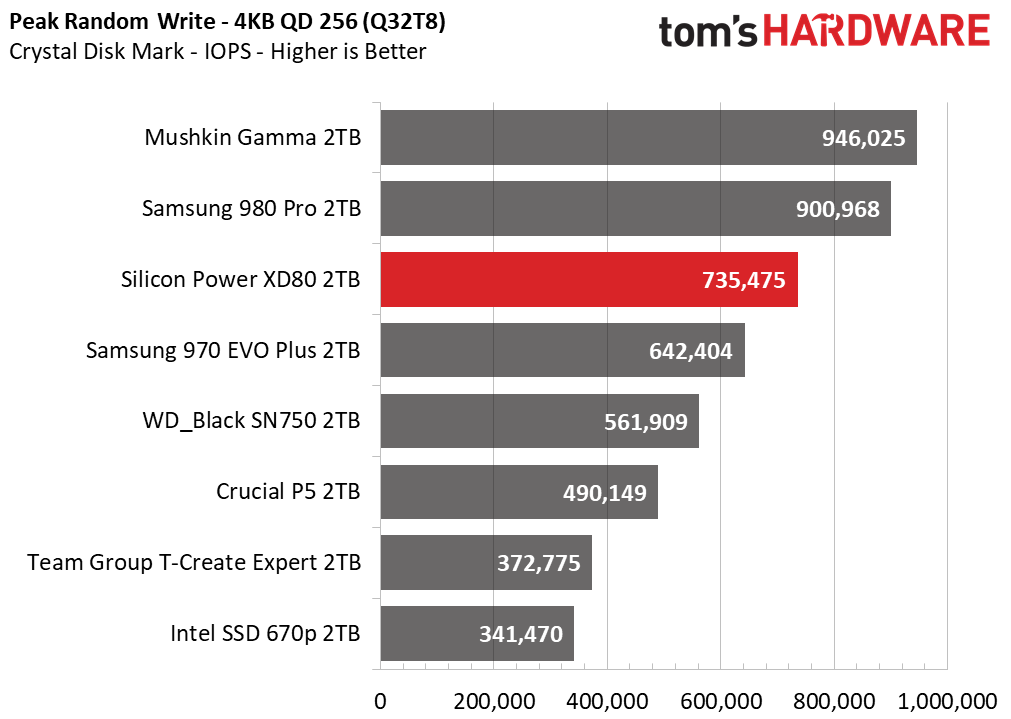
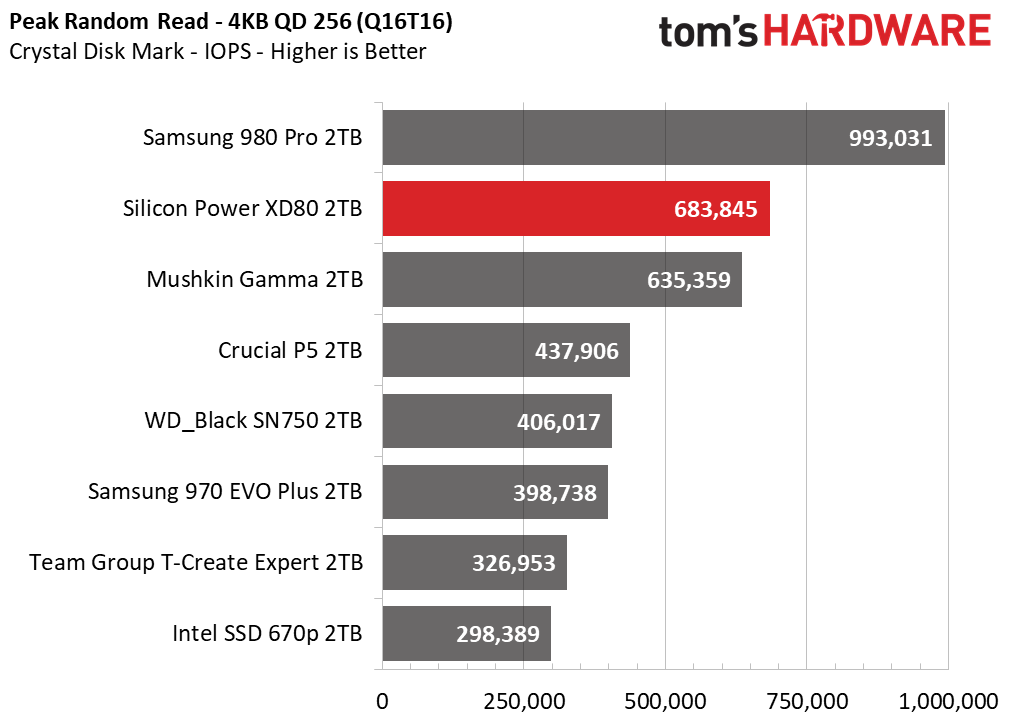
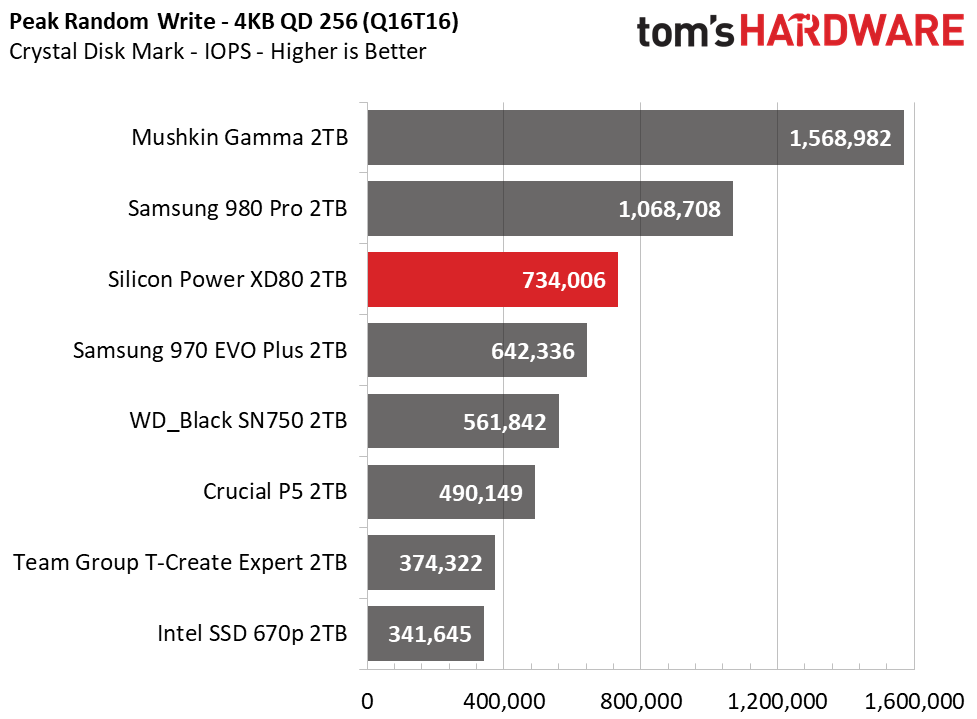
The XD80’s read speed at QD1 ranked among the slowest in the group in Crystal Disk Mark.
Random read and write speeds were respectable at a queue depth of one, but weren’t quite as lightning-fast as some competing drives. The XD80 delivered very high random IOPS results when pressured with reads and writes at a queue depth of 256, although those results don’t reflect our results with real-world benchmarks.
Sustained Write Performance and Cache Recovery
Official write specifications are only part of the performance picture. Most SSDs implement a write cache, which is a fast area of (usually) pseudo-SLC programmed flash that absorbs incoming data. Sustained write speeds can suffer tremendously once the workload spills outside of the cache and into the "native" TLC or QLC flash. We use iometer to hammer the SSD with sequential writes for 15 minutes to measure both the size of the write cache and performance after the cache is saturated. We also monitor cache recovery via multiple idle rounds.
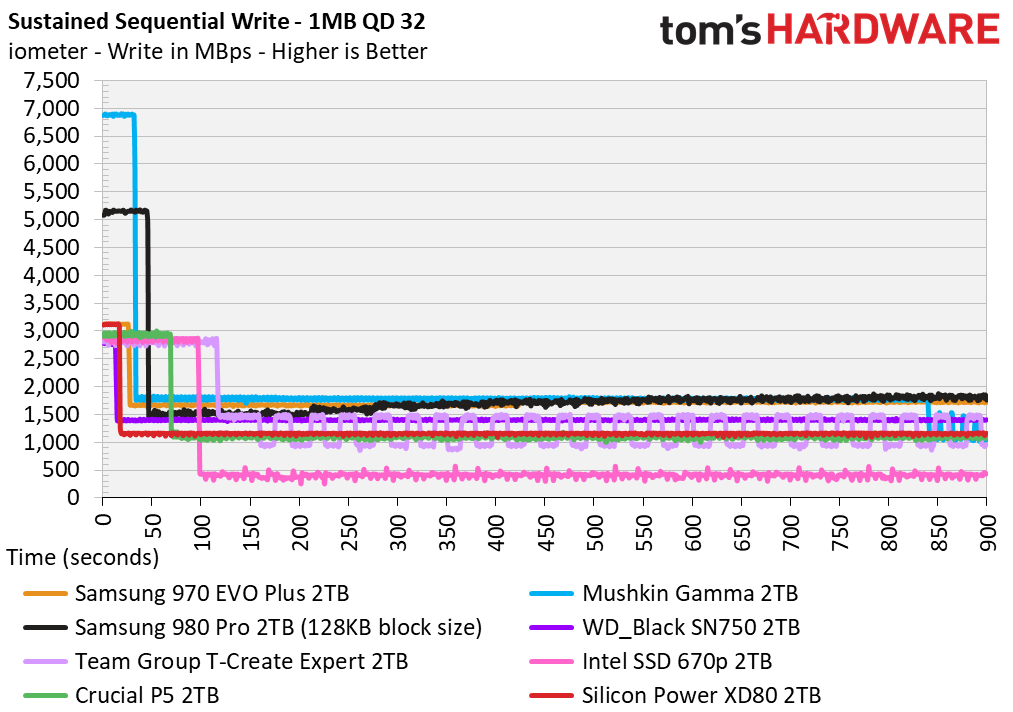
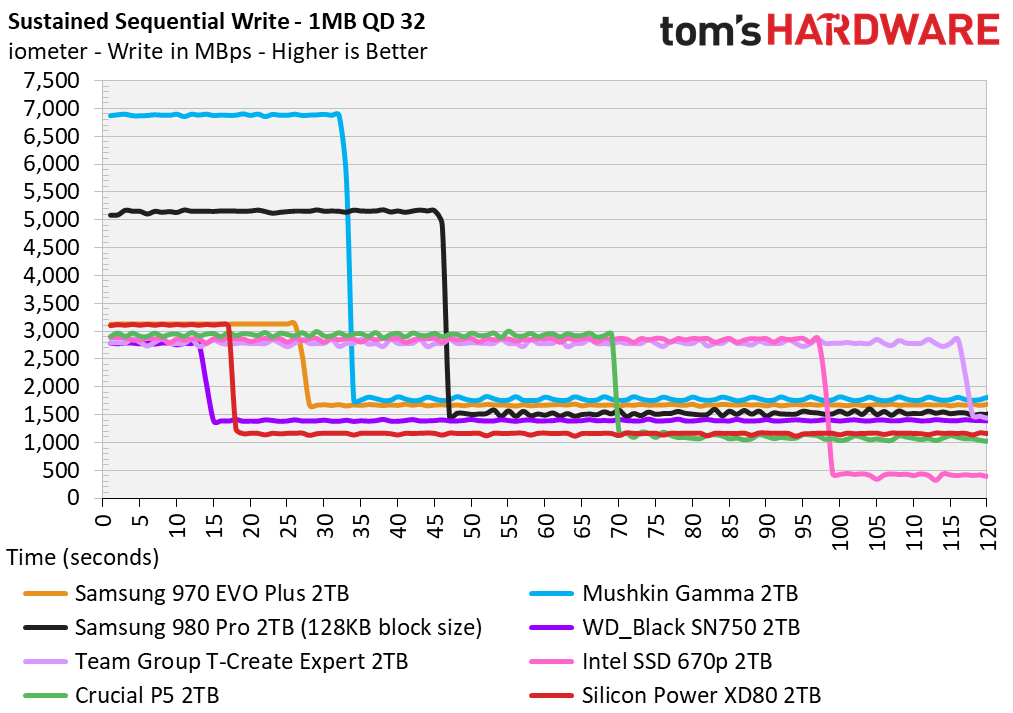
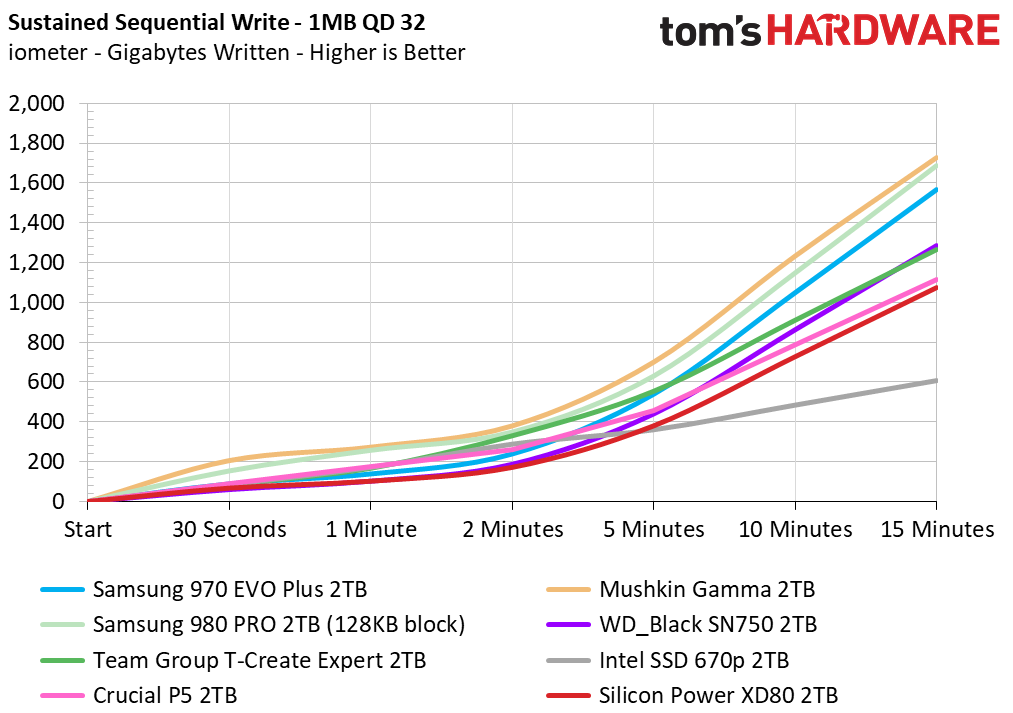
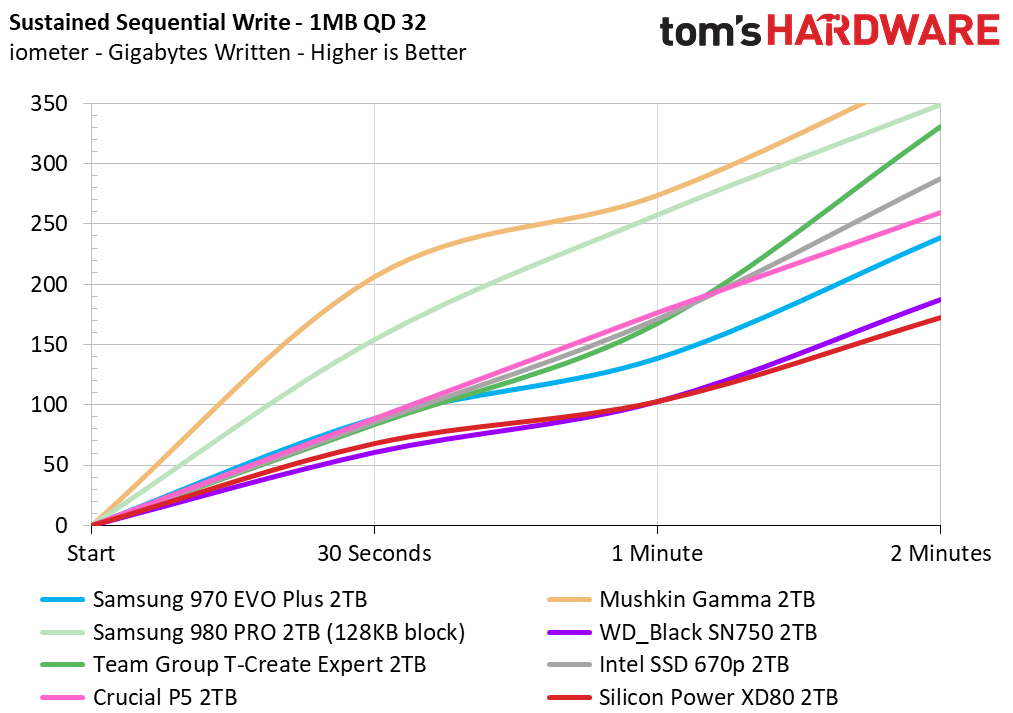
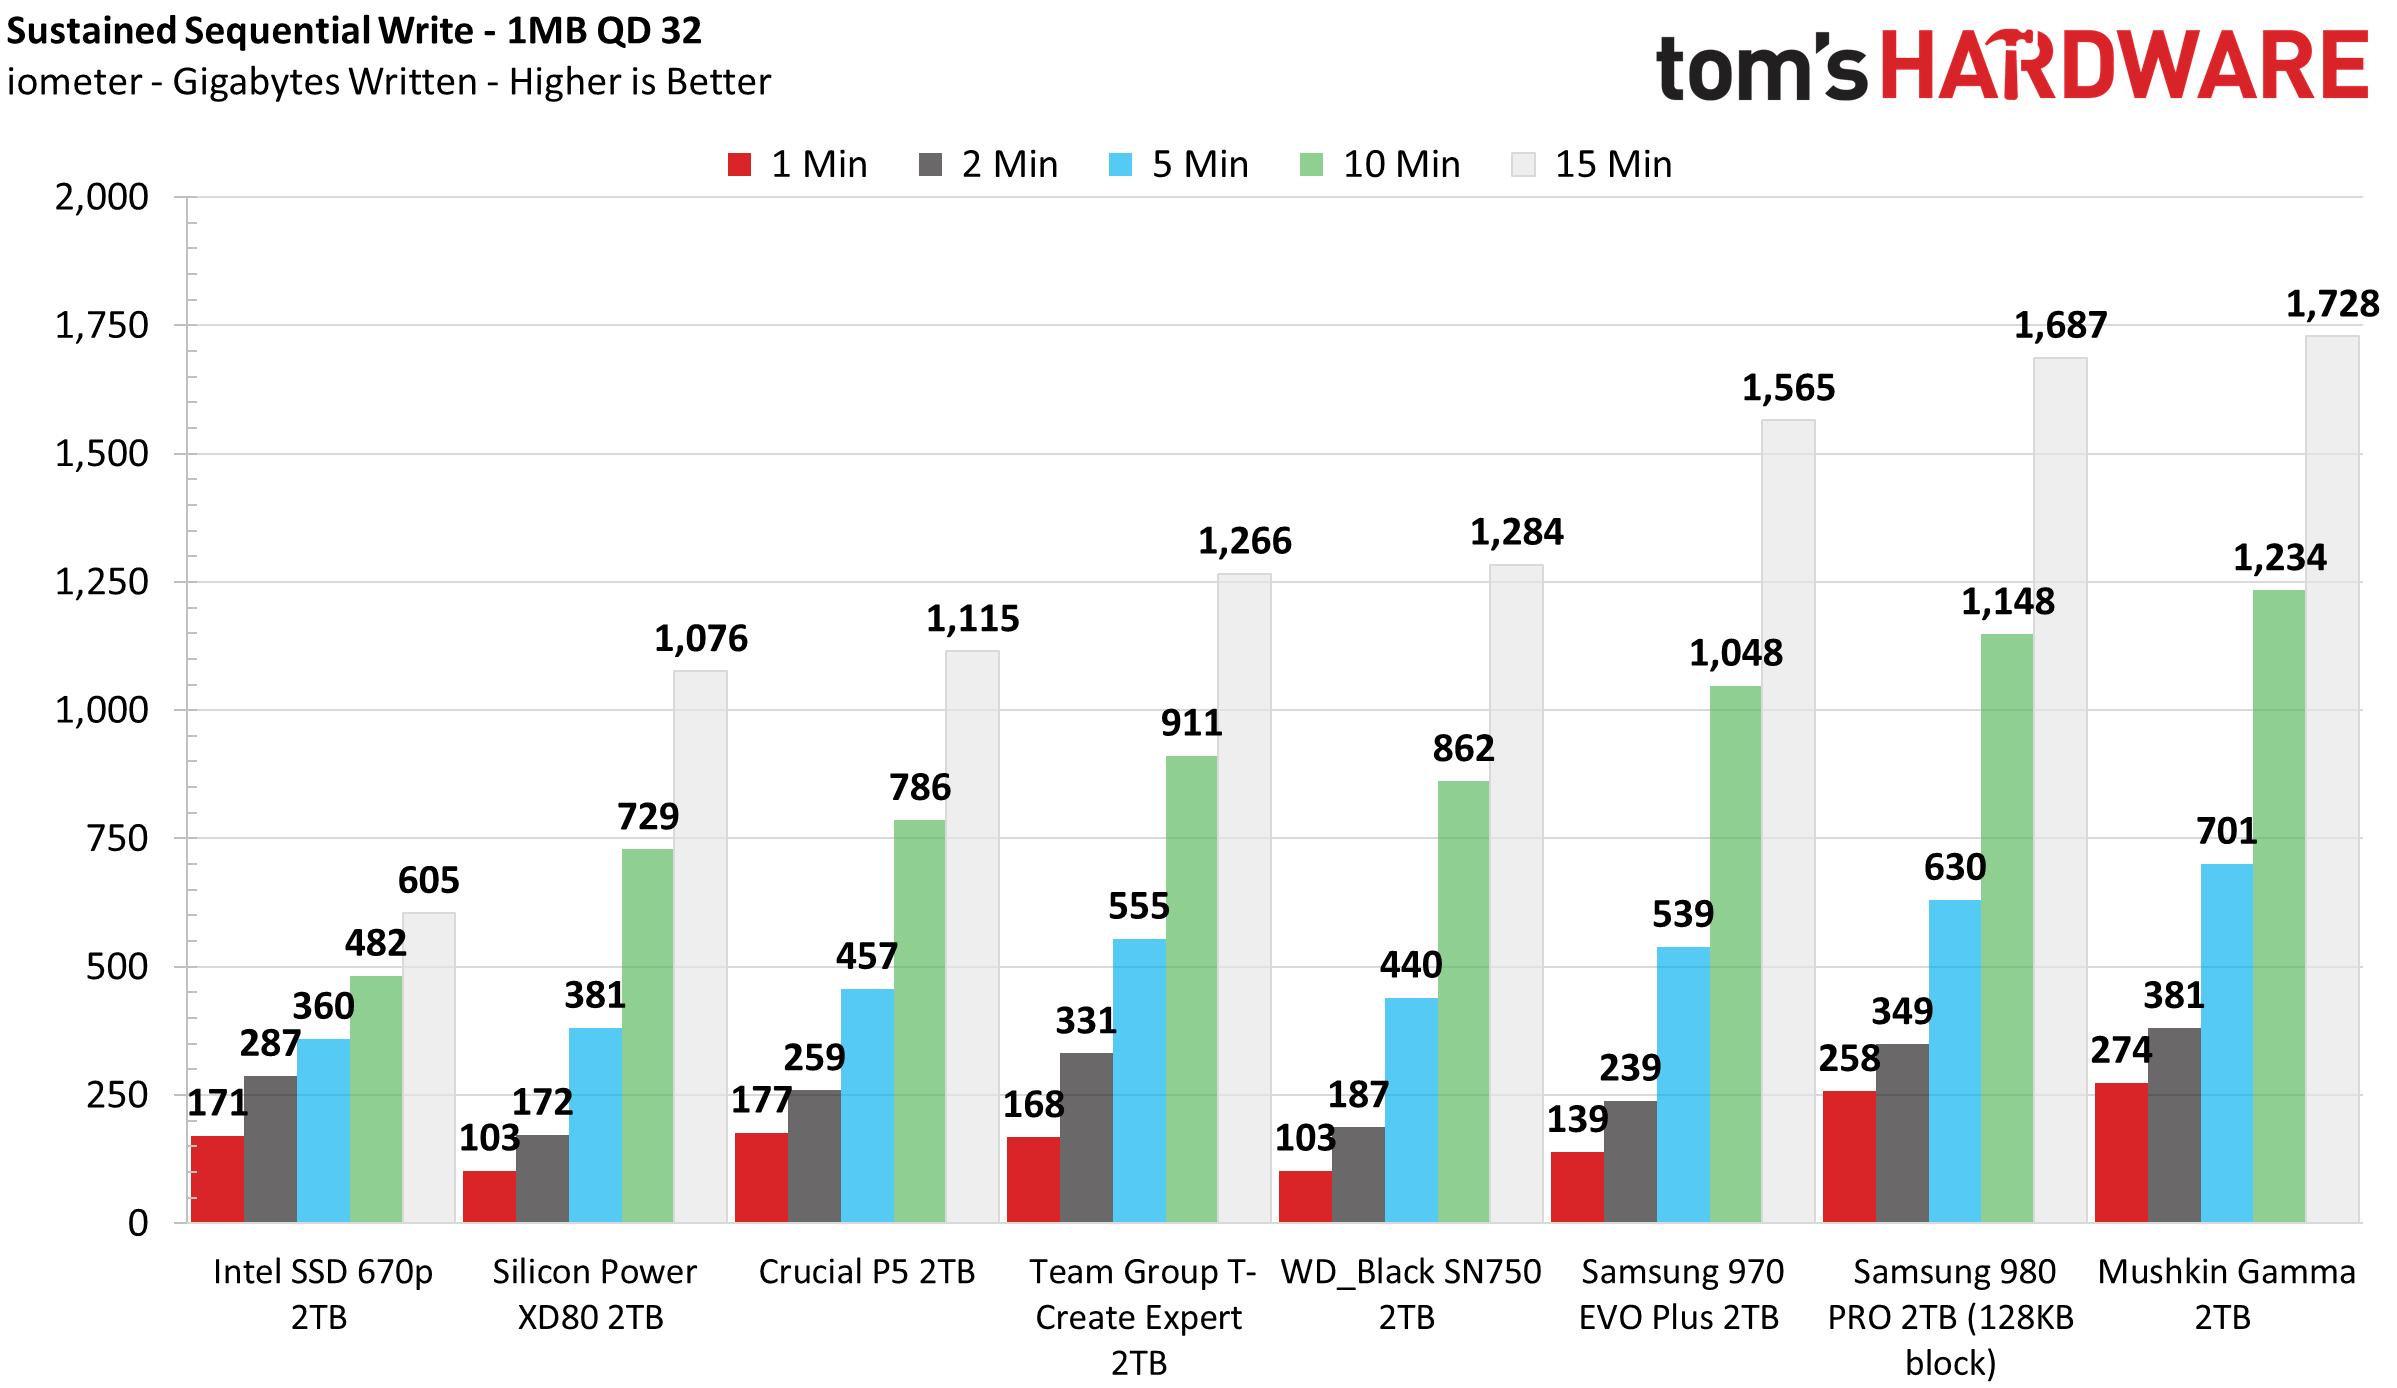
On our first pass, we found that the XD80 has a dynamic SLC cache spanning roughly 52GB, and it averaged a write speed of 3.1 GBps. However, the following write tests carried out during our idle round sequence showed that the SLC cache expanded up to 70-72GB. After the cache filled, write speeds degraded to 1,150MBps on average until the drive filled completely. Usually less than a minute is enough time for the XD80 to recover its whole cache.
Power Consumption and Temperature
We use the Quarch HD Programmable Power Module to gain a deeper understanding of power characteristics. Idle power consumption is an important aspect to consider, especially if you're looking for a laptop upgrade. Some SSDs can consume watts of power at idle while better-suited ones sip just milliwatts. Average workload power consumption and max consumption are two other aspects of power consumption, but performance-per-watt is more important. A drive might consume more power during any given workload, but accomplishing a task faster allows the drive to drop into an idle state more quickly, ultimately saving energy.
We also monitor the drive’s temperature via the S.M.A.R.T. data and an IR thermometer to see when (or if) thermal throttling kicks in and how it impacts performance. Bear in mind that results will vary based on the workload and ambient air temperature.
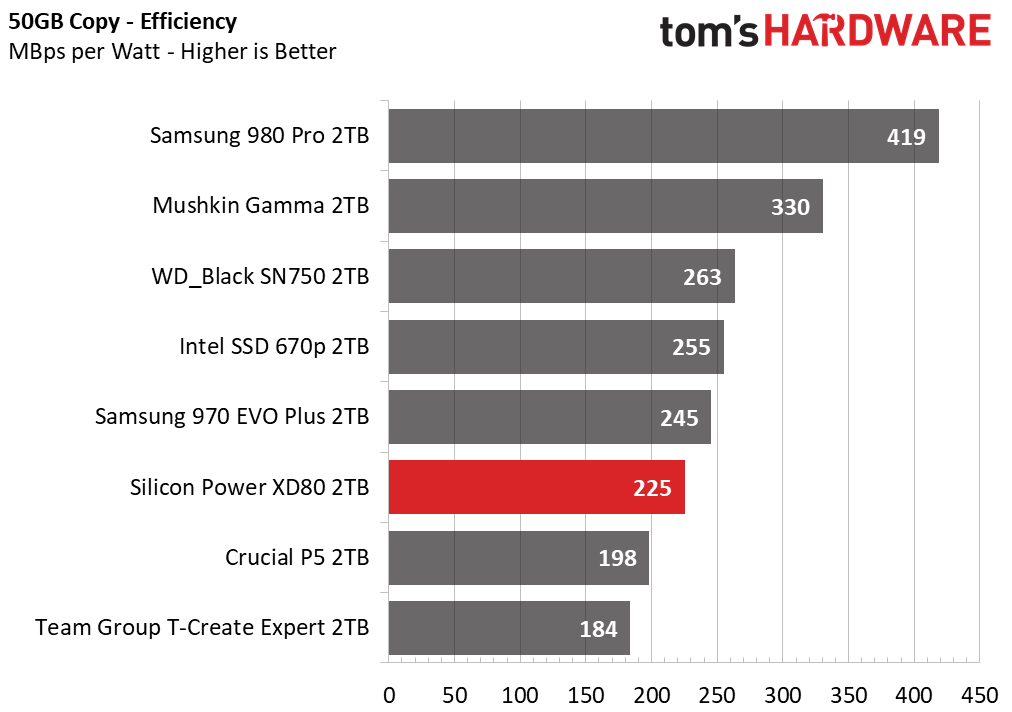
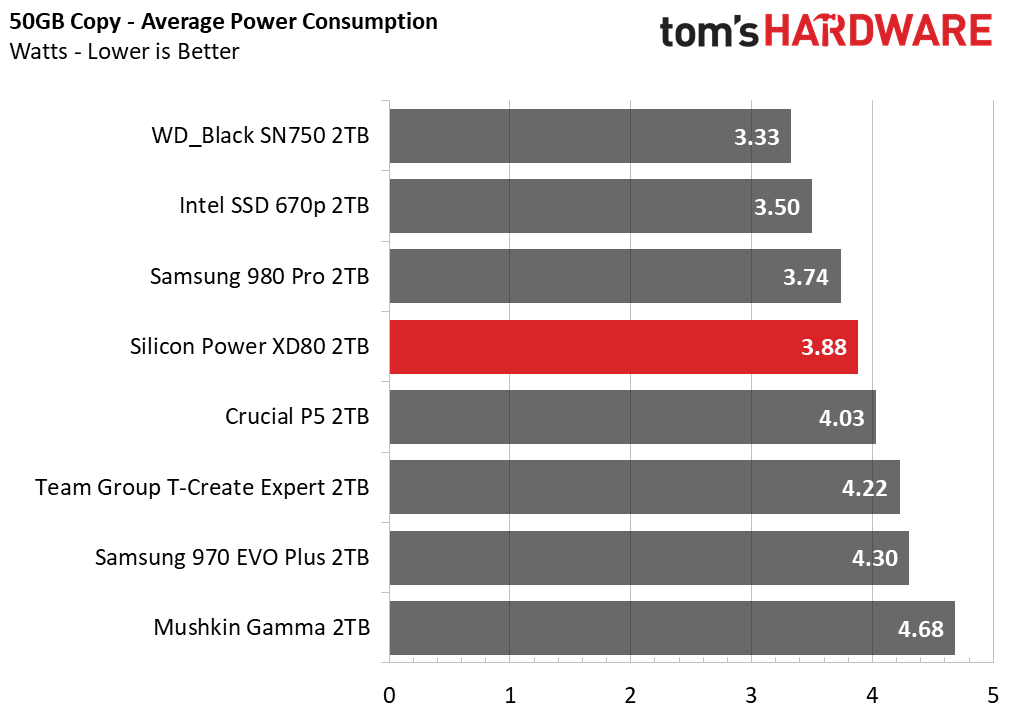
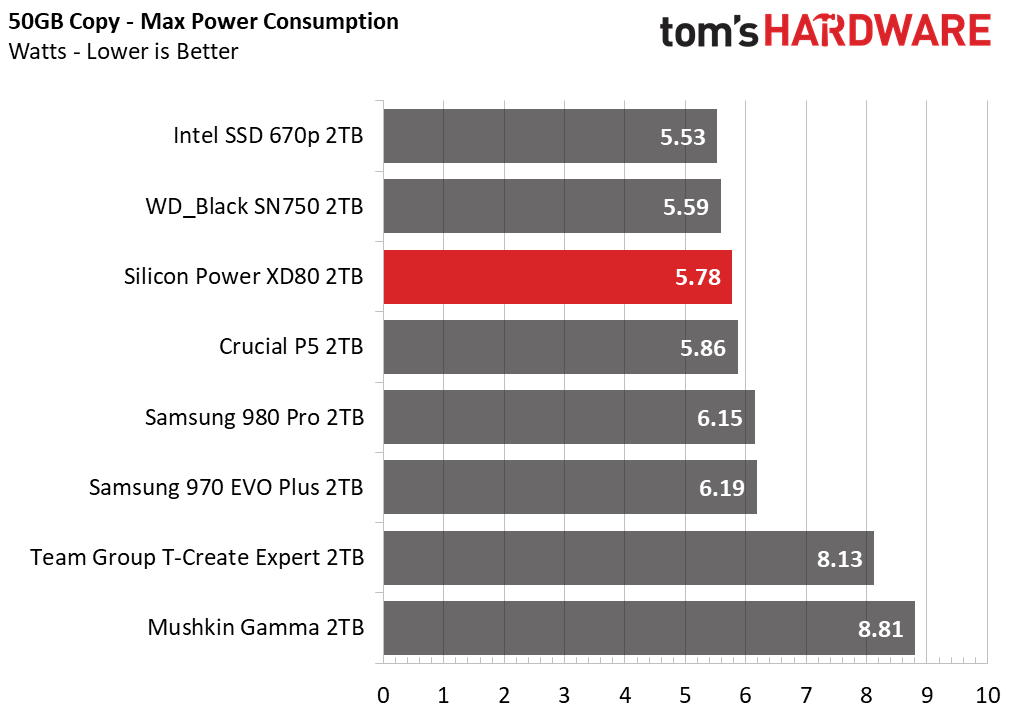
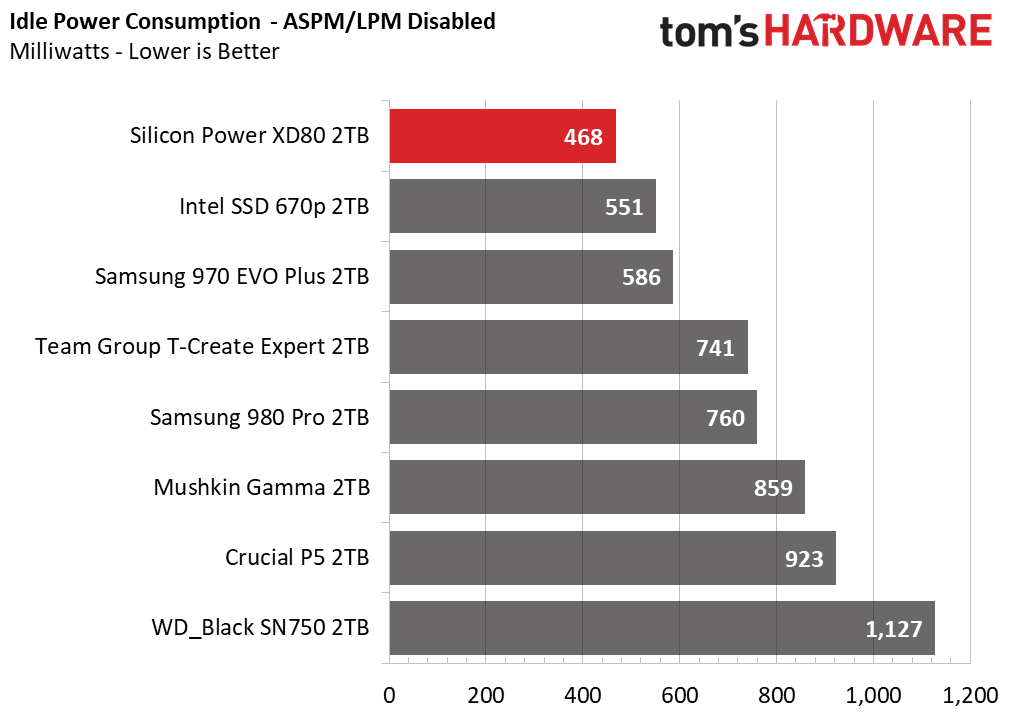
The XD80’s efficiency under load is average, managing to edge ahead of the P5 and T-Create Expert. It also demonstrated low idle power consumption, sipping under half a watt with ASPM disabled.
At idle, the XD80 ranged from 28 to 33 degrees Celsius, which is fairly cool compared to some of the SSD’s we’ve tested. Under load, the XD80 reached peak temperatures of 69C after writing roughly 500GB of data, which is 6C below its 75C thermal throttling point.
Test Bench and Testing Notes
| CPU | Intel Core i9-11900K |
| Motherboard | ASRock Z590 Taichi |
| Memory | 2x8GB Kingston HyperX Predator DDR4 5333 |
| Graphics | Intel UHD Graphics 750 |
| CPU Cooling | Alphacool Eissturm Hurricane Copper 45 3x140mm |
| Case | Streacom BC1 Open Benchtable |
| Power Supply | Corsair SF750 Platinum |
| OS Storage | WD Black SN850 2TB |
| Operating System | Windows 10 Pro 64-bit 20H2 |
We use a Rocket Lake platform with most background applications such as indexing, windows updates, and anti-virus disabled in the OS to reduce run-to-run variability. Each SSD is prefilled to 50% capacity and tested as a secondary device. Unless noted, we use active cooling for all SSDs.
Conclusion
The Silicon Power XD80 is a well-performing M.2 NVMe SSD that offers a lot of value for your dollar. While it lagged in the game loading benchmark, the XD80’s Phison’s E12S and Kioxia’s BiCS4 TLC flash makes for a responsive SSD in most workloads.
At the time of publication, Silicon Power’s 2TB XD80 is listed at just $220. That makes it cheaper than the WD Blue SN550, Sabrent Rocket Q, Corsair MP400, and many other DRAM-less and QLC SSDs, which is surprising for an SSD with a heatsink and TLC flash paired with high-end endurance ratings. But, while it is priced well against low-end contenders, it performs very well alongside the likes of Crucial’s P5 and the WD_Black SN750. All of which makes it a great value if you like the design.
Although it is not quite as fast as the newest PCIe 4.0 NVMe SSDs, the Silicon Power XD80 makes for a fairly solid choice for affordable, fast, and cool storage. Not only did it perform well in burst-oriented application testing and file transfers, but its performance also held strong and nearly kept up with the Crucial P5 during sustained writes, which is fantastic considering its much lower price point. If you are looking to save a few bucks on your next M.2 SSD purchase, the Silicon Power XD80 is worth considering.
MORE: Best SSDs
MORE: How We Test HDDs And SSDs
MORE: All SSD Content
- 1
- 2
Current page: Silicon Power 2TB Performance Results and Conclusion
Prev Page Features and Specifications
Sean is a Contributing Editor at Tom’s Hardware US, covering storage hardware.
-
Alvar "Miles" Udell Would have been nice to see the PNY CS2130 2TB on the charts as well, as it's a 2TB drive right now on sale for $200 ($20 less than the SP XD80), and TH did an article on it last year but never did a followup.Reply
PNY Technologies CS2130 2TB M.2 NVMe SSD M280CS2130-2TB-RB B&H (bhphotovideo.com)
PNY CS2310: Use That Empty NVMe Slot | Tom's Hardware (tomshardware.com) -
froggx On these disk reviews, why is it that the line graphs for the iometer sustained sequential write, gigabytes written don't use properly spaced values along the X-axis? By this I mean the intervals are labeled "0, 0.5, 1, 2, 5,10, 15 (minutes)" yet spaced in such a way to indicate that the amount of time between 1 and 2 minutes and the amount of time between 2 and 5 minutes is the same (which it isn't). Last time I did math the median value of the numbers 0 through 15 wasn't 2, nor does the median value of 0-2 minutes work out to 45 second.Reply
When graphed with equally spaced X values (based on the values at 1, 2, 5, 10 and 15 minutes as provided on the bar graph for this test), most of the drives write at a linear rate within 2 minutes of starting the test (because the SLC cache has run out by then). However, when I look at the 15 minute graph, it looks like the drives start the test slowly, then around the halfway point they all (metaphorically) rail a line of blow and the amount of data written skyrockets (not how drives out of SLC cache work). The graph for 2 minutes isn't all that much better.
I've added the links to the 2 problematic graph images here for convenience:
Graph Linky and another Graph Linky. -
seanwebster Replyfroggx said:On these disk reviews, why is it that the line graphs for the iometer sustained sequential write, gigabytes written don't use properly spaced values along the X-axis? By this I mean the intervals are labeled "0, 0.5, 1, 2, 5,10, 15 (minutes)" yet spaced in such a way to indicate that the amount of time between 1 and 2 minutes and the amount of time between 2 and 5 minutes is the same (which it isn't). Last time I did math the median value of the numbers 0 through 15 wasn't 2, nor does the median value of 0-2 minutes work out to 45 second.
When graphed with equally spaced X values (based on the values at 1, 2, 5, 10 and 15 minutes as provided on the bar graph for this test), most of the drives write at a linear rate within 2 minutes of starting the test (because the SLC cache has run out by then). However, when I look at the 15 minute graph, it looks like the drives start the test slowly, then around the halfway point they all (metaphorically) rail a line of blow and the amount of data written skyrockets (not how drives out of SLC cache work). The graph for 2 minutes isn't all that much better.
I've added the links to the 2 problematic graph images here for convenience:
Graph Linky and another Graph Linky.
I mainly used the gigabytes written data for the bar graph and throw that same data in for line graph to have another way to look at the data. The second is just a crop/zoomed-in view of the same to see the differences in cache a little easier since these are small charts. I went ahead and did some adjustments for you based on your feedback. Personally, I prefer looking at the data how I've been publishing it since it enhances the tail whip effect and SLC cache size differences, which I can more quickly differentiate, but can start throwing in this new graph instead if you prefer it.
Do you prefer the charts on the left? I appreciate the feedback. If you have any more, let me know. Thanks.
92 -
Co BIY Replyseanwebster said:I mainly used the gigabytes written data for the bar graph and throw that same data in for line graph to have another way to look at the data. The second is just a crop/zoomed-in view of the same to see the differences in cache a little easier since these are small charts. I went ahead and did some adjustments for you based on your feedback. Personally, I prefer looking at the data how I've been publishing it since it enhances the tail whip effect and SLC cache size differences, which I can more quickly differentiate, but can start throwing in this new graph instead if you prefer it.
Do you prefer the charts on the left? I appreciate the feedback. If you have any more, let me know. Thanks.
92
I 'd vote for charts on the left. It's a better presentation of the information. -
Sleepy_Hollowed Wow, this is a true steal, and absolutely all you need for PC gaming.Reply
If I didn’t use my machine for IO intensive stuff I’d buy two of these puppies, and even then I’m considering them anyways.
power-wise I’d need to test it a bit more on Linux to see if laptops would do well with it, but holy moly. -
MechGalaxy Does anyone have the idle power usage of these or can someone explain why the samsung 970 evo and intel 660p are so low?Reply
The review says just under half a watt. That seems abnormally high. It doesn't make sense given the temps and efficiencies compared to the samsung.
In contrast the (samsung 970 evo pro) uses 30 - 72mW with ASPM on or off according to the review here Samsung 970 evo Plus. -
seanwebster Reply
For lower power consumption figures ASPM needs to be enabled in the UEFI. Not all systems support toggling this in the UEFI. Therefore, we test power consumption with ASPM disabled on our latest test benches.MechGalaxy said:Does anyone have the idle power usage of these or can someone explain why the samsung 970 evo and intel 660p are so low?
The review says just under half a watt. That seems abnormally high. It doesn't make sense given the temps and efficiencies compared to the samsung.
In contrast the (samsung 970 evo pro) uses 30 - 72mW with ASPM on or off according to the review here Samsung 970 evo Plus.
Additionally, the lowest desktop idle idle state data, while important, isn’t as important as laptop idle state data. That, however takes more effort to attain and is something outside the scope of a normal review.
