Three Xeon E5 Server Systems From Intel, Tyan, And Supermicro
After taking a first look at Intel's Xeon E5 processors, we wanted to round up a handful of dual-socket barebones platforms to see which vendor sells the best match for Sandy Bridge-EP-based chips. Intel, Supermicro, and Tyan are here to represent.
Power Consumption And Noise Comparison
We used Ubuntu Server 10.10 and Folidng@Home for power consumption and acoustic testing. It's fairly common to see these measurements taken fairly quickly after a configuration is presented with load. But instead of taking a reading 15 minutes into a workload, we let these servers run at 100% utilization for six hours each. This actually yields an appreciable difference in power consumption and noise compared to the shorter testing used on desktop hardware, and is probably closer to what a server might see in a data center. We picked Folding@Home because it is a real-world GROMACS-based application used for research purposes, and a big work unit takes 24 hours or more for the machine to complete. It also scales fairly well from four to 64 cores, making it useful for generating high CPU load over long periods. Both Linux and Windows clients are available, but the Linux client tends to be a quite a bit faster on the same hardware, and Linux gives options for better thread management.
Power consumption and noise testing was performed using each motherboard's PWM-controlled fan settings. This is worth noting because there is one school of thought that suggests you should keep fans at full speed in order to push as much air through the chassis as possible. A side benefit of pegging fans at full speed is that there is no ramp up or down, putting additional wear on the fans. The other school of thought, and one that I ascribe to, is that motherboard PWM fan control is good enough to keep components cool while saving power. If workloads are relatively even, there is not much ramp up or down anyway, allowing the coolers to spin at lower average speed. Just to give you an idea, at full speed, the fans used in these barebones units can draw between 15 and 18 W each. With four to eight fans per system, that's not a negligible amount of power. Data centers typically have restrictions on power delivery, so cutting back may help save overage charges.
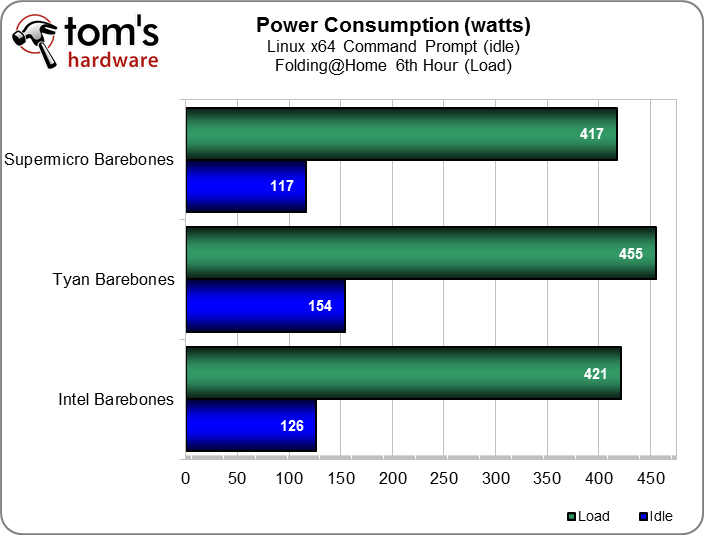
An Extech 380803 True RMS power meter was used to measure power consumption of each system. Measurements were taken at the six-hour mark and averaged over three runs. The systems were allowed to cool for three hours between runs in a fully powered-off state.
Supermicro and Intel achieve almost identical power consumption. Tyan isn't far behind. However, there is a measurable delta between the three systems. There is a distinct possibility that the difference is due to Supermicro and Intel using 80 PLUS Platinum-rated PSUs, while Tyan arms its machine with less-efficient Gold-rated power supplies. Also, Tyan uses a separate PCB to distribute power around the chassis.
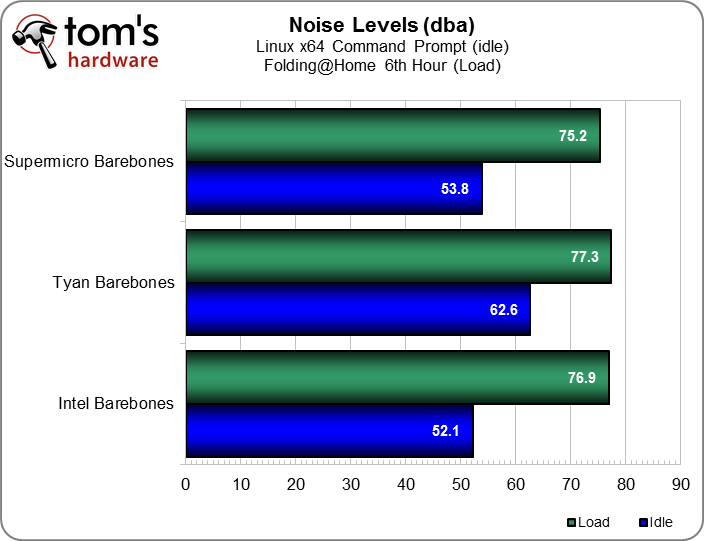
For sound testing, we used an Extech 407764 NIST-calibrated digital sound meter with a 15-foot microphone extension cable so that we could monitor from another room to preserve a 32 dB(A) sound floor (the Extech 407764 is rated for 30-130 dB sensitivity.) The idle measurements were taken 30 minutes after the system booted into Ubuntu Server, and the load readings were taken before each Folding@Home six-hour run was completed. Three runs were averaged for the scores below.
Intel does well here, as does Supermicro. The Tyan chassis is a bit louder (particularly at idle). But being a 2U enclosure, there is significantly less noise than if these were 1U machines. All three servers are too noisy to put in the middle of an open office or in a home. However, in a data center, these noise levels are expected.
Realistically, these machines will run under at least some load most of the time. So, while idle noise is recorded for the sake of completeness, the results are less relevant in the real world than the load numbers.
Get Tom's Hardware's best news and in-depth reviews, straight to your inbox.
Current page: Power Consumption And Noise Comparison
Prev Page Benchmark Results: Compiling, Folding, And Euler Next Page Whose 2U Server System For Xeon E5 Is Best?-
EzioAs Reply9532821 said:the charts are looking strange. they need to be reduced in size a bit....
I agree. Just reduce it a little bit but don't make it too hard to see -
willard TheBigTrollno comparison needed. intel usually winsUsually? The E5s absolutely crush AMD's best offerings. AMD's top of the line server chips are about equal in performance to Intel's last generation of chips, which are now more than two years old. It's even more lopsided than Sandy Bridge vs. Bulldozer.Reply -
Malovane dogman_1234Cool. Now, can we compare these to Opteron systems?Reply
As an AMD fan, I wish we could. But while Magny-Cours was competitive with the last gen Xeons, AMD doesn't really have anything that stacks up against the E5. In pretty much every workload, E5 dominates the 62xx or the 61xx series by 30-50%. The E5 is even price competitive at this point.
We'll just have to see how Piledriver does.
-
jaquith Hmm...in comparison my vote is the Dell PowerEdge R720 http://www.dell.com/us/business/p/poweredge-r720/pd?oc=bectj3&model_id=poweredge-r720 it's better across the board i.e. no comparison. None of this 'testing' is applicable to these servers.Reply -
lilcinw Finally we have some F@H benches!! Thank you!Reply
Having said that I would suggest you include expected PPD for the given TPF since that is what folders look at when deciding on hardware. Or you could just devote 48 hours from each machine to generate actual results for F@H and donate those points to your F@H team (yes Tom's has a team and visibility is our biggest problem). -
dogman_1234 lilcinwFinally we have some F@H benches!! Thank you!Having said that I would suggest you include expected PPD for the given TPF since that is what folders look at when deciding on hardware. Or you could just devote 48 hours from each machine to generate actual results for F@H and donate those points to your F@H team (yes Tom's has a team and visibility is our biggest problem).The issue is that other tech sites promote their teams. We do not have a promotive site. Even while mentioning F@H, some people do not agree with it or will never want to participate. It is a mentality. However, it is a choice!Reply

