Toshiba 65L9300U: A 4K HDTV With HDMI 2.0 Support
With Ultra HD monitors becoming more prolific, we thought it was time to check out a 4K HDTV. Toshiba sent us its 65-inch L9300U LED panel. This TV offers 3D and cloud features in addition to a high pixel count. We put it through its paces in this review.
Get Tom's Hardware's best news and in-depth reviews, straight to your inbox.
You are now subscribed
Your newsletter sign-up was successful
Results: Color Gamut And Performance
Color gamut is measured using a saturation sweep that samples the six main colors (red, green, blue, cyan, magenta, and yellow) at five saturation levels (20, 40, 60, 80, and 100%), giving us a realistic view of color accuracy.
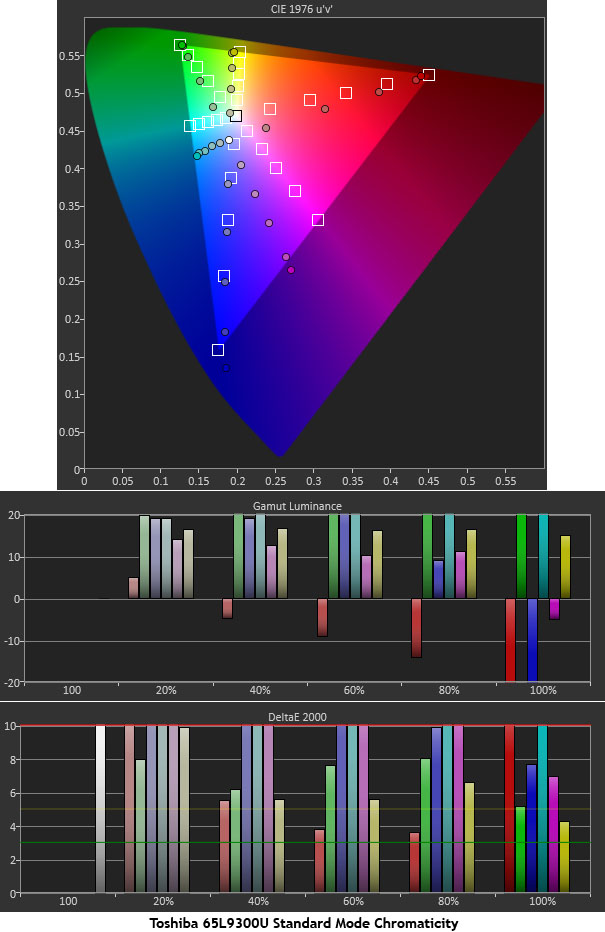
The 50L7300U’s picture modes produce different results in the color gamut test. The first chart was generated in the Standard mode at stock settings.
This is a perfect example of why we measure additional color saturation levels. Red, green, blue, and yellow at 100 percent saturation are pretty close to their targets, while cyan and magenta are fairly wide of the mark. The lower saturations are quite a bit off, with errors ranging from 11 to 19 Delta E. The inaccuracy is compounded by super-high luminance values. Some colors are over 100-percent too bright. Visually, that results in an unnaturally-intense, cartoon-like image. A lot of the color detail is crushed as well, which removes texture and depth from the picture.
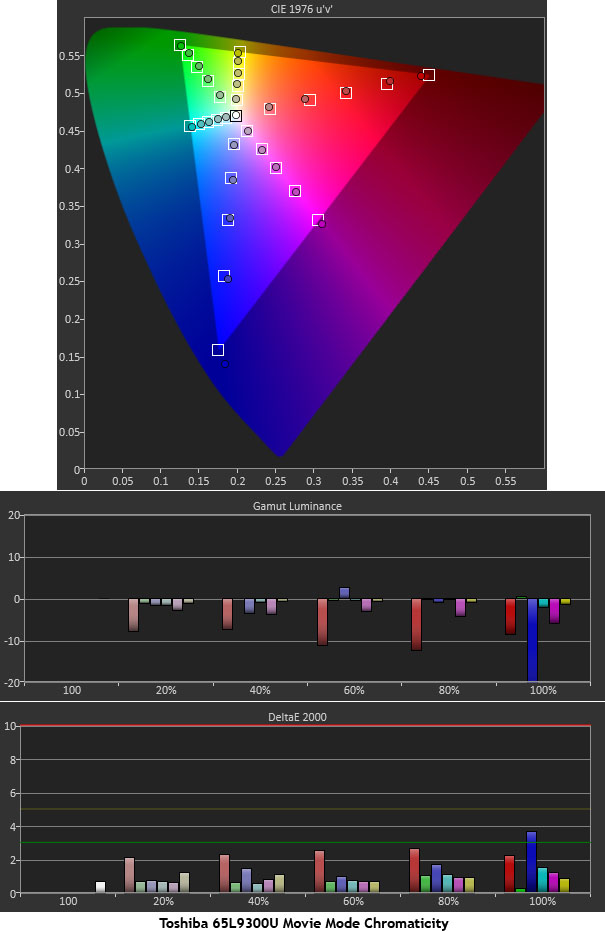
Although the 65L9300U has a CMS, we measured better chroma results without it.
This is a more respectable result. Our only concerns are the slightly low luminance values for red and blue, which can be corrected in the CMS (though the controls only affect the 100-percent saturation level). Lower levels are left unchanged. So, there is no real benefit to making that adjustment. The overall error when using the CMS is actually a bit higher.
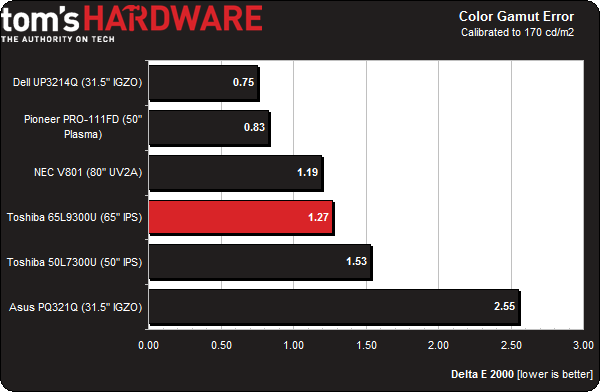
Let’s see how the 65L9300U stacks up to our other HDTVs and monitors.
At 1.27 Delta E, Toshiba's Ultra HD screen ranks among the best. The test is particularly difficult because it takes the average of 32 unique measurements. Any value under three means the error is invisible. It follows, then, that all of the screens in our sample group pass. While we're glad the 65L9300U includes a CMS, it really isn't needed.
Get Tom's Hardware's best news and in-depth reviews, straight to your inbox.
Current page: Results: Color Gamut And Performance
Prev Page Results: Grayscale Tracking And Gamma Response Next Page Results: Viewing Angles And Uniformity
Christian Eberle is a Contributing Editor for Tom's Hardware US. He's a veteran reviewer of A/V equipment, specializing in monitors. Christian began his obsession with tech when he built his first PC in 1991, a 286 running DOS 3.0 at a blazing 12MHz. In 2006, he undertook training from the Imaging Science Foundation in video calibration and testing and thus started a passion for precise imaging that persists to this day. He is also a professional musician with a degree from the New England Conservatory as a classical bassoonist which he used to good effect as a performer with the West Point Army Band from 1987 to 2013. He enjoys watching movies and listening to high-end audio in his custom-built home theater and can be seen riding trails near his home on a race-ready ICE VTX recumbent trike. Christian enjoys the endless summer in Florida where he lives with his wife and Chihuahua and plays with orchestras around the state.
-
Someone Somewhere Argh. Why do people still make TVs with rear-exit connectors? That was the #1 hardest to find criteria last time we got a new one.Reply -
SteelCity1981 Toshiba still holding onto the 3D in their TV's. I got caught up in the hype and bought me a 3D TV two years ago and honestly I have only used it maybe 4 or 5 times if that. It's something now that I look back on I could have really done without and saved money on a regular HDTV, but live and learn. a cheaper non 3D version of this would be nice. I, like most people can do without the 3D function on a TV, esp if it will reduce the cost on the TV itself. It is nice to finally see a 4k TV come with HDMI 2.0 support, something that 1080p TV's don't need but 4k do in order to take full advantage of it by allowing 60fps.Reply -
cats_Paw Untill we get 4K contenent or GPUs can manage 4K resolutions in AAA titles with highest settings possible, 4K makes as much sense as a fast car in a 50 Km/h town.On the 3D matter, it does look cool on a projector if you get a 120+ inch screen, but in tvs, it looks like a gimick to me.Now... The HDMI improvment is something I want. Ive been wanting Full HD 60Hz 3D for a long time, and it seems 3D has been so unpopular that it didnt even make sense to invest in improving bandwidth.Reply -
Someone Somewhere You can do 1080p120 (equivalent to 60Hz 3d 1080p) over HDMI 1.4a easily... same bandwidth as 1440p60.Reply -
alchemy69 4K TVs are bought by the same people who buy $100 Monster hdmi cables because "they give a better picture".Reply -
Someone Somewhere Actually, 4K TVs can bring a better picture. Especially if one has 4K content, or is viewing pictures or text.Reply
Monster cables are definitely crap though. -
TheDane ReplyArgh. Why do people still make TVs with rear-exit connectors? That was the #1 hardest to find criteria last time we got a new one.
Argh. Why don't people use a cheap angled adapter. -
TheDane Like this: http://www.amazon.com/s?ie=UTF8&page=1&rh=i%3Aaps%2Ck%3Ahdmi%20angle%20adapterReply


