Why Your Wi-Fi Sucks And How It Can Be Helped, Part 2
In Part 1, we explained what can go wrong with Wi-Fi signals and how access points can work to improve your wireless performance. It's time for a reality check. We throw six contenders against 65 clients and some hellish interference. Who's left standing?
What Interference Looks Like
In our 5 GHz interference testing, interference and adverse contention conditions were generated by the 60 Dell clients all connecting to an AP mounted to the ceiling roughly above the middle of the client cluster. In the corner of our office space, shown by the green dot on the previous environment map, we mounted the AP being tested to the ceiling. Thus we had two discrete wireless LANs, the small one (single client and AP under test) having to function in the face of 61 interfering Wi-Fi devices. In effect, this setup is like two people trying to have a normal conversation on a patio overlooking an adjacent open-air rock concert. We wanted two separate WLANs in order to isolate interference as our main variable, not interference and client load.
For our 2.4 GHz tests, we wanted a worst-case scenario, so we combined a 100-foot client-to-AP distance, plus obstructed line-of-sight, plus having a non-Wi-Fi RF noise generator placed right on the spot where our client sat for the 70-foot 5 GHz tests. This raises an interesting point from our part 1 discussion about the difference between types of interference and their impact on communication performance.
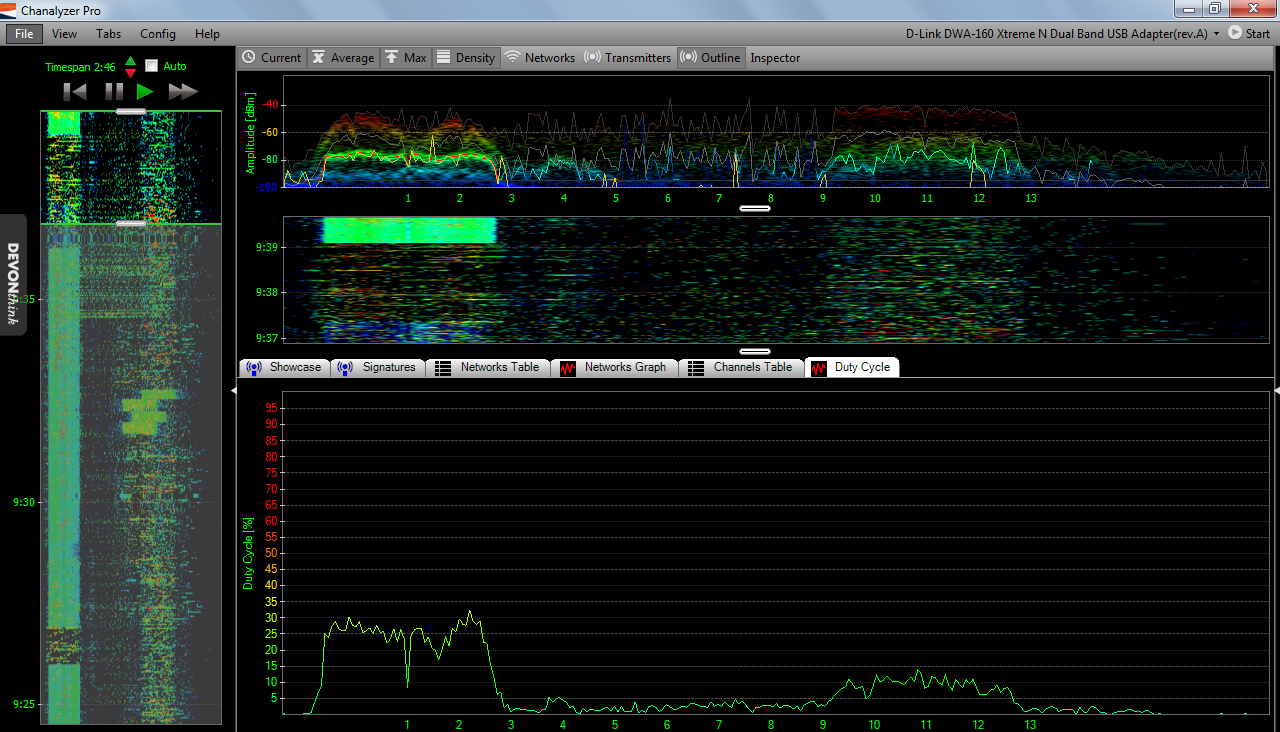
Using Metageek's Chanalyzer Pro, we took several measurements near our test access point. In this first image, you see the impact of running our non-Wi-Fi interference generator. In real life, this might be something like a microwave oven—some device spewing out gobs of noise smack on the same frequency used by channel 1 in the 2.4 GHz spectrum. As you can see in the duty cycle measurement, roughly 30% of the available bandwidth around our channel is blown out by the noise. Also notice how the amplitude of this noise registers just about the -80 dBm level.
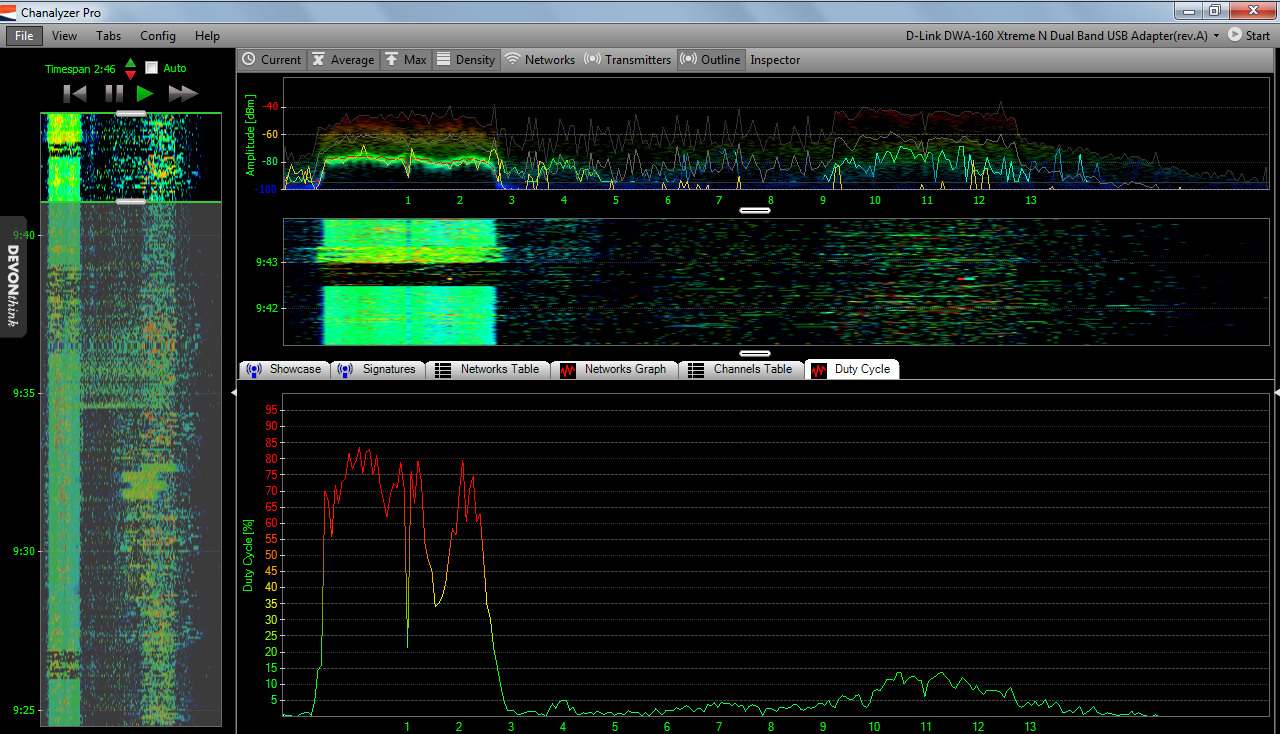
Next, we add one client connecting to our target access point. The amplitude doesn't budge, but now we see the duty cycle spiking up over 80%.
If you’re curious, that bump in traffic around channel 11 is an unrelated WLAN running in a nearby building.
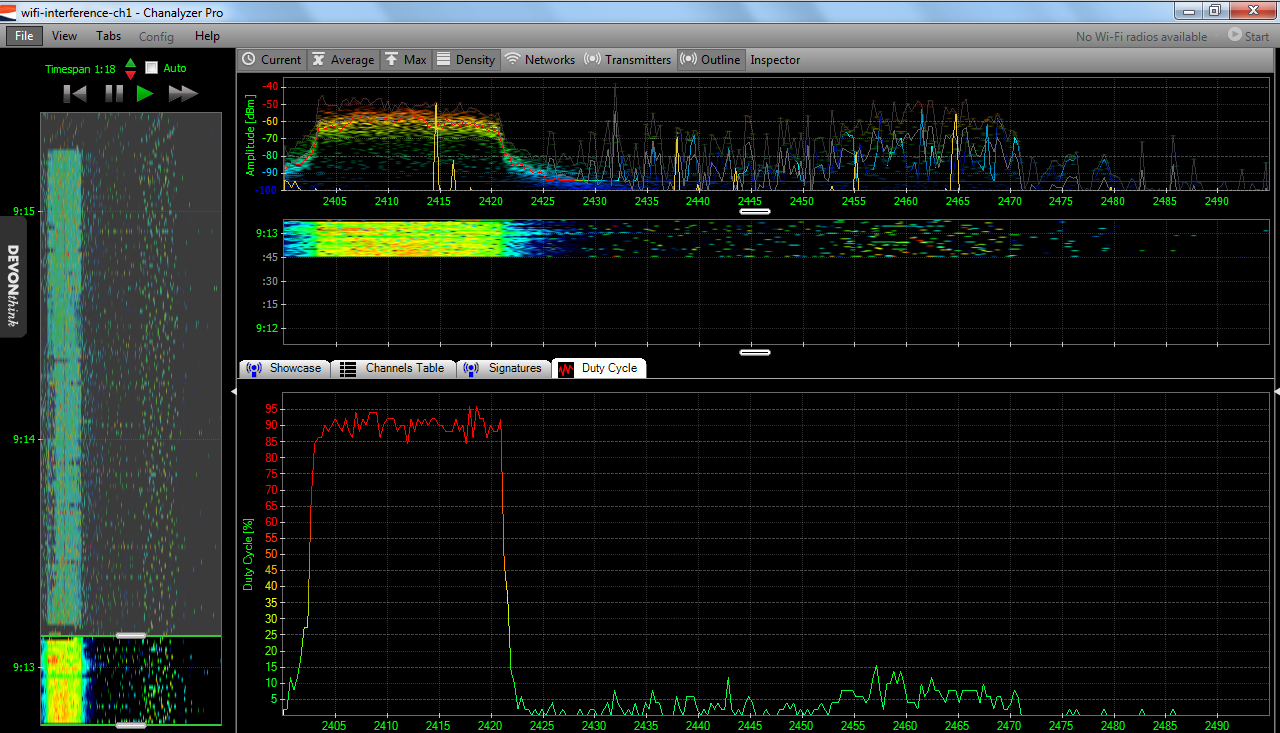
Finally, we add wireless traffic from all 60 of our Vostro clients into the mix. Amplitude jumps above -60 dBm and the duty cycle nearly redlines, peaking at 95%. You know how your PC performs when CPU utilization holds at or above 90%? Imagine something analogous with Wi-Fi contention. Refer back to our contention discussion in part 1 and consider how common it would be for packets to require resending over and over in such an environment. How the access point deals with this situation will be critical in determining the end-user’s experience.
Get Tom's Hardware's best news and in-depth reviews, straight to your inbox.
Current page: What Interference Looks Like
Prev Page Hardware And Methodology, Explained (Continued) Next Page Coverage Areas-
winner4455 Hey, I still haven't read this article but right away I notice the new format. Just thanking you for listening to your readers! :)Reply -
cangelini Very welcome Winner. We thought the picture story format would work for that last part and didn't realize the text would come out to be so terrible. From now on, we'll only use picture stories when the captions fit without requiring another click!Reply -
tacoslave cangeliniVery welcome Winner. We thought the picture story format would work for that last part and didn't realize the text would come out to be so terrible. From now on, we'll only use picture stories when the captions fit without requiring another click!"Now thats what i like to hear!"Reply -
nekromobo What if you add few thin-foil balls to room (the size of fist or 2)Reply
That should add few rf-reflections or paths, right?
Just your 2cent amplifier.. :) -
I wonder why you didn't include Juniper products (formerly trapeze)to this test. It's quit a big player here in europe. Trapeze also produced the 3com wireless manager and accesspoints which was sold widely here.Reply
-
Hupiscratch In the page "Benchmark Results: Close Range, No Interference", the HP AP is missing on the downlink graph.Reply -
Onus This was an outstanding article. Going just by this, Ruckus and Cisco are the only two I'd consider out of the box, but it would be very interesting to do a follow on that features even a minimal amount of tweaking to see what changes. A consumer expects a product to work well out of the box, but an enterprise network engineer almost certainly does not.Reply
-
Very thorough. Lots of hard work went into this and it shows. But how did you select client devices? Did you try any other chipsets? We tried something like this with more diverse clients and got results that were too variable to reach conclusions. (Some clients just did better with some APs than others.)Reply


