PresentMon: Performance In DirectX, OpenGL, And Vulkan
Performance Versus Smoothness
Quantifying Experience In The Game World
Moving beyond the idea of average performance, or even performance over time, we break apart the smallest unit of measure, the second, to evaluate frame pacing, consistency, and stutter, all of which affect your perception of smoothness. Obviously, we want to see all of the frames that go into a frame-per-second average to render at even intervals, yielding the most pleasant pacing possible for a given performance level.
But that's not always what we observe. Sometimes high frame rates are accompanied by problematic stuttering. And that's why we have to evaluate performance separately from smoothness, even though they're inherently related.
A Simple Performance Analysis
First, let's compare two cards under DirectX 11 and 12. In the following charts, frame times are on the X axis and percentage points are on the Y axis. Ideally, you want to see the numbers to the left (shorter frame times) represented by the highest percentage possible. Anything above 33 ms drops below the 30 FPS mark. That's just ugly, so the far-right line should be as short as possible.
Interestingly, we see DirectX 12 shift the Radeon's line to the left on the enthusiast and mainstream PCs, while Nvidia isn't affected as profoundly.
A Simple Smoothness Analysis
To achieve suspension of disbelief and really draw you in to the gaming experience, individual frames must be delivered as smoothly as possible with minimal differences between render times. Swings as small as 10 to 20 milliseconds are perceived by our brains as micro-stutter, and these interruptions negatively affect our gaming experience. Of course, some of us are more sensitive to this phenomenon than others.
Again, we're looking at percentage on the Y axis. But instead of raw frame times on the X axis, we're looking at frame to frame differences up to 10 ms. Above that threshold, we'll have to zoom out for more detail. For now, though, those spikes at the end of the chart are large enough to tell us we aren't getting as smooth of an experience as we'd want on either system, using DirectX 11 or 12. Ideally, we'd want to see the whole line shifted as far left as possible. The RX 480 in our high-end config comes closest to achieving this under DirectX 11. Its behavior under DX 12 isn't as compelling.
The preceding charts alluded to what gets spelled out more explicitly in these graphics: despite overall higher performance (especially from the mainstream FX-based machine), our DirectX 12 runs suffer from greater frame time differences than DX 11, which appeared smoother, at least according to our benchmark results. It's time to go deeper...
Get Tom's Hardware's best news and in-depth reviews, straight to your inbox.
Frame Rate Versus Frame Time Difference
As they say, many roads lead to Rome. First, we interpolate the frame rate curve to match the frame time output, allowing us to compare them directly. But the differences in render times are not a simple subtraction problem between frames. Rather, we perform a more complex calculation that reveals values most likely to affect your level of immersion.
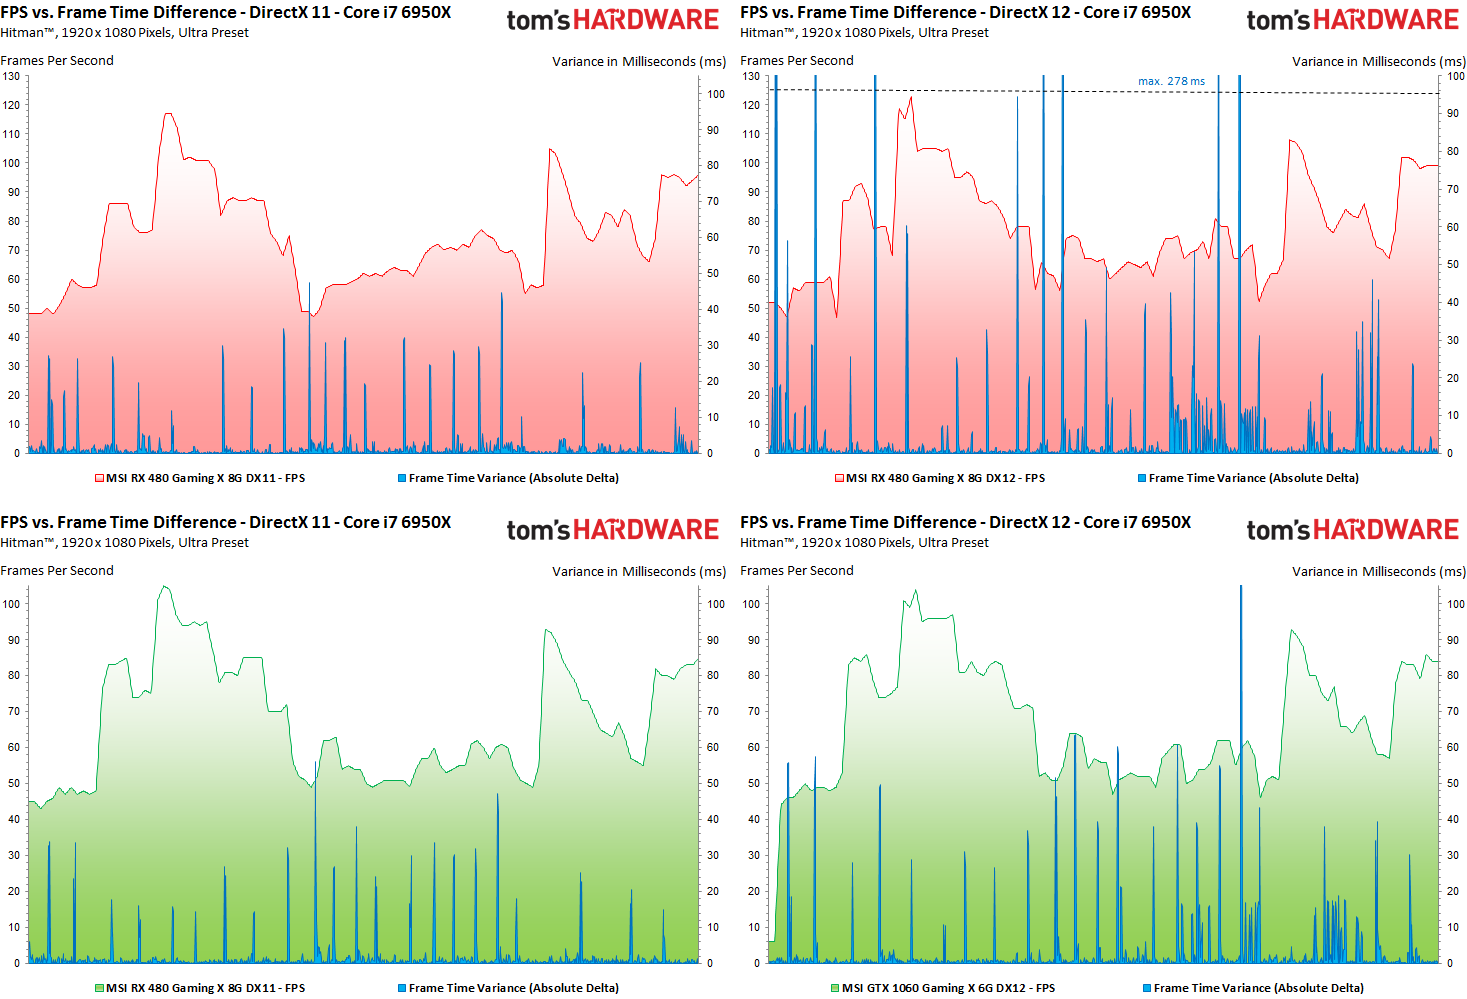
Let us first consider the faster Core i7-based machine:
Talk about an illustrative example. We see very clearly that higher frame rates don't necessarily correspond to a more immersive experience. Particularly on the Radeon, spikes up above 100 ms aren't just micro-stutter; those are significant hitches in the action, and you're definitely going to notice them. Nvidia isn't immune either. Its GTX 1060 also suffers a higher frequency of pauses shifting from DX 11 to 12.
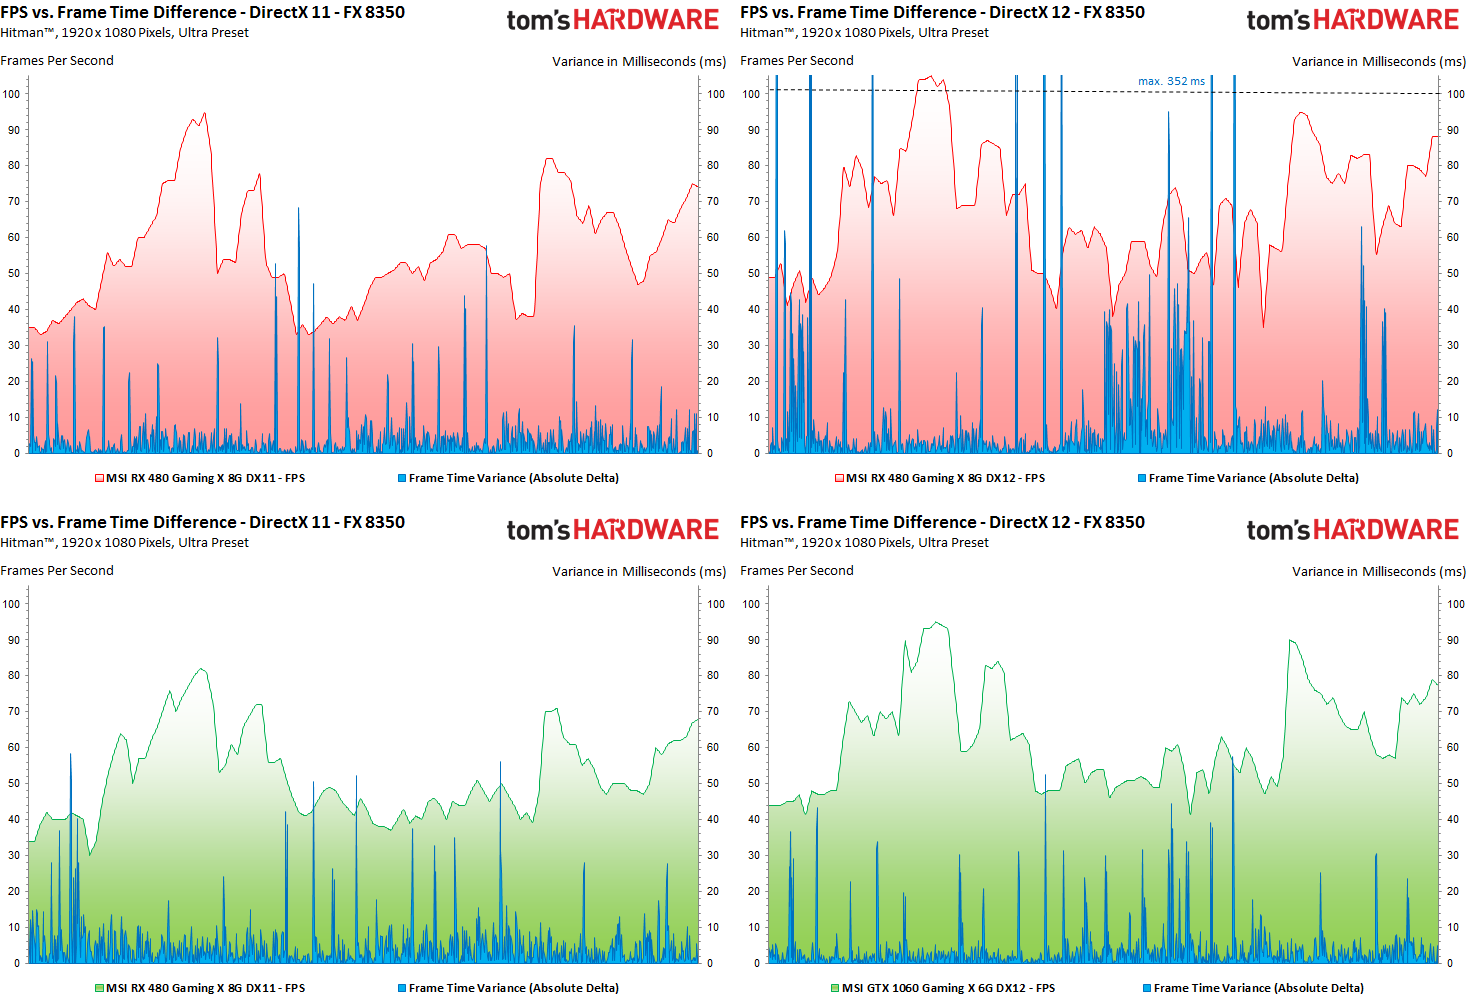
Frame rates on the slower system improve more dramatically under DX 12, particularly with AMD's Radeon RX 480 installed. There's an obvious trade-off in the form of disturbing frame time variance, though.
DirectX 12 only really helps the GeForce GTX 1060 on our lower-end platform. The Nvidia card's peaks and valleys aren't as pronounced, and its frame time variance over time isn't as prone to wild swings.
The Incorruptible "Stuttering Index"
At first, we split the run into one-second intervals and calculate the frame rate of each one. This is the basis for our index listings. Each interval gets a value based on its FPS result. Anything under 30 FPS is unplayable, between 30 and 60 FPS ranges from playable, good, and very good. The index goes lower the faster the frame is rendered.
This is still too rough, though. A brief burst of slow frames may show up within a smooth 70 FPS interval. You wouldn't know it from the frame rate, but you'll definitely see it during real-world gaming. Therefore, we explore the render times of individual frames and the differences between respective frames, too.
To prevent accidental misinterpretations, we use an intelligent filter that catches transitions between the cut scenes you often see in built-in benchmarks. If one sequence is not complex and runs faster, and the second is more challenging, slowing performance, this artifact is filtered out (frame preview, block-wise comparison); it's not real stuttering, but rather a scene change.
In this way, a fairly accurate forecast can be made whether stuttering or dropped frames are visually perceptible to the gamer. If the score for a single frame is higher (that means worse) than the base FPS value, the whole interval is marked with the higher/worse index value.
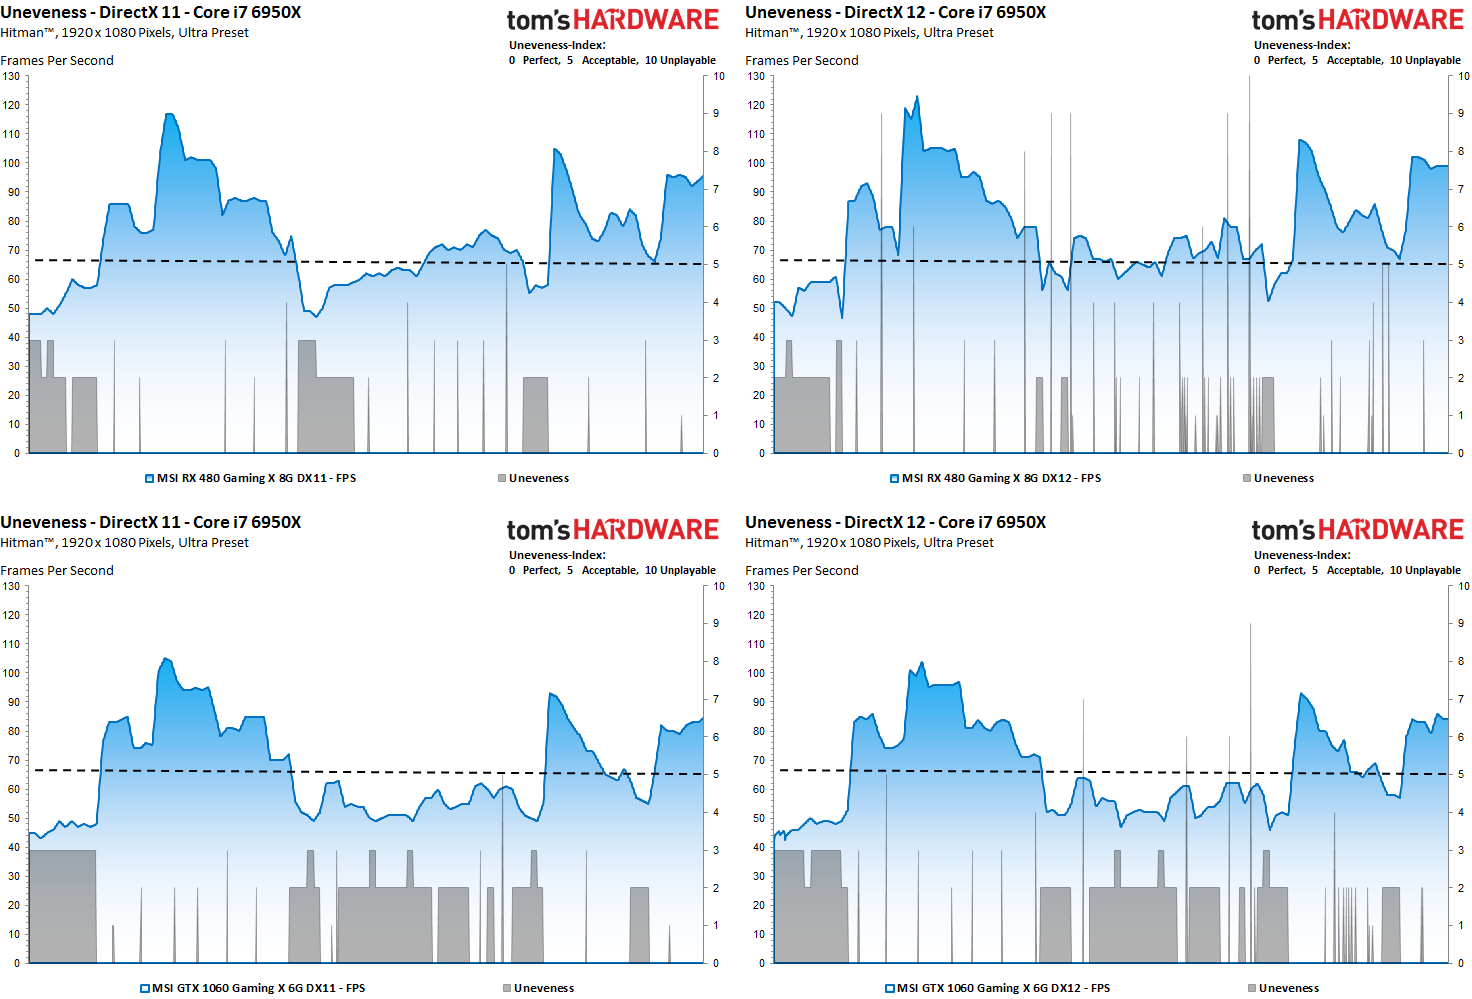
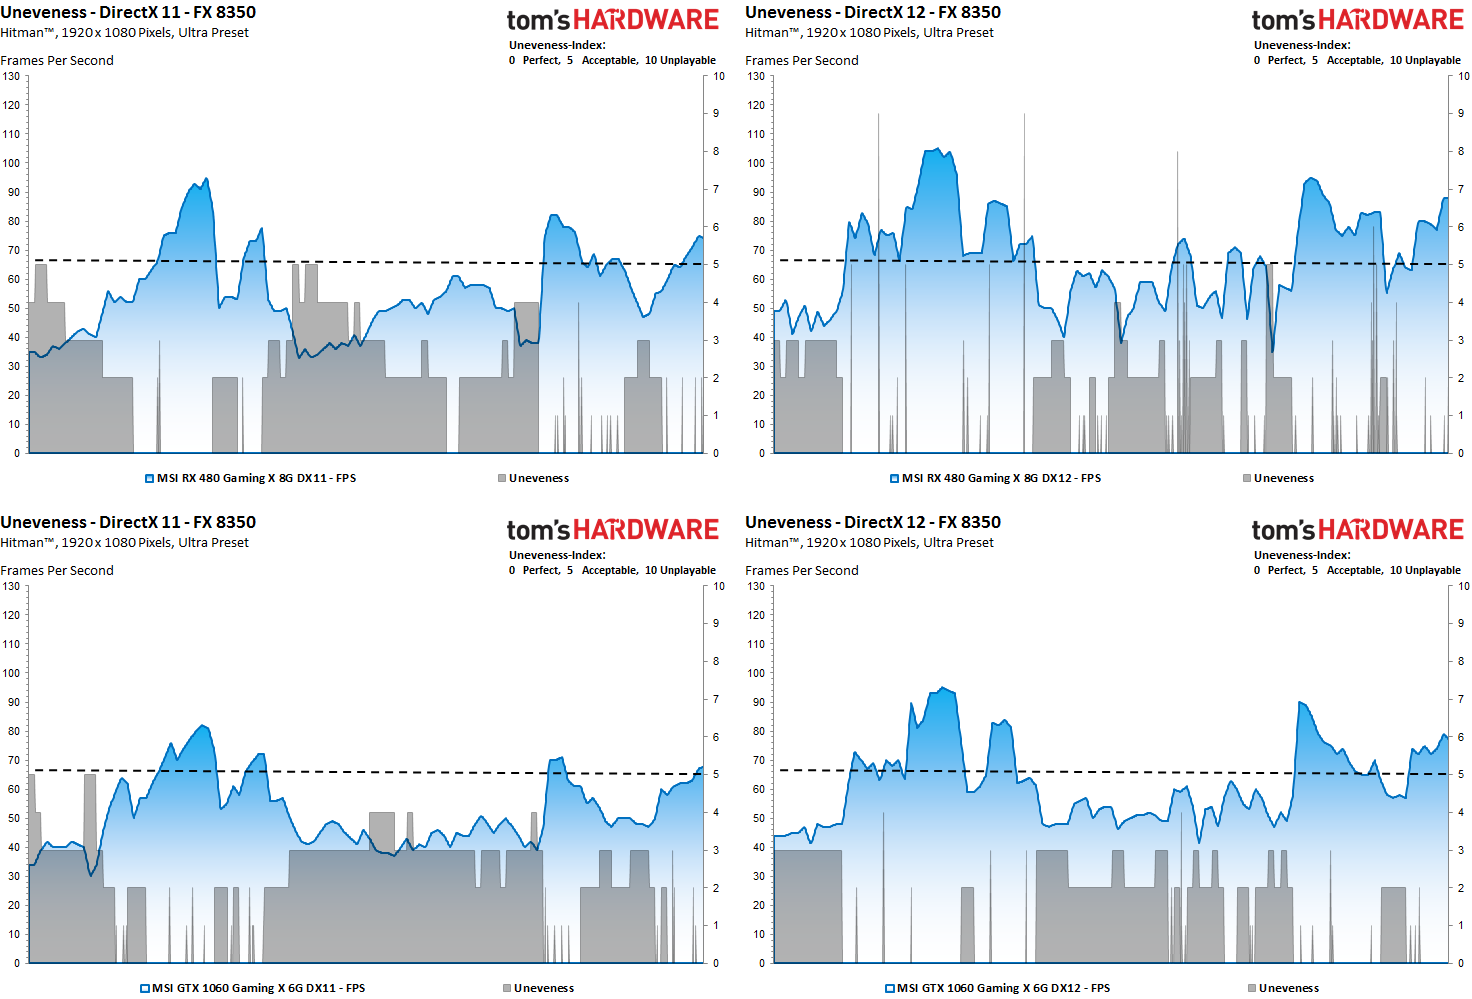
With all of those calculations complete, we end up with a subjective integer-based "Stuttering/Uneveness index," free from fractional values. This rating ranges from a score of zero (perfect, no interfering influences) to a score of five (the limit of acceptance) up to level 10 (real stuttering and dropped frames). The most sensitive enthusiasts will perceive micro-stuttering at a score of three or four.
In the chart above, a faster CPU helps maintain fairly smooth playback, though the Radeon RX 480 struggles under DirectX 12 with some visible stuttering.
This becomes even clearer under the power of a lower-end CPU. Although the GeForce isn't as fast, it does facilitate a smoother-looking picture.
MORE: Best Graphics Cards
MORE: Desktop GPU Performance Hierarchy Table
MORE: All Graphics Content
Current page: Performance Versus Smoothness
Prev Page Frames Per Second: Bars Or Curves? Next Page Even More Data To Evaluate
Igor Wallossek wrote a wide variety of hardware articles for Tom's Hardware, with a strong focus on technical analysis and in-depth reviews. His contributions have spanned a broad spectrum of PC components, including GPUs, CPUs, workstations, and PC builds. His insightful articles provide readers with detailed knowledge to make informed decisions in the ever-evolving tech landscape
-
godfather666 Great stuff. I hope Directx 12's disappointing performance is a Hitman-specific problem.Reply -
tomspown The title says "Performance In DirectX, OpenGL, And Vulkan" am i missing pages or just going blind, i read the article then i skimmed through it twice and has nothing to do with Vulkan only power consumption at the end.Reply -
maddad Apologies to TOMSPOWN; Accidentally voted your comment down. I too really didn't get what this article was about.Reply -
jtd871 Igor, some of the charts mislabel the 1060 as the 480. Noticeable especially when the red and green coloring is used. Interesting stuff. I'm pleased to see you digging deeper with the data gathering, analysis and interpretation. It makes for more informed purchasing decisions.Reply -
neblogai This is great- a lot of important data is revealed when doing diligent analysis like this. I have only two notices/questions:Reply
1) Is CPU load measured as total average of all cores, or maximum of a single most loaded core? Single cores at 100% might explain some of the slow frames-it would be great to have a graph with those two together.
2) In the forum when people ask for builds, or about bottlenecks, they rarely tell what monitor, resolution, adaptive or fixed frame rate will be used. Similarly here- article could make note of available monitor technology. Frame times will get a special treatment on most popular- 60Hz fixed refresh rate without VSync, making actual frame times, and user experience completely different than can be expected from frame-time graphs here. Monitors with adaptive sync can also change frame-times, as well as their functions like Low Frame Compensation. It would be great if this was taken into account by few extra tests, or at least by giving notice with links to explanation of frame-time effect on different types and abilities of monitors. That would make it a full picture, and an excellent guide for intelligent purchase decision. -
blazorthon When it comes to digging deep into the numbers for performance, Tom's tends to be ahead of the crowd and this just brings that margin up further. Excellent read.Reply
@TOMSPOWN and MADDAD:
The techniques and software used in this article is compatible with Vulkan, that is the point they were making related to Vulkan. Unlike Fraps, what they're doing now is compatible with more than just DX11, in fact it's apparently compatible with all of the graphics APIs we care about, which makes testing both more accurate and easier for them to manage. -
FormatC @tomspownReply
The translated title is a little bit misleading, I agree. The exact translation of the original title is:
THDE internally: How we measure and evaluate the graphics performance
Just for interest:
Our interpreter also works with OCAT (AMDs free GUI for PresentMon) and FCAT (in all versions).
@jtd871:
Which chart? I can't find it. -
chimera201 ^ Both charts in 'Performance Versus Smoothness' -> 'Frame Rate Versus Frame Time Difference' has the bottom left chart with RX 480 label.Reply
Are you going to make game bench articles with this? Haven't seen any game benches on TH lately. -
jtd871 @FormatCReply
Under "Frame Rate Versus Frame Time Difference", 3rd page. I am presuming that the red chart is for the 480, the green for the 1060. Some of the green charts are labeled as the 480 card. -
erad84 The TechReport's 99th percentile frame time graphs are a great way to summarise how smooth or not a cards results are.Reply
Their frames spent beyond X fram time bar graphs help convey this too.
You article is good and the graphs are nice but I think TechReports graph ideas are the best I've seen for performance smoothness summaries. Plus they're easier to understand and glean info from at a glance as they're simpler to look at.


