PresentMon: Performance In DirectX, OpenGL, And Vulkan
PresentMon And Our Proprietary Software
The introduction of DirectX 12, Microsoft's Universal Windows Platform, and Vulkan presented us with a problem: we no longer had a reliable tool for measuring performance. Fraps only works up through DirectX 11, and it's not always as reliable as some enthusiasts assume.
Consequently, the timing of Andrew Lauritzen's PresentMon tool, freely available on GitHub, was ideal. It monitors Windows' event tracing stack for present commands and records a bunch of information about them to a CSV file for analysis.
But PresentMon is subject to its own technical limitations, since it operates at the same place in the graphics pipeline as Fraps. Thus, it doesn't completely replace tools like FCAT in our repertoire. But what makes PresentMon so interesting to us is its compatibility with not only DirectX 11, but also DX 12, OpenGL, and Vulkan.
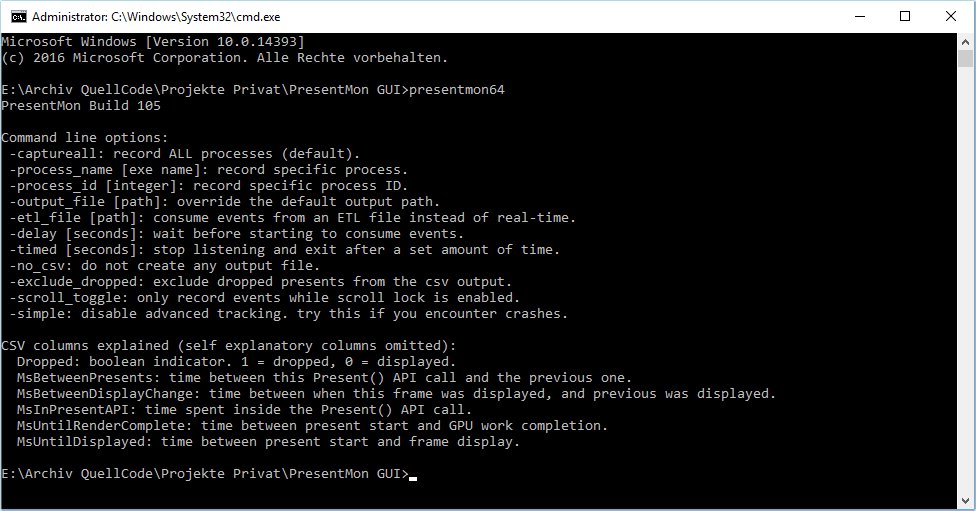
The tool's most significant disadvantage is its command-line interface. It can be time-consuming to figure out the right combination of switches to use in order to generate the information you need. By default, it's not set up to simply spit out the data you'd necessarily expect. And that's what we set out to solve.
Detection Made Easy: The PresentMon GUI
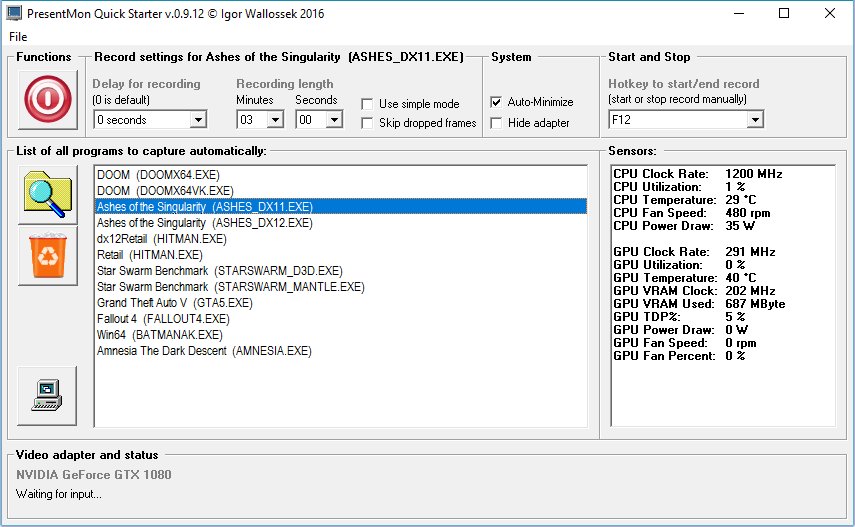
We made the decision to develop an app that would start PresentMon, control its switches, and collect sensor data at the same time as performance was being recorded.
In the screenshot above we have a number of frequently benchmarked games, each with its own profile stored in our tool. PresentMon uses the chosen parameters for each, depending on how it was set up. One test might run for three minutes and then stop, for example, while another is started and stopped with a hotkey.
Data Collection Made Easy
Of course, PresentMon isn't set up to collect sensor data as it records performance information. That capability comes from FinalWire's AIDA64. We tap into the engineering version, synchronously recording a number of host processing and graphics statistics. Do you want to correlate GPU utilization with frame rate at a certain point in a test? That's possible. Latency and overhead are kept to a minimum, as AIDA64's approach is different from tools like HWiNFO that use a DLL for their interface.
Get Tom's Hardware's best news and in-depth reviews, straight to your inbox.
In order to minimize the impact of storage I/O, we write this second log file to memory first (it's small enough, after all), and then to disk once PresentMon's log file closes.
Since PresentMon doesn't use a time stamp, unfortunately, we put the beginning of our own records first, then PresentMon's log, and track time between them in parallel. This is necessary for controlling external measurements (like our oscilloscopes).
Analyzing The Data And Processing It For Presentation
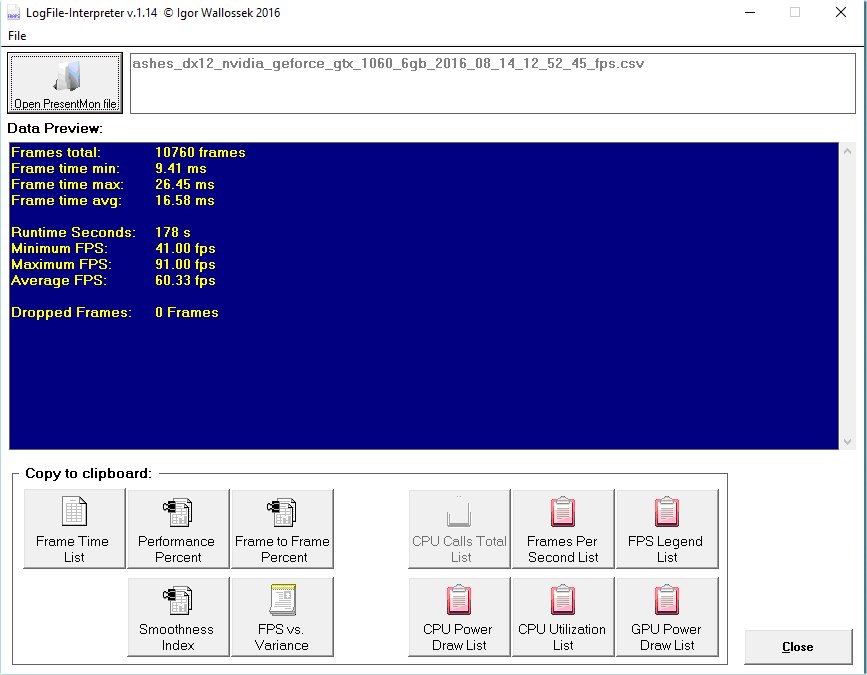
All of our recordings result in an enormous pile of data for every benchmark run, which has to be sorted through. To help with this, we use another proprietary piece of software that combines the two log files and applies all of the math needed for our charts. It simply wouldn't be possible to do this manually in Excel due to the complexity and number of steps involved.
With our log file interpreter now in its third generation, we can run the calculations we need quickly, and even add new charts/graphs as needed. We'll get more in-depth on what we evaluate directly with an example using two different graphics cards and a DirectX 12 game.
Our purpose here is to help explain the information we're generating. Without a thorough understanding of what the charts are saying, it's sometimes possible to draw the wrong conclusion. Thus, you'll see us point to this piece in future reviews to ensure our processes and procedures are fully detailed.
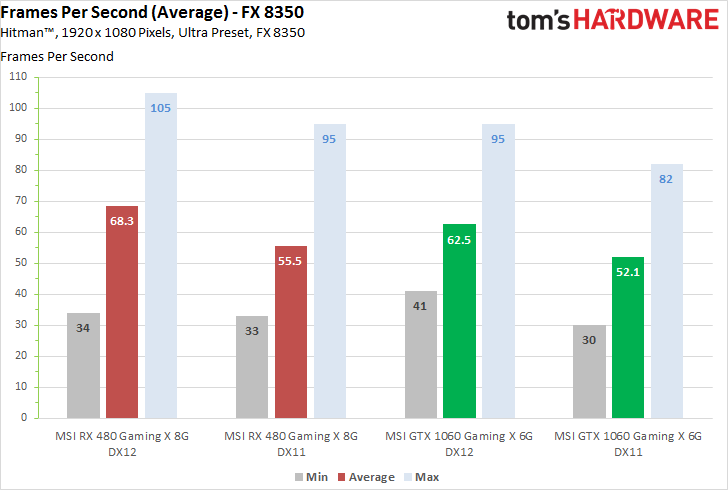
The bar chart above conveys minimum, maximum, and average FPS. These are important, but they tell us nothing about the perceived smoothness of a gaming experience, nor do they give us a more granular look into frame consistency. In order to present that information, we need more data.
Two Cards, Two Test Systems, And One Benchmark
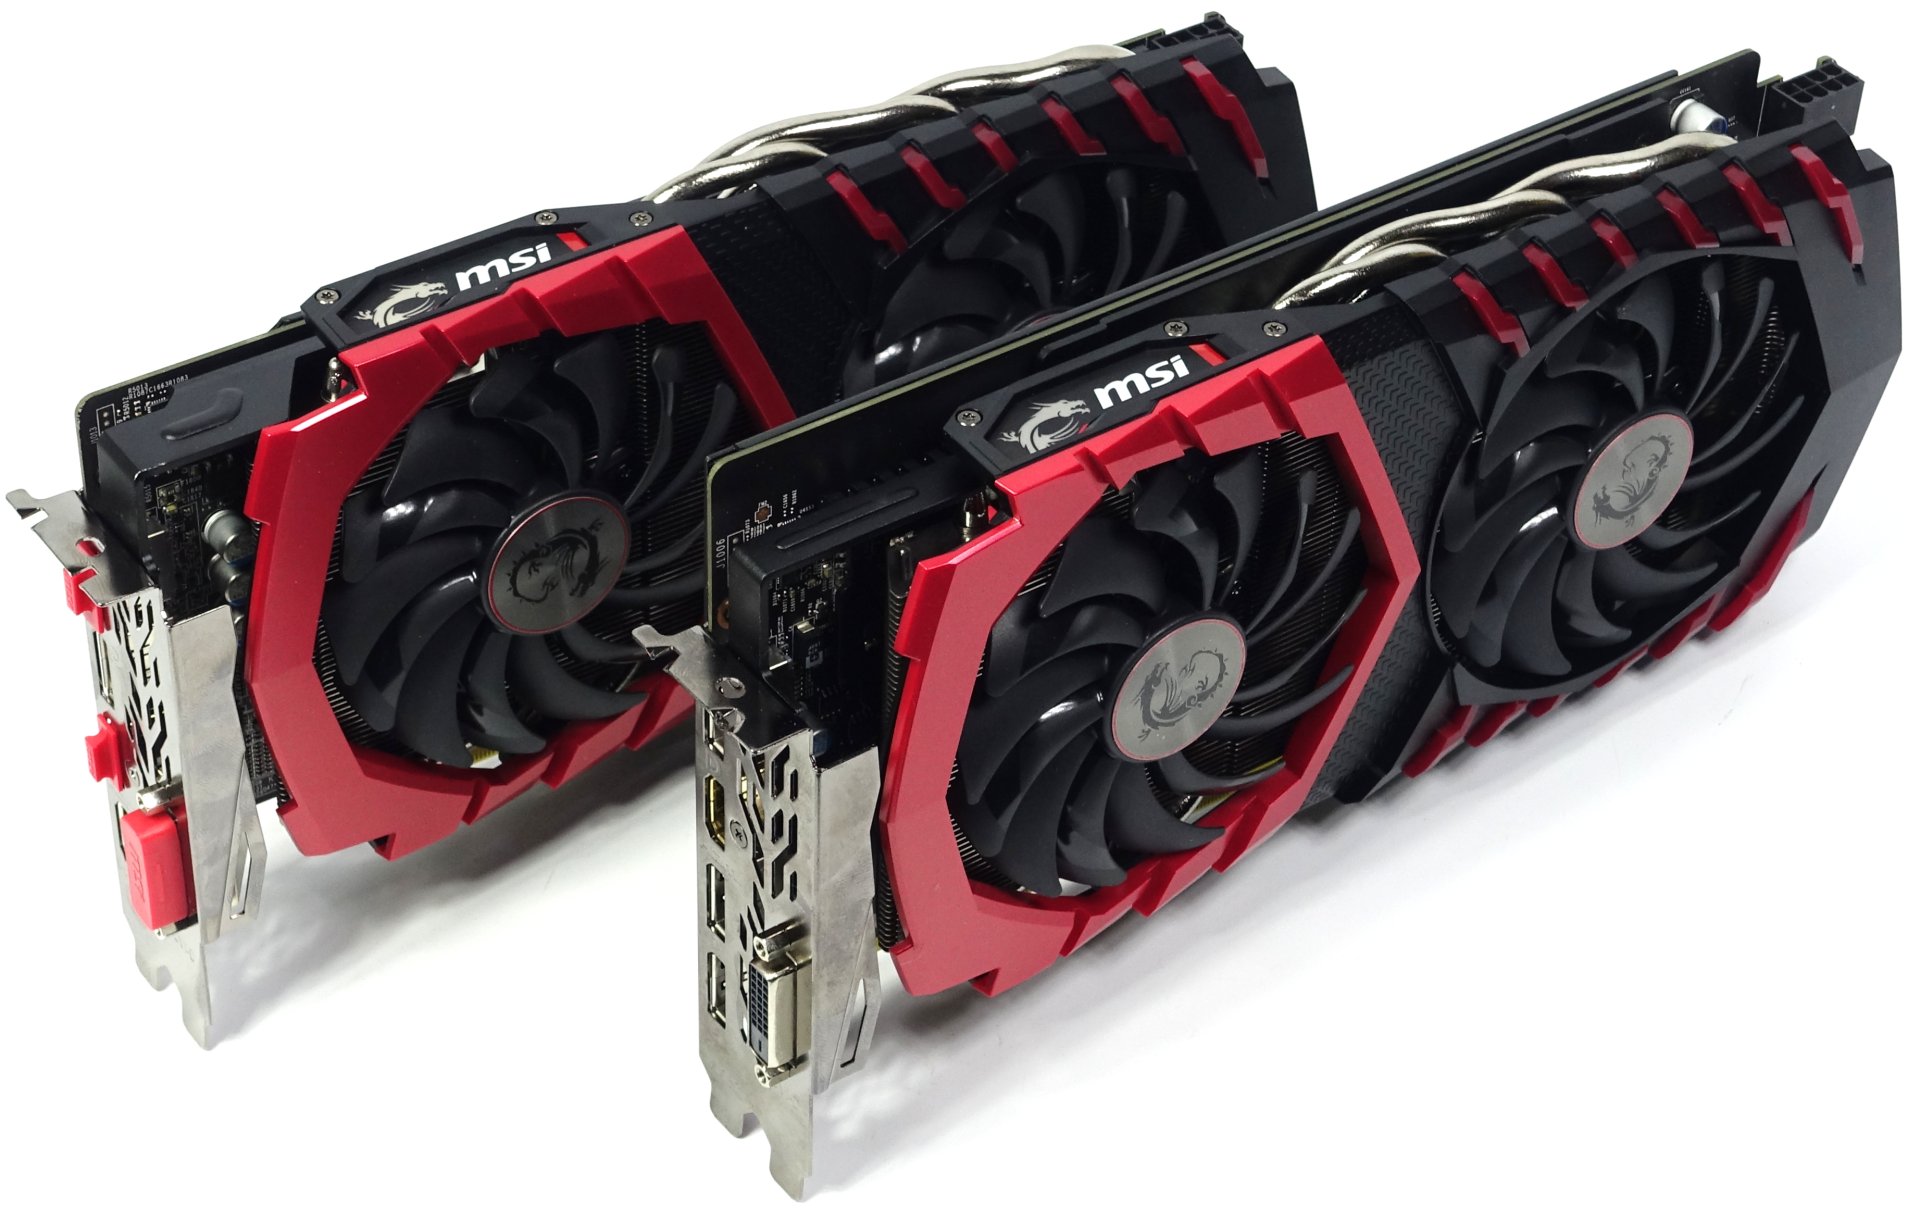
This example isn't intended to compare MSI's GeForce GTX 1060 Gaming X 6G to its Radeon RX 480 Gaming X 8G. Rather, we're using results from both cards to explain how we measure and evaluate.
Using a single benchmark simplifies the analysis. So we focus on Hitman, tested on both graphics cards using DirectX 11 and 12, and on two very different platforms.
| Header Cell - Column 0 | Enthusiast System | Mainstream PC |
|---|---|---|
| CPU | Intel Core i7-6950X @ 4.2 GHz | AMD FX-8350 @ 4 GHz |
| Cooling | Open-loop water-cooling | be quiet! Dark Rock Pro 3 |
| Memory | 16 GB DDR4-3400 | 16 GB DDR3-1866 |
| Motherboard | MSI X99A Gaming Pro | MSI Gaming 970 |
| System Storage | 1TB Intel SSD 530 | |
| Operating System: | Windows 10 Build 1607 (10.0.14393.51) | |
| Graphics Driver | Crimson 16.8.2GeForce 372.54 WHQL |
MORE: Best Graphics Cards
MORE: Desktop GPU Performance Hierarchy Table
MORE: All Graphics Content
Current page: PresentMon And Our Proprietary Software
Next Page Frames Per Second: Bars Or Curves?
Igor Wallossek wrote a wide variety of hardware articles for Tom's Hardware, with a strong focus on technical analysis and in-depth reviews. His contributions have spanned a broad spectrum of PC components, including GPUs, CPUs, workstations, and PC builds. His insightful articles provide readers with detailed knowledge to make informed decisions in the ever-evolving tech landscape
-
godfather666 Great stuff. I hope Directx 12's disappointing performance is a Hitman-specific problem.Reply -
tomspown The title says "Performance In DirectX, OpenGL, And Vulkan" am i missing pages or just going blind, i read the article then i skimmed through it twice and has nothing to do with Vulkan only power consumption at the end.Reply -
maddad Apologies to TOMSPOWN; Accidentally voted your comment down. I too really didn't get what this article was about.Reply -
jtd871 Igor, some of the charts mislabel the 1060 as the 480. Noticeable especially when the red and green coloring is used. Interesting stuff. I'm pleased to see you digging deeper with the data gathering, analysis and interpretation. It makes for more informed purchasing decisions.Reply -
neblogai This is great- a lot of important data is revealed when doing diligent analysis like this. I have only two notices/questions:Reply
1) Is CPU load measured as total average of all cores, or maximum of a single most loaded core? Single cores at 100% might explain some of the slow frames-it would be great to have a graph with those two together.
2) In the forum when people ask for builds, or about bottlenecks, they rarely tell what monitor, resolution, adaptive or fixed frame rate will be used. Similarly here- article could make note of available monitor technology. Frame times will get a special treatment on most popular- 60Hz fixed refresh rate without VSync, making actual frame times, and user experience completely different than can be expected from frame-time graphs here. Monitors with adaptive sync can also change frame-times, as well as their functions like Low Frame Compensation. It would be great if this was taken into account by few extra tests, or at least by giving notice with links to explanation of frame-time effect on different types and abilities of monitors. That would make it a full picture, and an excellent guide for intelligent purchase decision. -
blazorthon When it comes to digging deep into the numbers for performance, Tom's tends to be ahead of the crowd and this just brings that margin up further. Excellent read.Reply
@TOMSPOWN and MADDAD:
The techniques and software used in this article is compatible with Vulkan, that is the point they were making related to Vulkan. Unlike Fraps, what they're doing now is compatible with more than just DX11, in fact it's apparently compatible with all of the graphics APIs we care about, which makes testing both more accurate and easier for them to manage. -
FormatC @tomspownReply
The translated title is a little bit misleading, I agree. The exact translation of the original title is:
THDE internally: How we measure and evaluate the graphics performance
Just for interest:
Our interpreter also works with OCAT (AMDs free GUI for PresentMon) and FCAT (in all versions).
@jtd871:
Which chart? I can't find it. -
chimera201 ^ Both charts in 'Performance Versus Smoothness' -> 'Frame Rate Versus Frame Time Difference' has the bottom left chart with RX 480 label.Reply
Are you going to make game bench articles with this? Haven't seen any game benches on TH lately. -
jtd871 @FormatCReply
Under "Frame Rate Versus Frame Time Difference", 3rd page. I am presuming that the red chart is for the 480, the green for the 1060. Some of the green charts are labeled as the 480 card. -
erad84 The TechReport's 99th percentile frame time graphs are a great way to summarise how smooth or not a cards results are.Reply
Their frames spent beyond X fram time bar graphs help convey this too.
You article is good and the graphs are nice but I think TechReports graph ideas are the best I've seen for performance smoothness summaries. Plus they're easier to understand and glean info from at a glance as they're simpler to look at.
