Radeon RX 590 Review: AMD’s First 12nm GPU Hits 225W
Why you can trust Tom's Hardware
Temperatures, Clock Rates, and Infrared Measurements
Although the card’s clock rates on an open test bench look good, they break down once we install XFX's Radeon RX 590 Fatboy 8GB OC+ in a closed case. Our charts make it easy to see the connection between frequency and temperature in a real-world gaming sequence and FurMark.
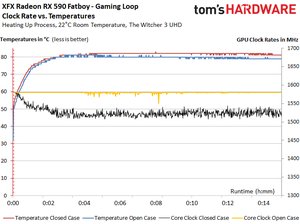
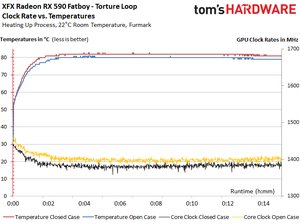
For the power consumption we measured, XFX’s cooler really does seem to be a limiting factor. Something larger (and quieter) would have certainly helped. To be sure, a constant 1580 MHz is only possible in a really well-ventilated case.
Here’s what our results look like in table form:
| Header Cell - Column 0 | Initial Value | Final Value |
|---|---|---|
| Open Test Bench | ||
| GPU Temperature | 32°C | 80°C |
| GPU Clock Rate | 1580 MHz | 1580 MHz |
| Room Temperature | 22°C | 22°C |
| Closed Case | ||
| GPU Temperature | 33°C | 82-83°C |
| GPU Clock Rate | 1580 MHz | 1527 MHz |
| Temperature Inside of Case | 25°C | 45°C |
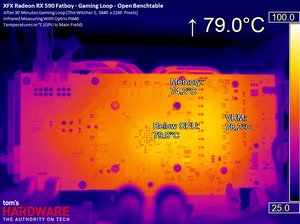
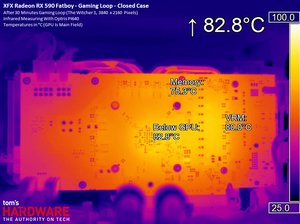
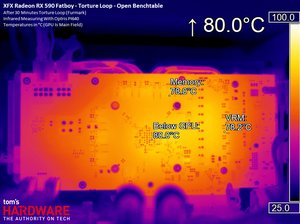
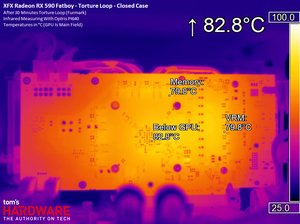
The following images include infrared measurements from our gaming and FurMark loops, both on an open test bench and in a closed case. Differences between the two environments are readily apparent, especially since the cooler is operating at its upper limit.
Temperatures During Gaming
Temperatures During FurMark
MORE: Best Graphics Cards
MORE: Desktop GPU Performance Hierarchy Table
MORE: All Graphics Content
Get Tom's Hardware's best news and in-depth reviews, straight to your inbox.
Current page: Temperatures, Clock Rates, and Infrared Measurements
Prev Page Power Consumption Next Page Fans and Noise-
shrapnel_indie The further cut-down Vega sounds like it could have been a better option to me, primarily if they could make it work with GDDR5, GDDR5X, or GDDR6 memory.Reply -
elbert Wonder if we will see a RX 590X in a month or 2. Higher bin chips passing this overclock and with say GDDR5x 9GB memory.Reply -
v71 A conclusion & a possible editorial mistake:Reply
1. A used GTX 1070 for slightly over $200 is a better value today for 2k gaming.
2. It seems that in GTA V & Metro the slides were mislabled - the 1080p were placed under 2k and viceversa. Look at the presented framerates in those two games & you'll see that 1080p results are worse than 2k;) -
tslot05qsljgo9ed I hope you are joking because this RX 590 is the already the higher bin chips.Reply -
cangelini Reply21488265 said:A conclusion & a possible editorial mistake:
1. A used GTX 1070 for slightly over $200 is a better value today for 2k gaming.
2. It seems that in GTA V & Metro the slides were mislabled - the 1080p were placed under 2k and viceversa. Look at the presented framerates in those two games & you'll see that 1080p results are worse than 2k;)
Good eye! :)
The perf difference is actually from turning off SSAA at 2560x1440 in Metro and disabling 4xAA at 2560x1440 in GTAV as we try to keep QHD a playable resolution. Maintaining the same quality settings would have hit that res too hard. -
mohit9206 238W of power while gaming? That is unacceptable. 7nm cards can't come soon enough for AMD.Reply -
hannibal Reply21488220 said:The further cut-down Vega sounds like it could have been a better option to me, primarily if they could make it work with GDDR5, GDDR5X, or GDDR6 memory.
Yep, but that would require complete remaking that chip. Well Hopefully good Ryzen selling Numbers give money Also to gpu department so that They can afford to completely rehaul their low end and middle range cards. Even this 12nm with that 7.5 library would offer good gains if paineen with refress in architecture. But that remain to later timeframe. New card will require a couple of years, so if and because the company is in right track, one or two years From now there will be improvements if They start now the developmening it. -
mohit9206 Quote from anandtech reviewReply
"Once again though, we've observed that VRAM is never enough. It was only a few years ago that 8GB of VRAM was considered excessive, only useful for 4K. But especially with the popularity of HD texture packs, even 6GB of framebuffer could prove limiting at 1080p with graphically demanding games. In that respect, the RX 590's 8GB keeps it covered but also brings additional horsepower over the 8GB R9 390. For memoryhogging games like Shadow of War, Wolfenstein II, or now Far Cry 5 (with HD textures), the 8GBs go a long way. Even at 1080p, GTX 980/970 performance in Wolfenstein II tanks because of the lack of framebuffer. For those looking to upgrade from 2GB or 4GB cards, both the RX 580 and RX 590 should be of interest."
So as you can see 480/580 and 590 do benefit from the extra vram even at 1080p. I do feel all those people who asked on various forums on whether to buy 4gb or 8gb and got recommended 4gb since they were playing at 1080p were wronged as just a year or two later games are now benefitting from larger than 4gb framebuffer. Now those people will have to upgrade their cards sooner rather than if they had 8gb model they would have been able to keep the card longer.The forums can sometimes give wrong advice to people and screw them over. -
AgentLozen AMD got some awful diminishing returns from overclocking a 580. I wonder if we would see better returns if they reconfigured the cores and ROPs instead of using a 580 as the foundation.Reply
I'm disappointed with the 14nm -> 12nm transition. It seems like it did nothing to help with power consumption or heat. I was hopeful because it was helpful in regards to AMD's Ryzen chips.
