Why you can trust Tom's Hardware
AMD Ryzen 9 7900X3D Power Consumption and Efficiency
| Header Cell - Column 0 | 65W TDP | 105W TDP | 120W TDP (X3D) | 170W TDP |
|---|---|---|---|---|
| Socket Power (PPT) Watts | 88W | 142W | 162W | 230W |
| Peak Current (EDC) Amps | 150A | 170A | 180A | 225A |
| Sustained Current (TDC) Amps | 75A | 110A | 120A | 160A |
AMD defined new TDP ranges with the debut of Zen 4 and the AM4 platform. All three Ryzen 7000X3D chips have their own new category — the 120W entry in the table above. This means the 7900X3D operates in a much lower power and thermal envelope than the standard Ryzen 9 7900X. That's evident in our power testing.
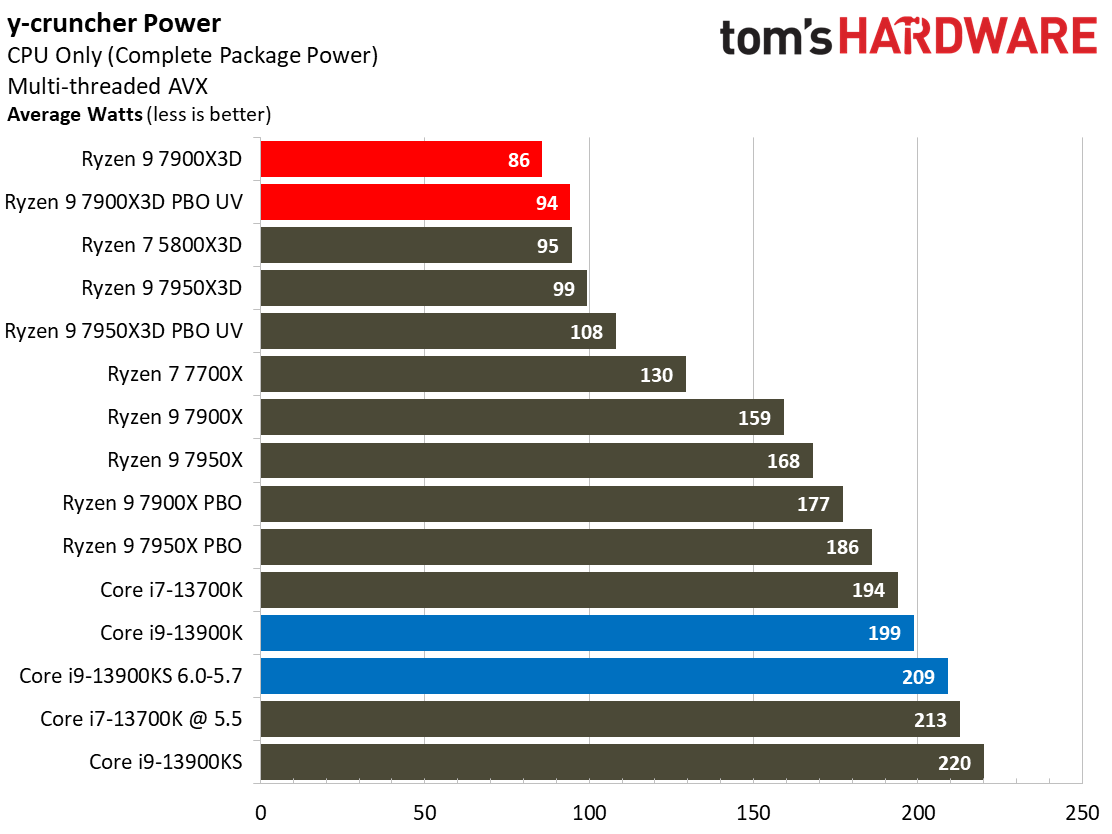
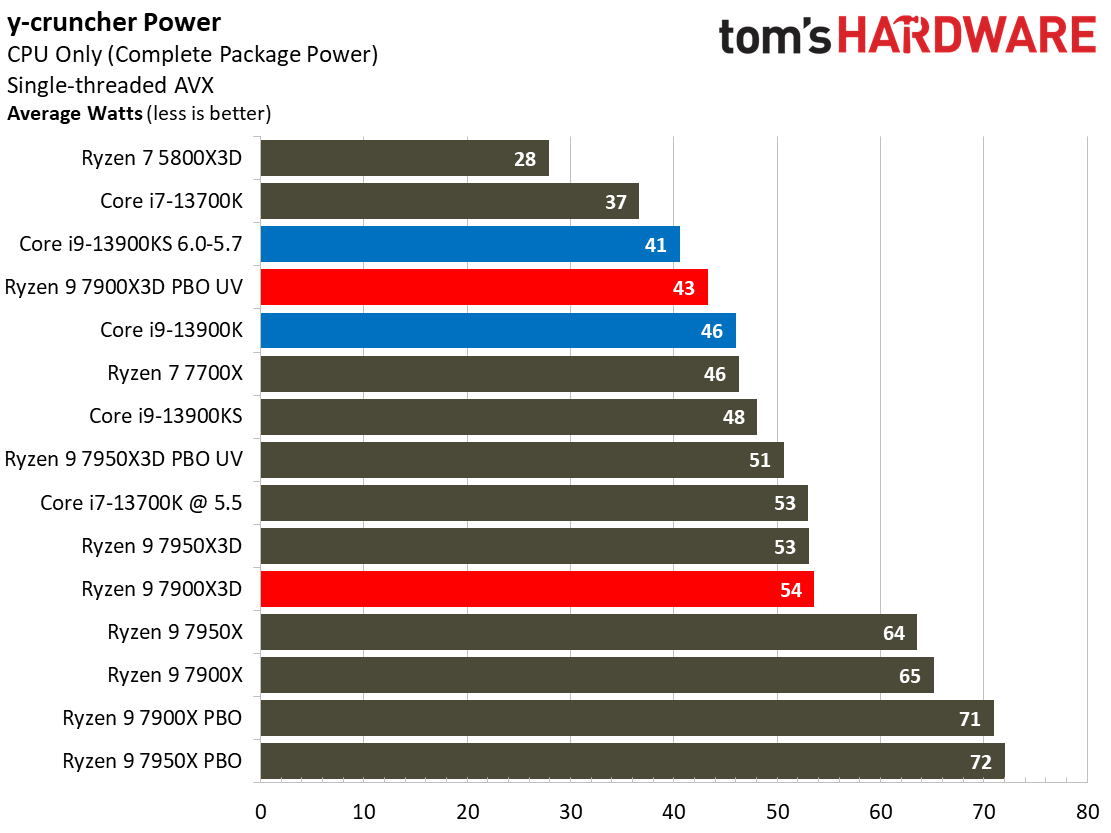
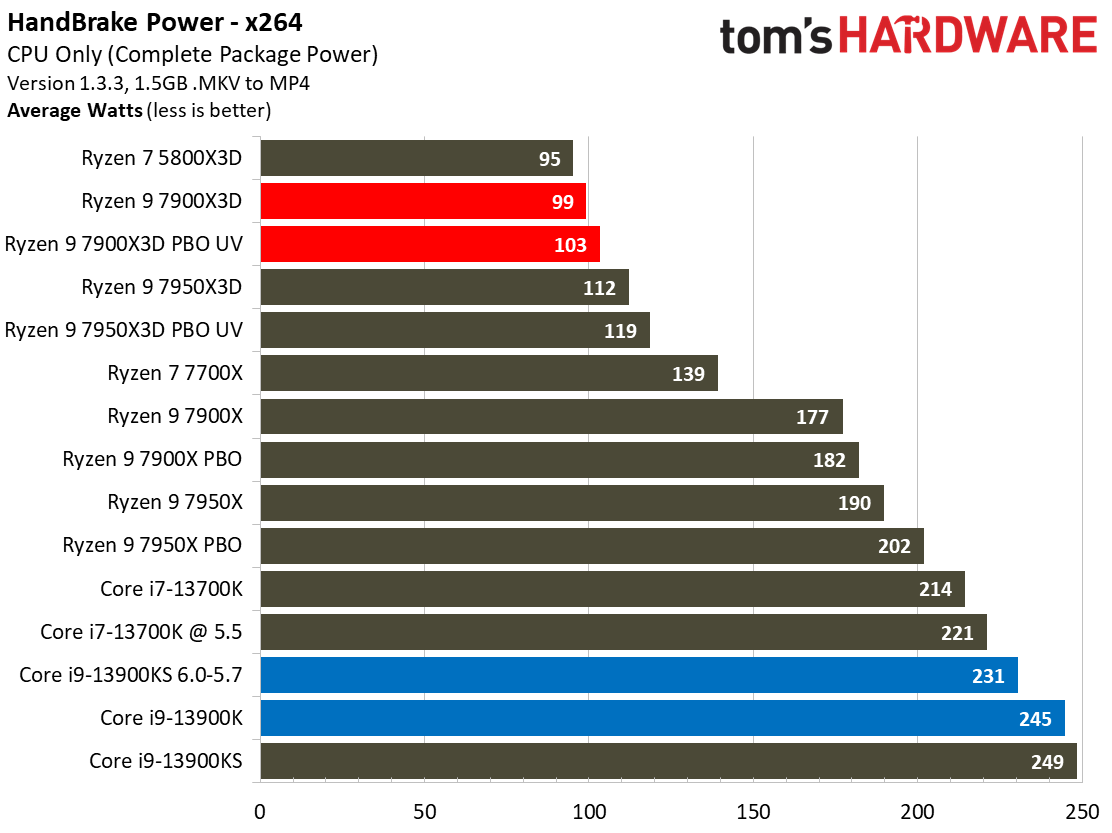
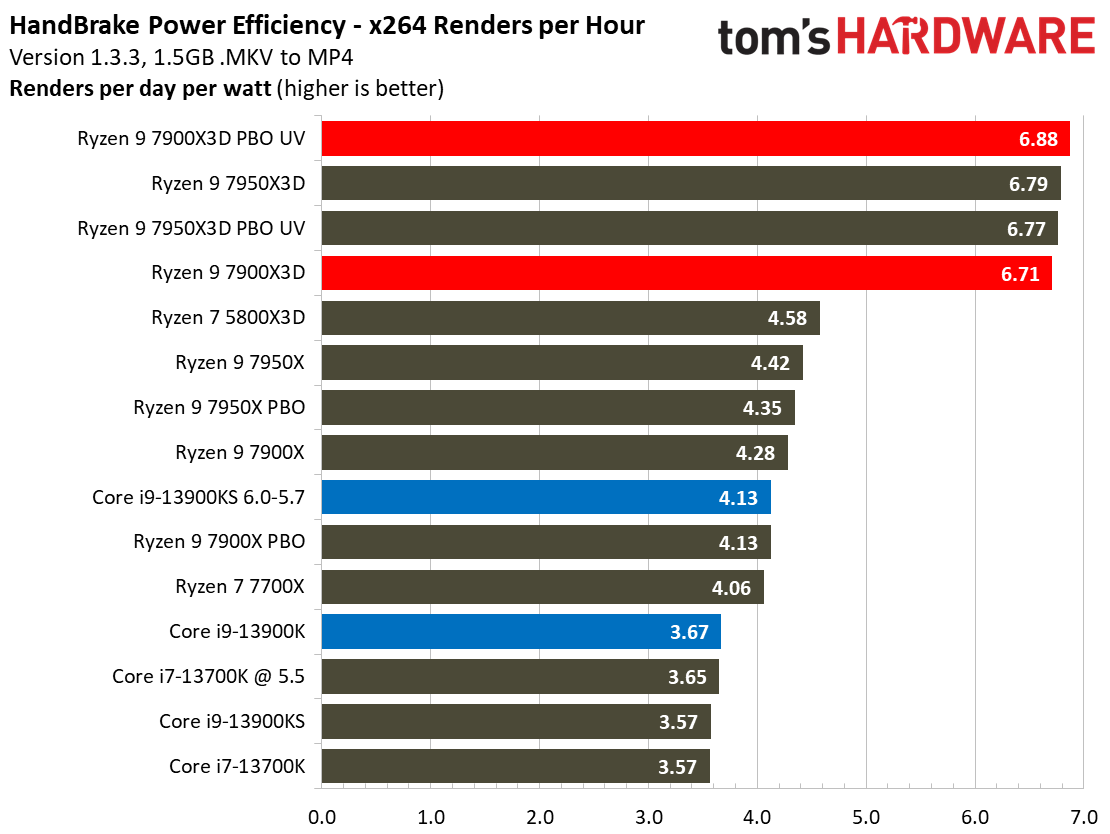
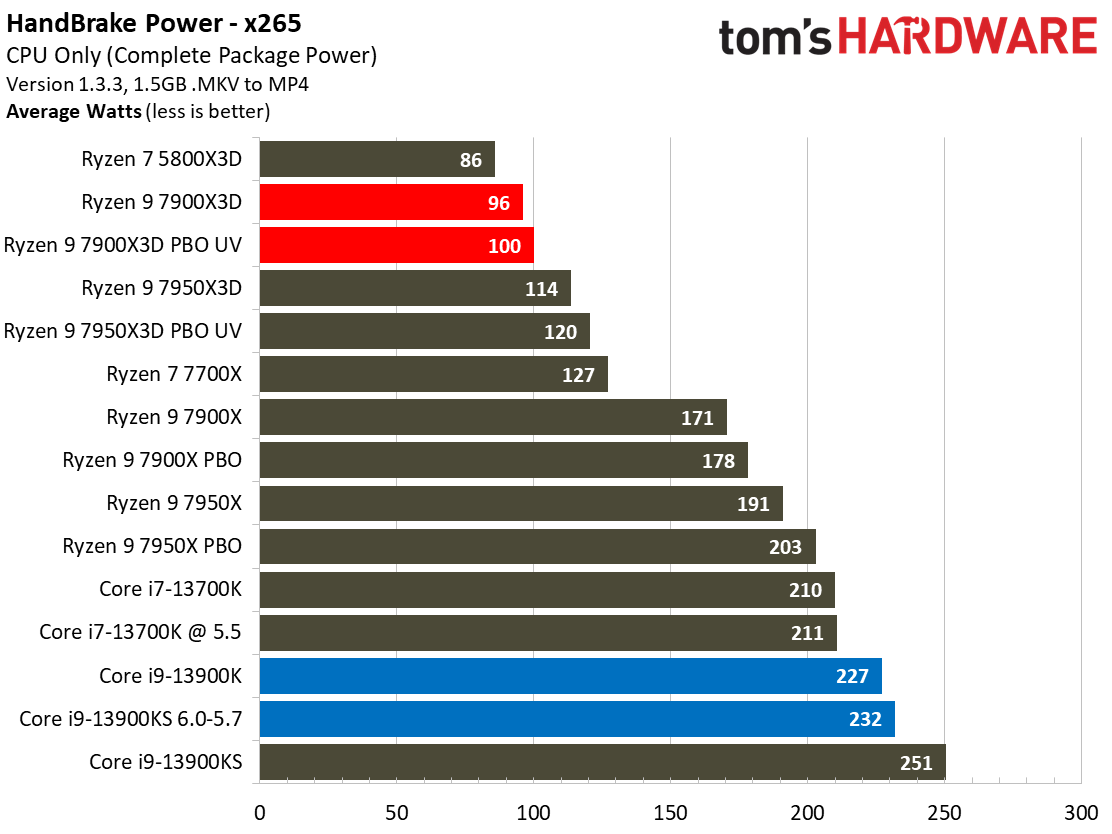
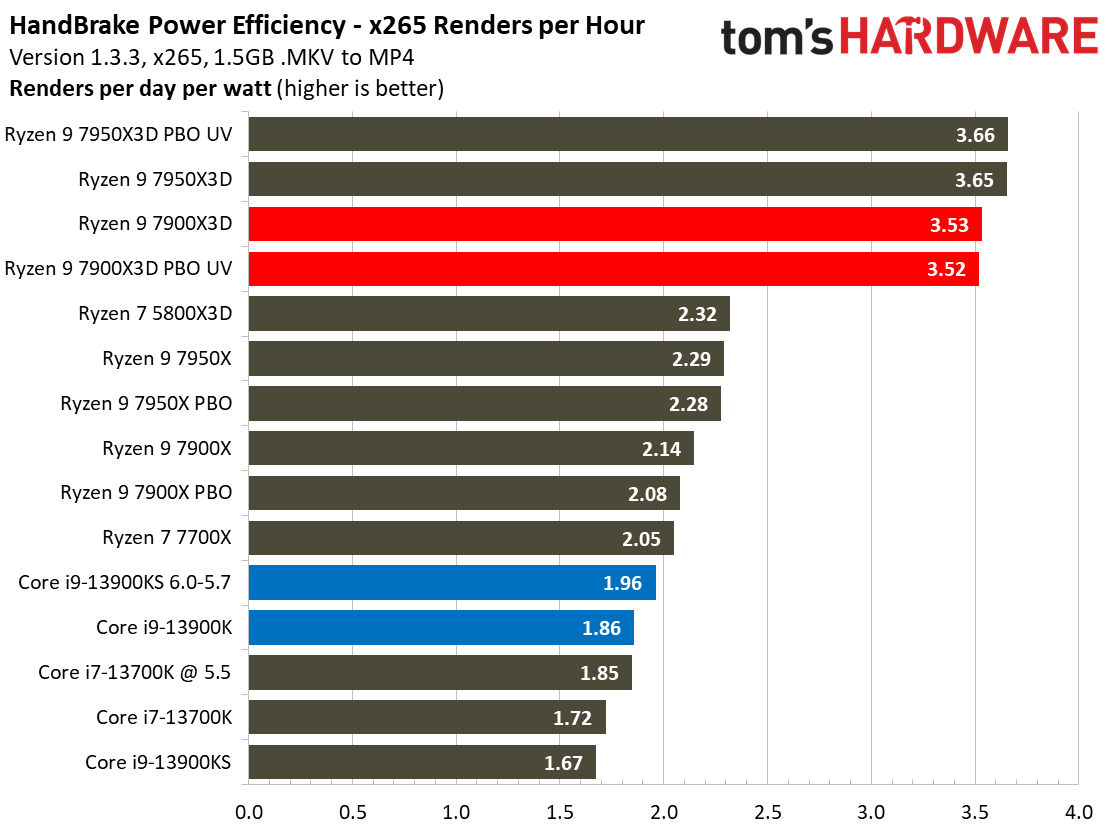
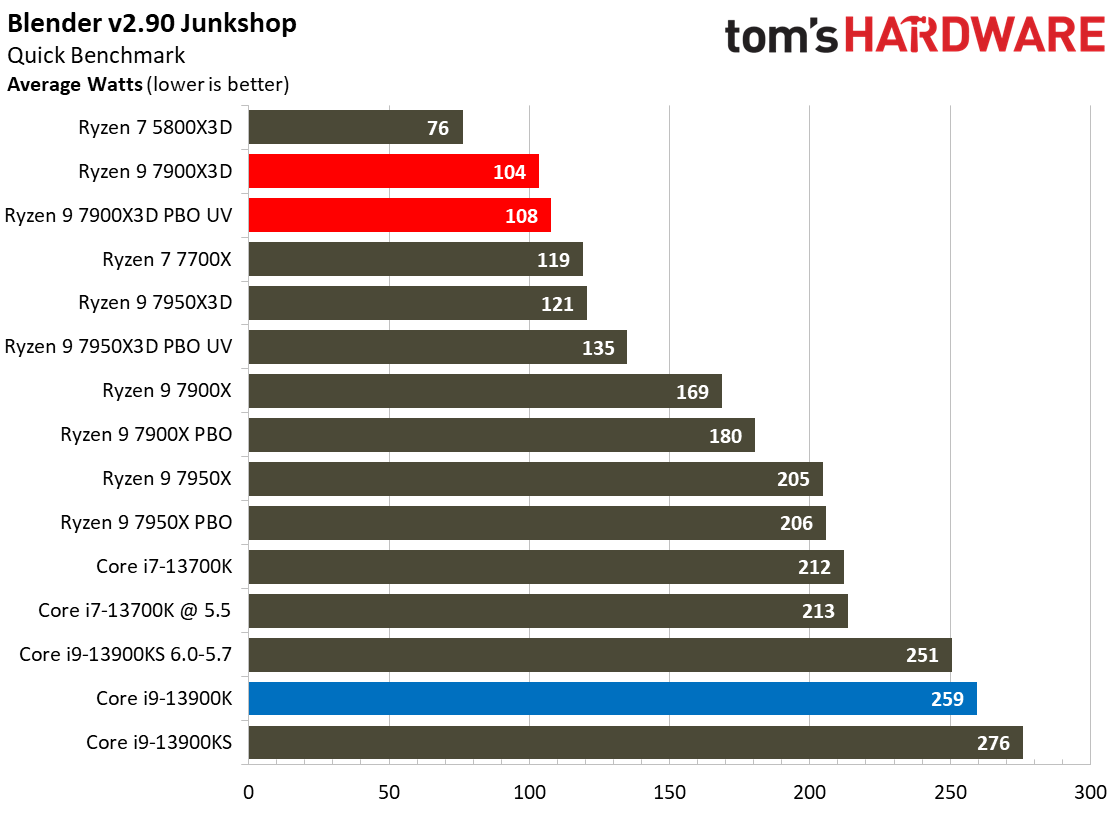
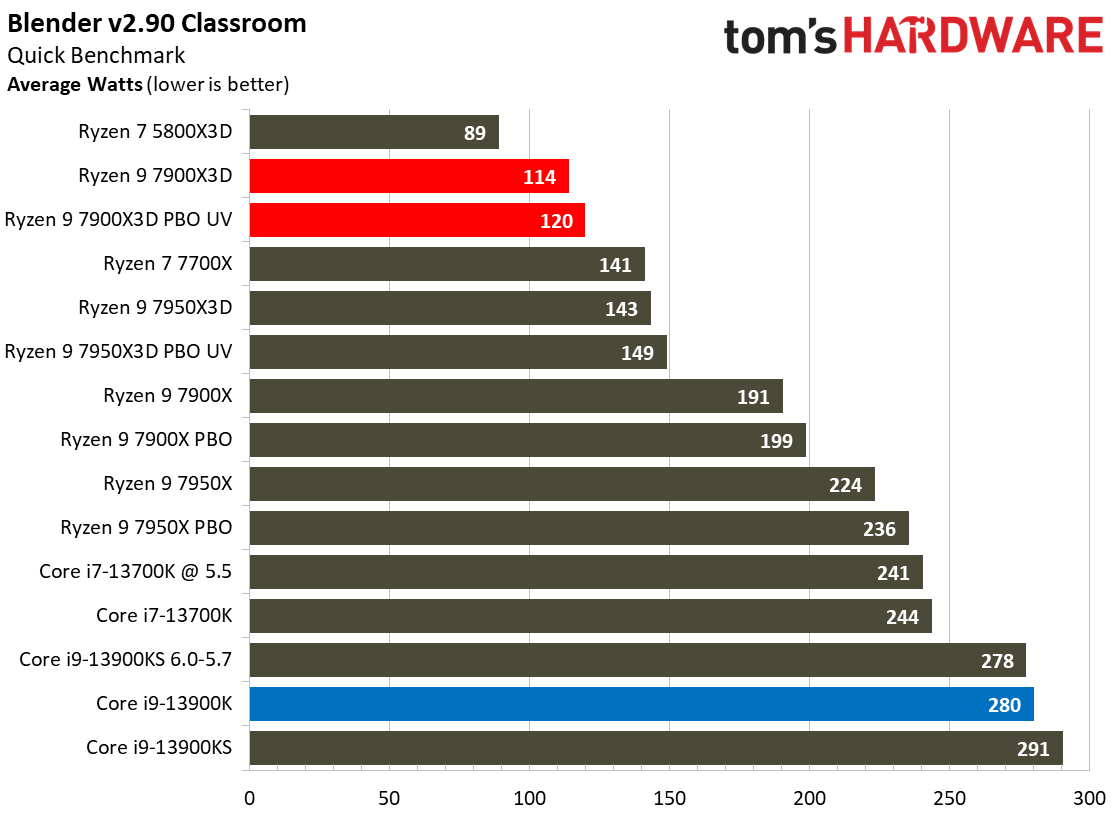
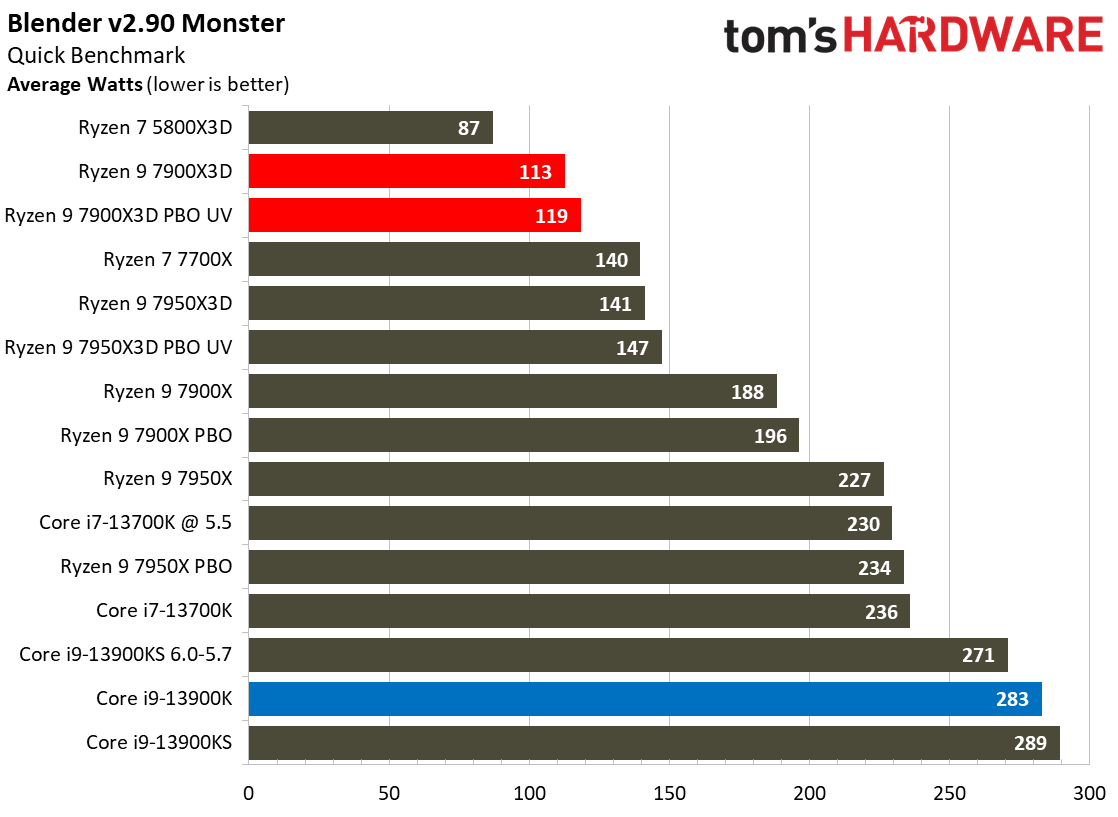
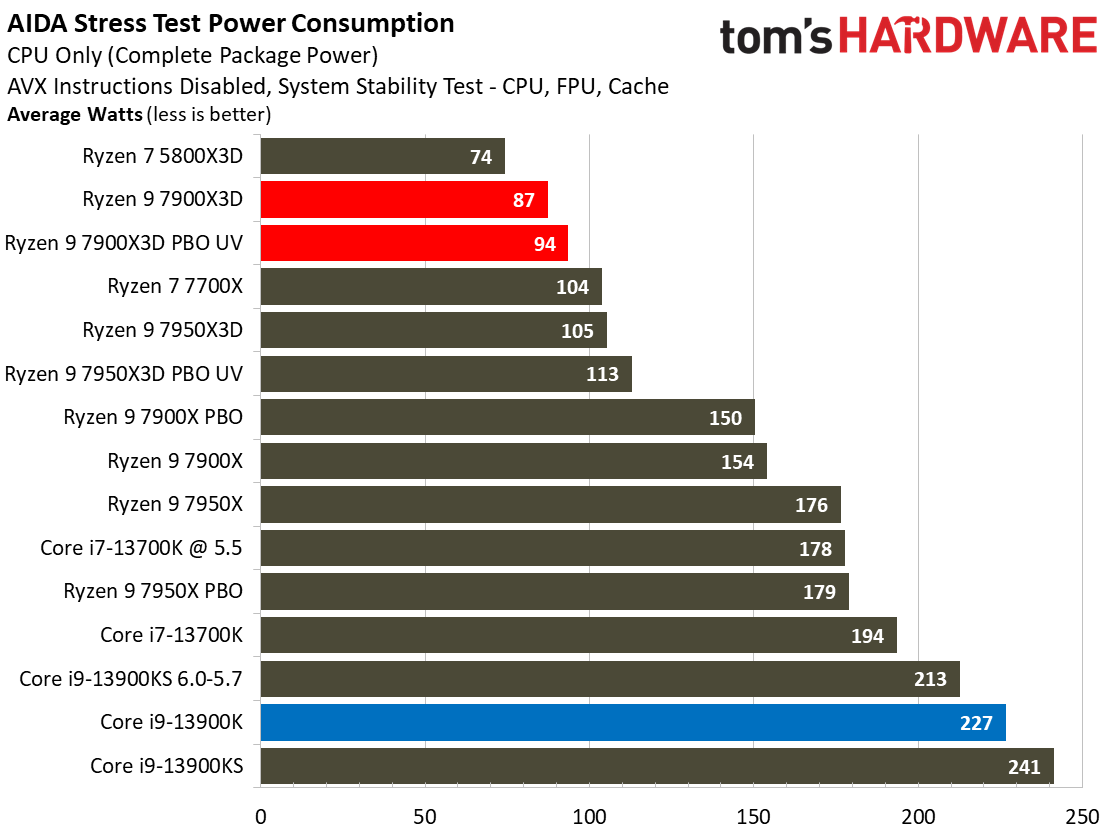
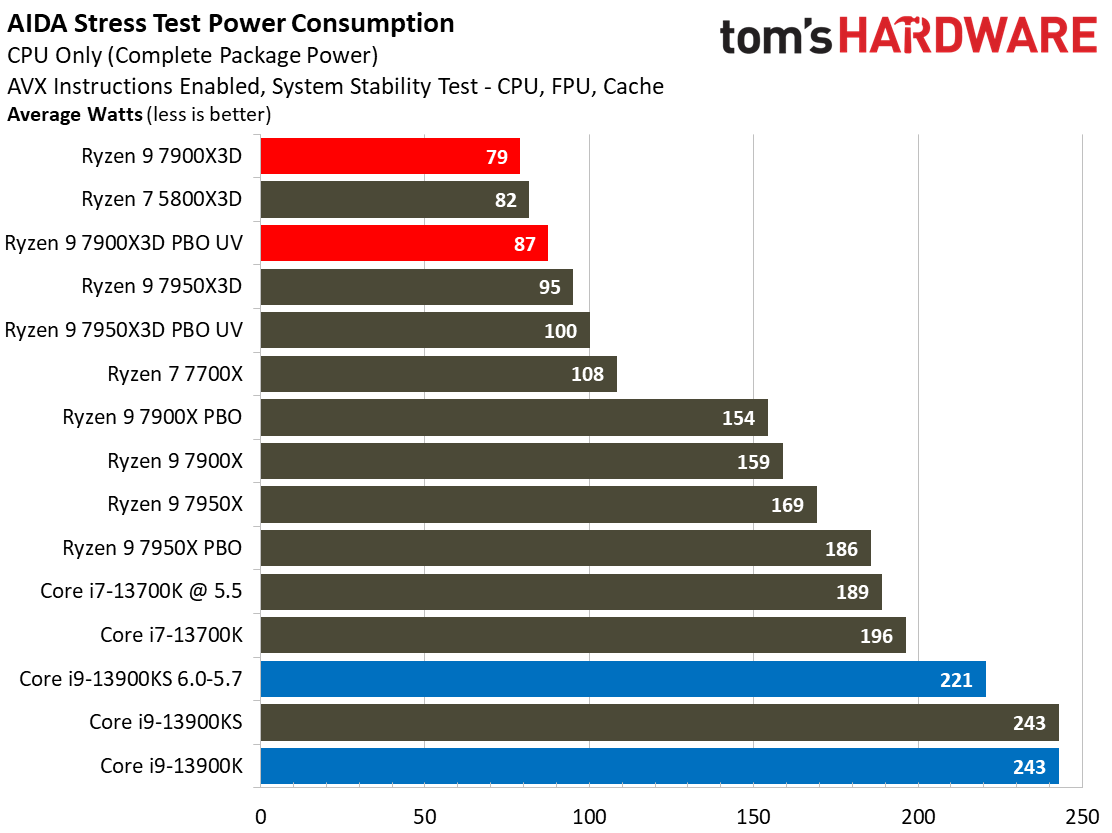
AMD's Ryzen chips have excellent power and efficiency metrics, but the Ryzen 9 7000X3D chips are even more efficient because they have a lower 120W TDP rating. This means the chip is similar to operating slightly above the 105W Eco Mode.
Ryzen’s Eco Mode allows you to downshift AMD processors into lower TDP envelopes with a single click in the BIOS or Ryzen Master software, thus yielding lower power consumption and heat. This also improves efficiency tremendously. We can see those same benefits reflected in the Handbrake renders-per-watt efficiency metric for the X3D chips. The 7900X3D and the 7950X3D top this chart by vast margins, each taking a slight lead in either the x264 or heavier x265 benchmarks.
Our highest average power measurement for the 7900X3D was 114W, showing that, like the Ryzen 9 7950X3D, it runs far below its official 162W peak power rating (PPT).
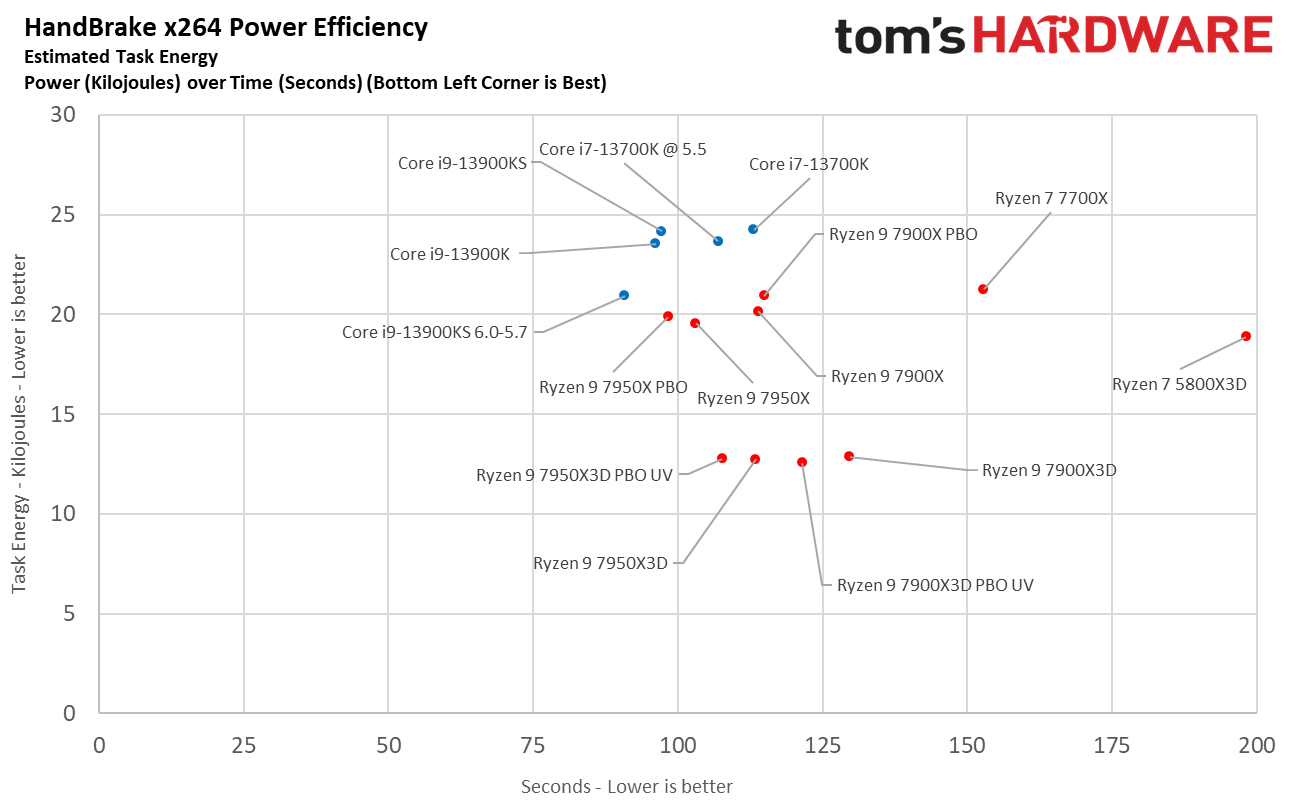
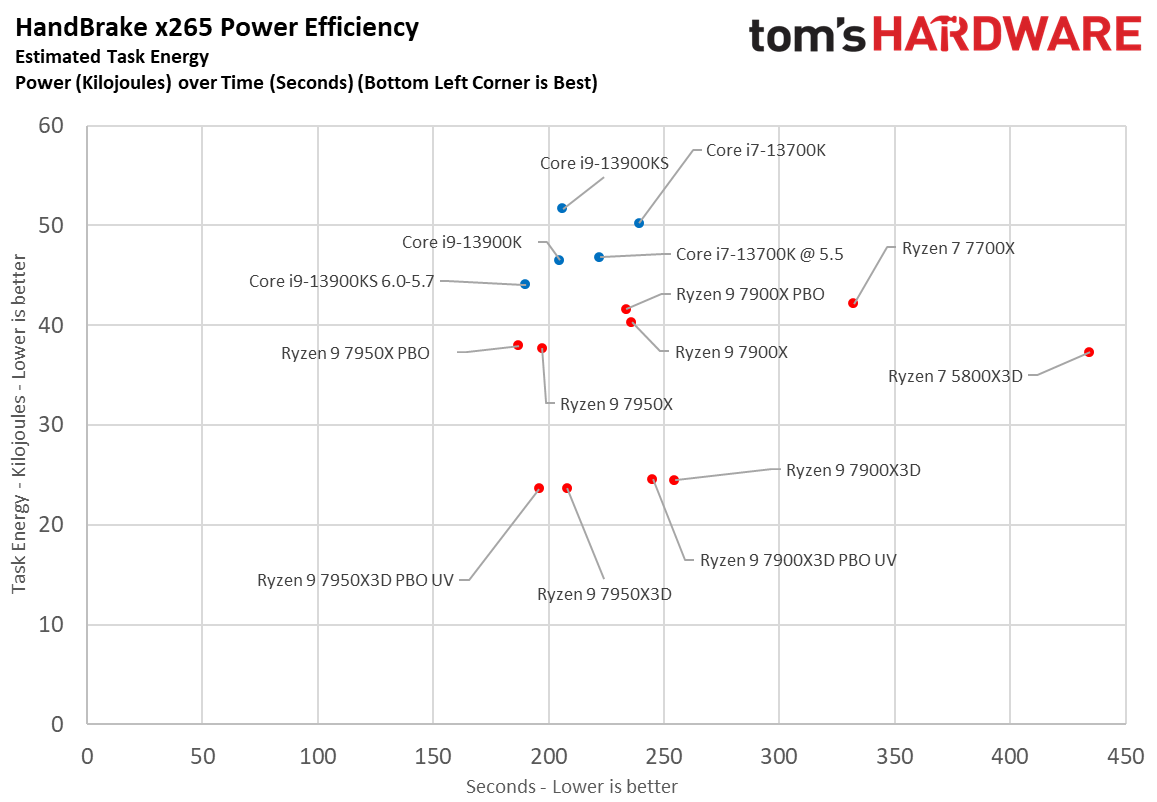
Here we take a slightly different look at power consumption by calculating the cumulative energy required to perform x264 and x265 HandBrake workloads, respectively. We plot this 'task energy' value in Kilojoules on the left side of the chart.
These workloads are comprised of a fixed amount of work, so we can plot the task energy against the time required to finish the job (bottom axis), thus generating a really useful power chart.
Bear in mind that faster compute times, and lower task energy requirements, are ideal. That means processors that fall the closest to the bottom left corner of the chart are the best. After the impressive performance in the renders-per-day power efficiency metric, it’s no surprise that the Ryzen 9 7000X3D chips deliver an excellent blend of power and performance. These chips consume far less cumulative energy than the others yet still deliver competitive performance.
Ryzen 9 7900X3D Benchmark Test Setup and Overclocking
- Ryzen 9 7900X3D: Corsair H115i 280mm water cooler, default power limits, DDR5-5200 (Coupled Mode)
- Ryzen 9 7900X3D PBO/UV: Corsair H115i 280mm water cooler, Precision Boost Overdrive (Advanced/Motherboard), Scalar 10X, -20 Curve Optimizer, DDR5-6000 EXPO (Coupled Mode), Silicon lottery and cooling performance impact overhead -- YMMV
Like the rest of its Ryzen 7000X3D siblings, the Ryzen 9 7950X3D doesn't support overclocking via the CPU multiplier, meaning you can't change the core clocks directly. AMD also doesn't allow direct CPU voltage adjustments.
However, there are a few other options, and they deliver worthwhile performance improvements with minimal effort. For example, AMD has added support for altering the power limits (PPT, TDC, EDC) through the auto-overclocking Precision Boost Overdrive (PBO) feature, which you can enable with a single click. You can also now undervolt the X3D chips using the Curve Optimizer that can be accessed either via the BIOS or Ryzen Master, with the latter also having a built-in auto-tuning feature that takes an hour to derive an optimum value.
These overclocking features weren’t supported on the previous-gen X3D models, and combining them (PBO+UV) provides the best overall performance. We have plenty of testing with PBO+UV settings on the following pages. Notably, the PBO+UV configuration delivers similar gaming performance to PBO but also larger gains in productivity applications, particularly in lightly threaded fare.
The Ryzen 9 7950X3D also supports overclocking the memory and Infinity Fabric. We used a DDR5-6000 EXPO profile for our overclocking testing, as this represents the sweet spot for Zen 4 processors. However, as we saw with the previous-gen Ryzen 7 5800X3D, memory overclocking does very little to improve performance. We demonstrated this in our 7950X3D review, and engaging the EXPO profile alone only gave us single-digit percentage improvements in gaming. However, using it with PBO and/or undervolting yields solid gains, so we used an EXPO memory profile in tandem with undervolting and PBO for our overclocked config.
We test Intel processors with the power limits fully removed for our standard measurements, so those chips run beyond the 'recommended' power settings but remain within warranty. We used DDR5 for both the Raptor Lake and Zen 4 processors.
Microsoft has advised gamers to disable several security features to boost gaming performance. As such, we disabled secure boot, virtualization support, and fTPM/PTT on all systems for maximum performance. You can find further hardware details in the table below.
| Intel Socket 1700 DDR5 (Z790) | Core i9-13900KS, Core i9-13900K, Core i7-13700K |
| Motherboard | MSI MPG Z790 Carbon WiFi |
| RAM | G.Skill Trident Z5 RGB DDR5-6800 - Stock: DDR5-5600 | OC: XMP DDR5-6800 |
| AMD Socket AM5 (X670E) | Ryzen 9 7950X3D, 7900X3D, 7950X, 7900X, Ryzen 7 7700X |
| Motherboard | ASRock X670E Taichi |
| RAM | G.Skill Trident Z5 Neo DDR5-6000 - Stock: DDR5-5200 | OC/PBO: DDR5-6000 |
| AMD Socket AM4 (X570) | Ryzen 9 5800X3D, 5800X, 5950X |
| Motherboard | MSI MEG X570 Godlike |
| RAM | 2x 8GB Trident Z Royal DDR4-3600 - Stock: DDR4-3200 | OC/PBO: DDR4-3800 |
| All Systems | 2TB Sabrent Rocket 4 Plus, Silverstone ST1100-TI, Open Benchtable, Arctic MX-4 TIM, Windows 11 Pro |
| Gaming GPU | Asus RTX 4090 ROG Strix OC |
| Application GPU | Nvidia GeForce RTX 2080 Ti FE |
| Cooling | Corsair H150i, Stock Cooler |
| Overclocking note | All configurations with overclocked memory also have tuned core frequencies and/or lifted power limits. |
- MORE: Best CPU for gaming
- MORE: CPU Benchmark Hierarchy
- MORE: Intel vs AMD
- MORE: How to Overclock a CPU
Get Tom's Hardware's best news and in-depth reviews, straight to your inbox.
Current page: AMD Ryzen 9 7900X3D: Power Consumption, Overclocking, Efficiency, Test Setup
Prev Page Not All That Glitters Next Page AMD Ryzen 9 7900X3D Gaming Benchmarks
Paul Alcorn is the Editor-in-Chief for Tom's Hardware US. He also writes news and reviews on CPUs, storage, and enterprise hardware.
-
Brian D Smith -No support for DDR4 memoryReply
LOL...that's like saying a horse cannot use an elephant's saddle. Seriously, why even say that as a negative? Oh...it's Paul. -
Giroro I question the point of a non-flagship gaming CPU when nobody is making a non-flagship gaming GPU.Reply -
logainofhades ReplyGiroro said:I question the point of a non-flagship gaming CPU when nobody is making a non-flagship gaming GPU.
The 7900xt, 4070ti, and 4080 are not flagship models. That would be the 7900xtx and the 4090. -
Metteec Brian D Smith: I get your point, but the Intel i9-13900K (the competitor to the Ryzen 9 7900X3D) supports both DDR4 and DD5. Therefore, Paul's feedback on this particular issue is warranted. AMD's design decision to switch exclusively to DDR5 is a detractor to many buyers, including myself, who would have upgraded their CPUs but can't because they would have to invest in DDR5. Conversely, Intel has eased the transition its 12th generation processor by offering compatible motherboards with either DDR4 or DDR5.Reply
I would guess that Intel's 14th generation will ditch DDR4 for good, but as of now, DDR4 compatibility is one thing that the i9-13900K has going for it over the Ryzen 9 7900X3D.
Disclosure: I hold positions in both Intel and AMD stock and use predominantly AMD products. -
2Be_or_Not2Be I wonder how the upcoming single-CCD 7800X3D will perform. I like that it's a single-CCD CPU vs the dual-CCD in the 7950/7900X3D. If it can boost to 5.6GHz, despite the official boost rating only showing 5.0GHz, then that could potentially be the best of both worlds (gaming & application, when app not limited by # of cores).Reply -
2Be_or_Not2Be ReplyMetteec said:Disclosure: I hold positions in both Intel and AMD stock and use predominantly AMD products.
Disclosure: I am currently losing money with positions in both Intel and AMD stock and use predominantly AMD products. :) -
Maebius My crystal ball foresees that after a while (a few months) , the 7900X3D will be very very closely (street)priced to the 7800X3D.Reply -
jeremyj_83 Reply
13th Gen supports DDR4 because it is socket compatible with 12th Gen. Making 13th Gen DDR5 only would have meant that Z690 (and other 12th Gen chipsets) only supported 1 CPU version. As of late Intel has made it such that chipsets support 2 generations of CPUs. When 12th Gen came out, it made sense for there to be DDR4 support as DDR5 was at a huge price premium. Fast forward to now and the price premium over DDR4 is much lower, still not 1:1 but..., so supporting 2 memory types is only for socket compatibility for Intel's standard 2 generations. Had Intel gone DDR5 only on 13th Gen we probably would have seen DDR5 prices drop much faster than they already are.Metteec said:Brian D Smith: I get your point, but the Intel i9-13900K (the competitor to the Ryzen 9 7900X3D) supports both DDR4 and DD5. Therefore, Paul's feedback on this particular issue is warranted. AMD's design decision to switch exclusively to DDR5 is a detractor to many buyers, including myself, who would have upgraded their CPUs but can't because they would have to invest in DDR5. Conversely, Intel has eased the transition its 12th generation processor by offering compatible motherboards with either DDR4 or DDR5.
I would guess that Intel's 14th generation will ditch DDR4 for good, but as of now, DDR4 compatibility is one thing that the i9-13900K has going for it over the Ryzen 9 7900X3D.
Disclosure: I hold positions in both Intel and AMD stock and use predominantly AMD products. -
Roland Of Gilead Reply
Agree with you for the most part, but this idea that DDR5 is a killer for any consumers and having to go with AMD (without choice) for Zen4/AM5 doesn't add up. DDR4 support for Intel's current 13th Gen ends with Raptor. (maybe a Raptor -s not known yet). Meteor or next desktop is exclusively DDR5. Add to that, that AMD will support maybe 3/4 new CPU's on the same socket. Intel don't do that. The cost upfront, of maybe 100-150, sure does make up for not having to upgrade on Intel every two years.Metteec said:Brian D Smith: I get your point, but the Intel i9-13900K (the competitor to the Ryzen 9 7900X3D) supports both DDR4 and DD5. Therefore, Paul's feedback on this particular issue is warranted. AMD's design decision to switch exclusively to DDR5 is a detractor to many buyers, including myself, who would have upgraded their CPUs but can't because they would have to invest in DDR5.
For what it's worth, I'd rather have a socket that lasts 4-5 years, and allow for simple drop in upgrades, that are and can be substantive. -
DavidLejdar I am avoiding the 7900X3D. Some games like to use up to 8 cores (when they are available), and the 6+6 setup means that some workload gets directed to 2 additional cores on the second CCD. This doesn't mean a stutter-fest. But what's the point (for gaming as such), when the 7800X3D may actually deliver better gaming performance, having 8 cores with 3D V-Cache?Reply
I think it is fair to point out that the CPU goes only with DDR5. But it would also be fair to run some tests comparing gaming performance of e.g. the 13900K with DDR4 and DDR5, as the charts seem to be presenting the performance with DDR5 only, which then makes it a somewhat moot point to say: "And this one can use DDR4 as well, which is a huge plus.", without then elaborating whether a DDR4 rig does deliver the same performance as a cheaper CPU with DDR5 perhaps may, etc.Metteec said:I would guess that Intel's 14th generation will ditch DDR4 for good, but as of now, DDR4 compatibility is one thing that the i9-13900K has going for it over the Ryzen 9 7900X3D.
