Why you can trust Tom's Hardware
AMD Ryzen 9 7900X3D Gaming Benchmarks — The TLDR
- Ryzen 9 7900X3D: Corsair H115i 280mm water cooler, default power limits, DDR5-5200 (Coupled Mode)
- Ryzen 9 7900X3D PBO/UV: Corsair H115i 280mm water cooler, Precision Boost Overdrive (Advanced/Motherboard), Scalar 10X, -20 Curve Optimizer, DDR5-6000 EXPO (Coupled Mode)
You can find the particulars of our overclock and test setup on the previous page. Here we have the geometric mean of our gaming tests at 1080p and 1440p, with each resolution split into its own chart. We're testing with an Nvidia GeForce RTX 4090 to reduce GPU-imposed bottlenecks as much as possible, and differences between test subjects will shrink with lesser cards or higher resolutions and fidelity. You'll find further game-by-game breakdowns below.
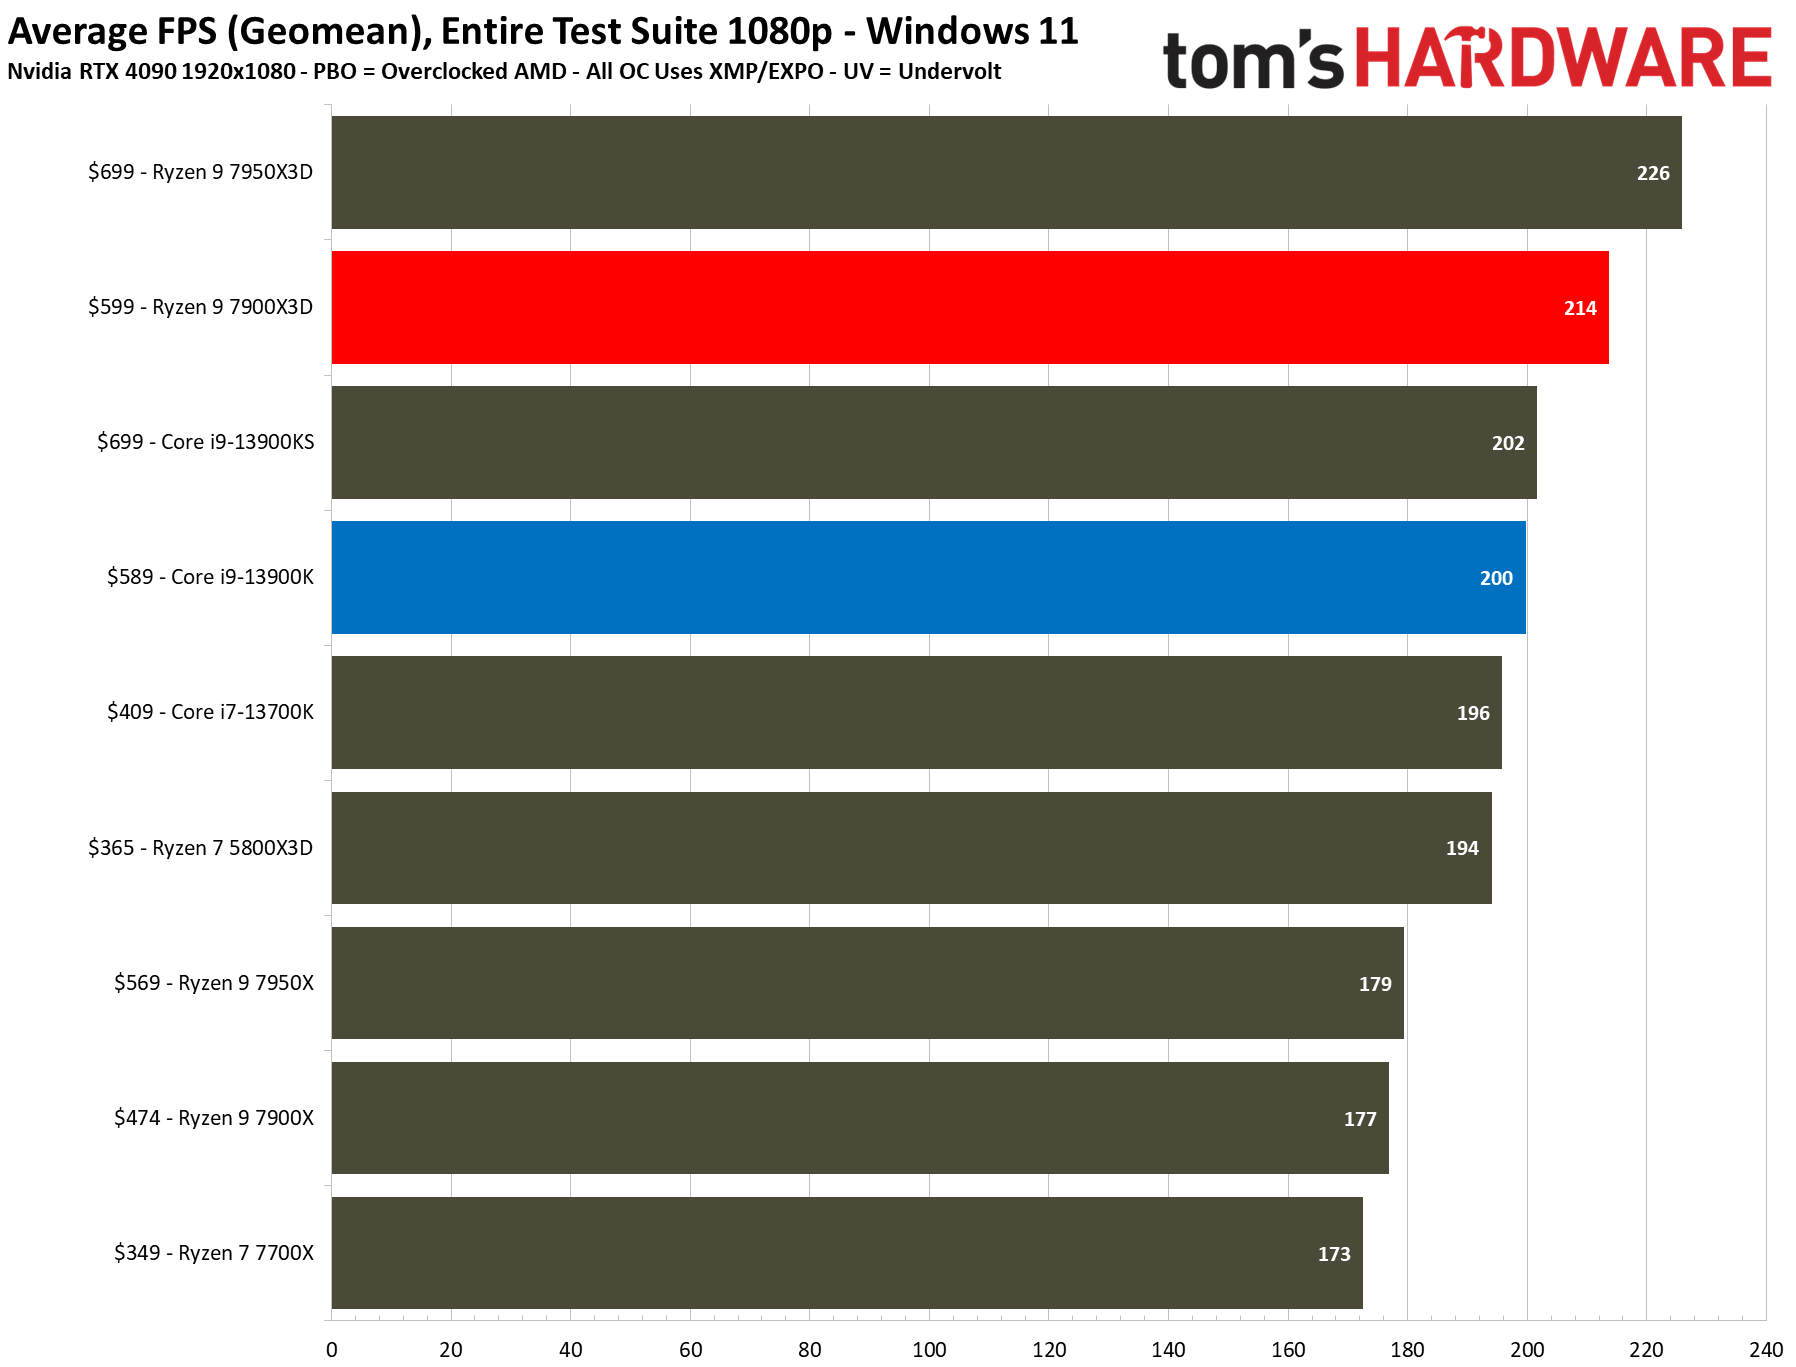
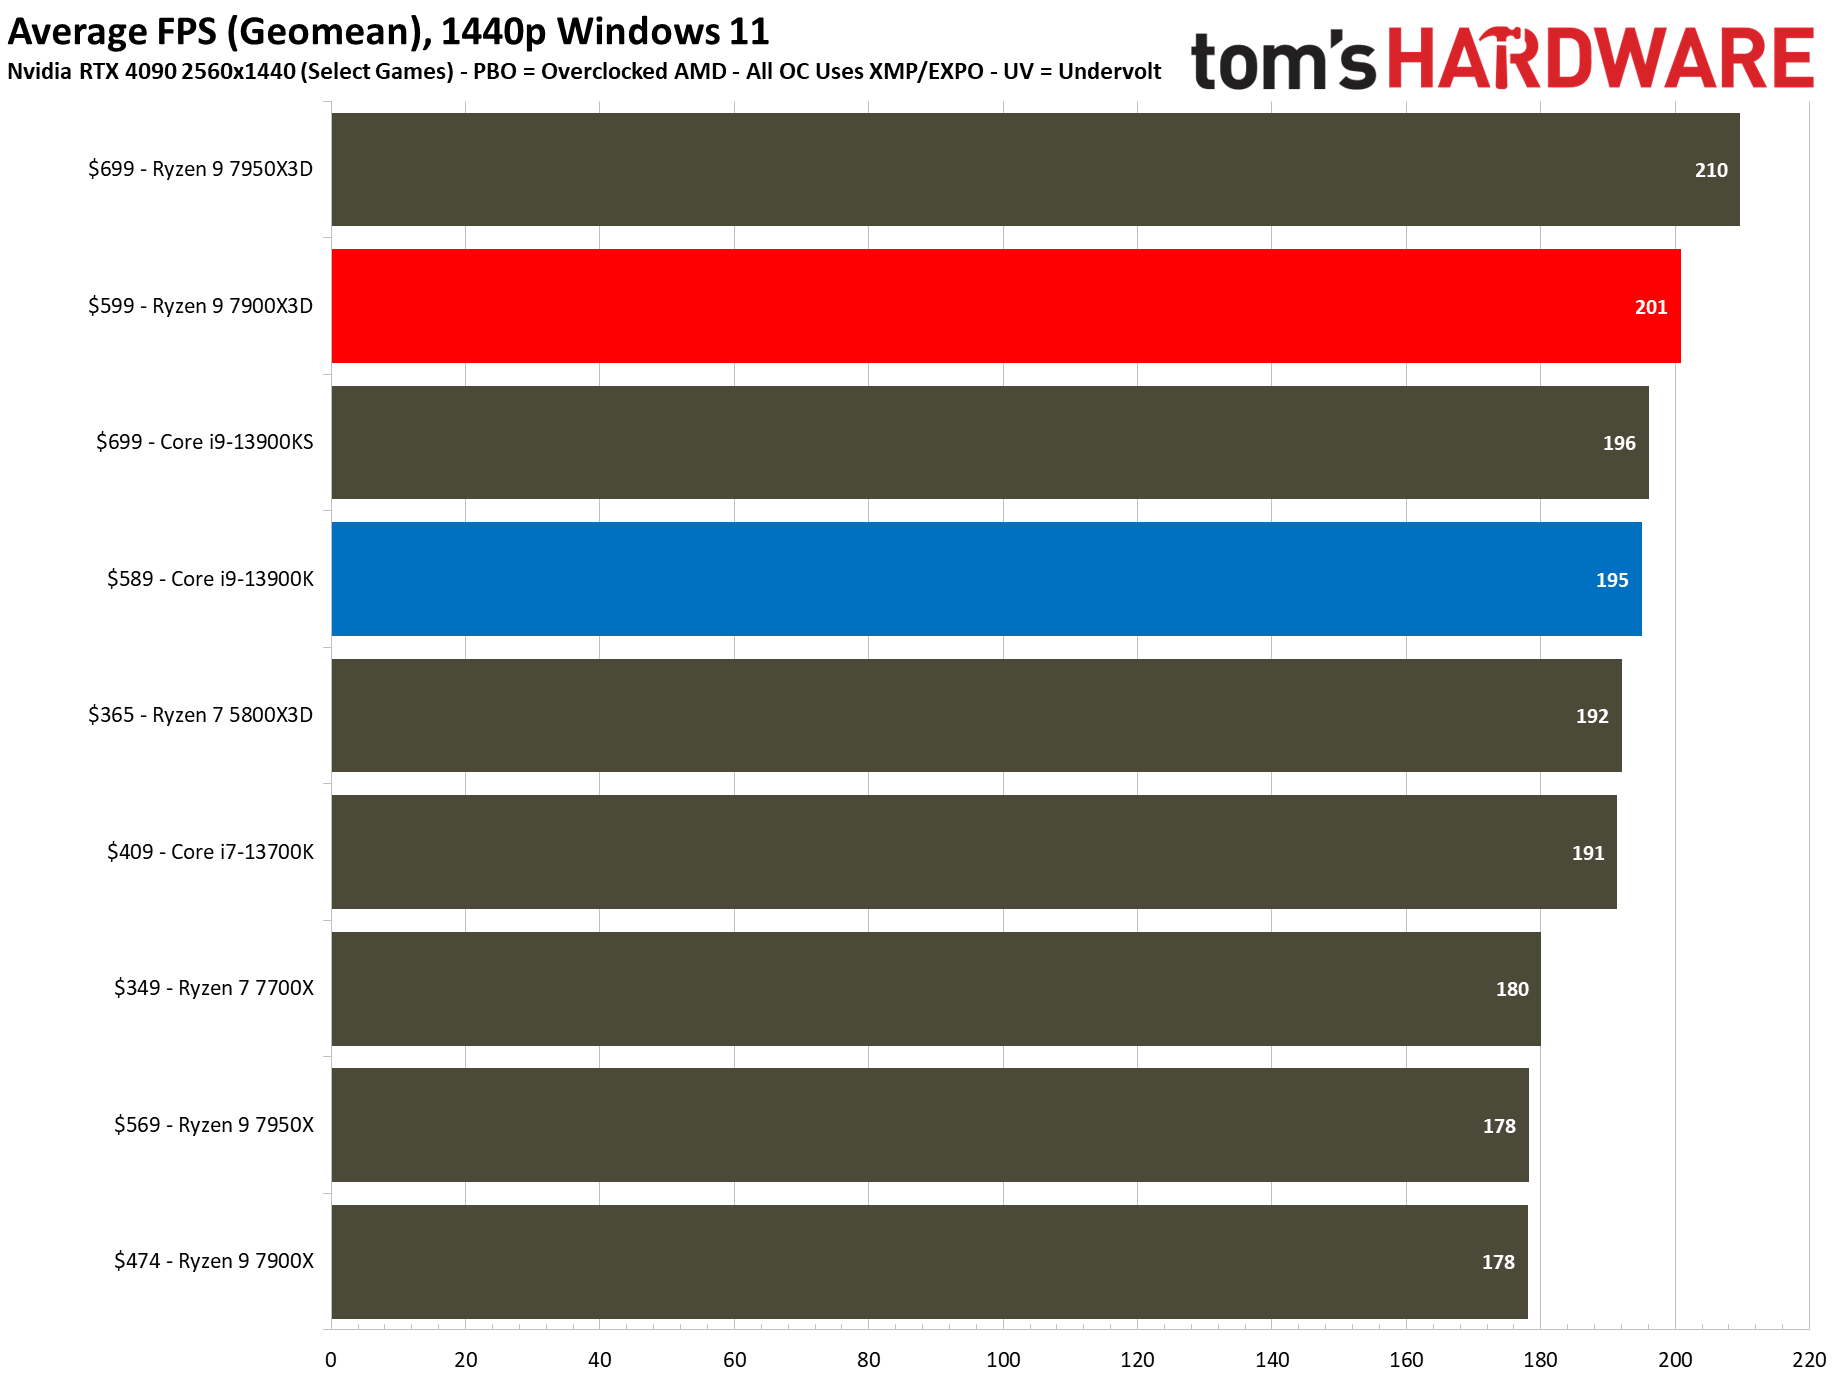
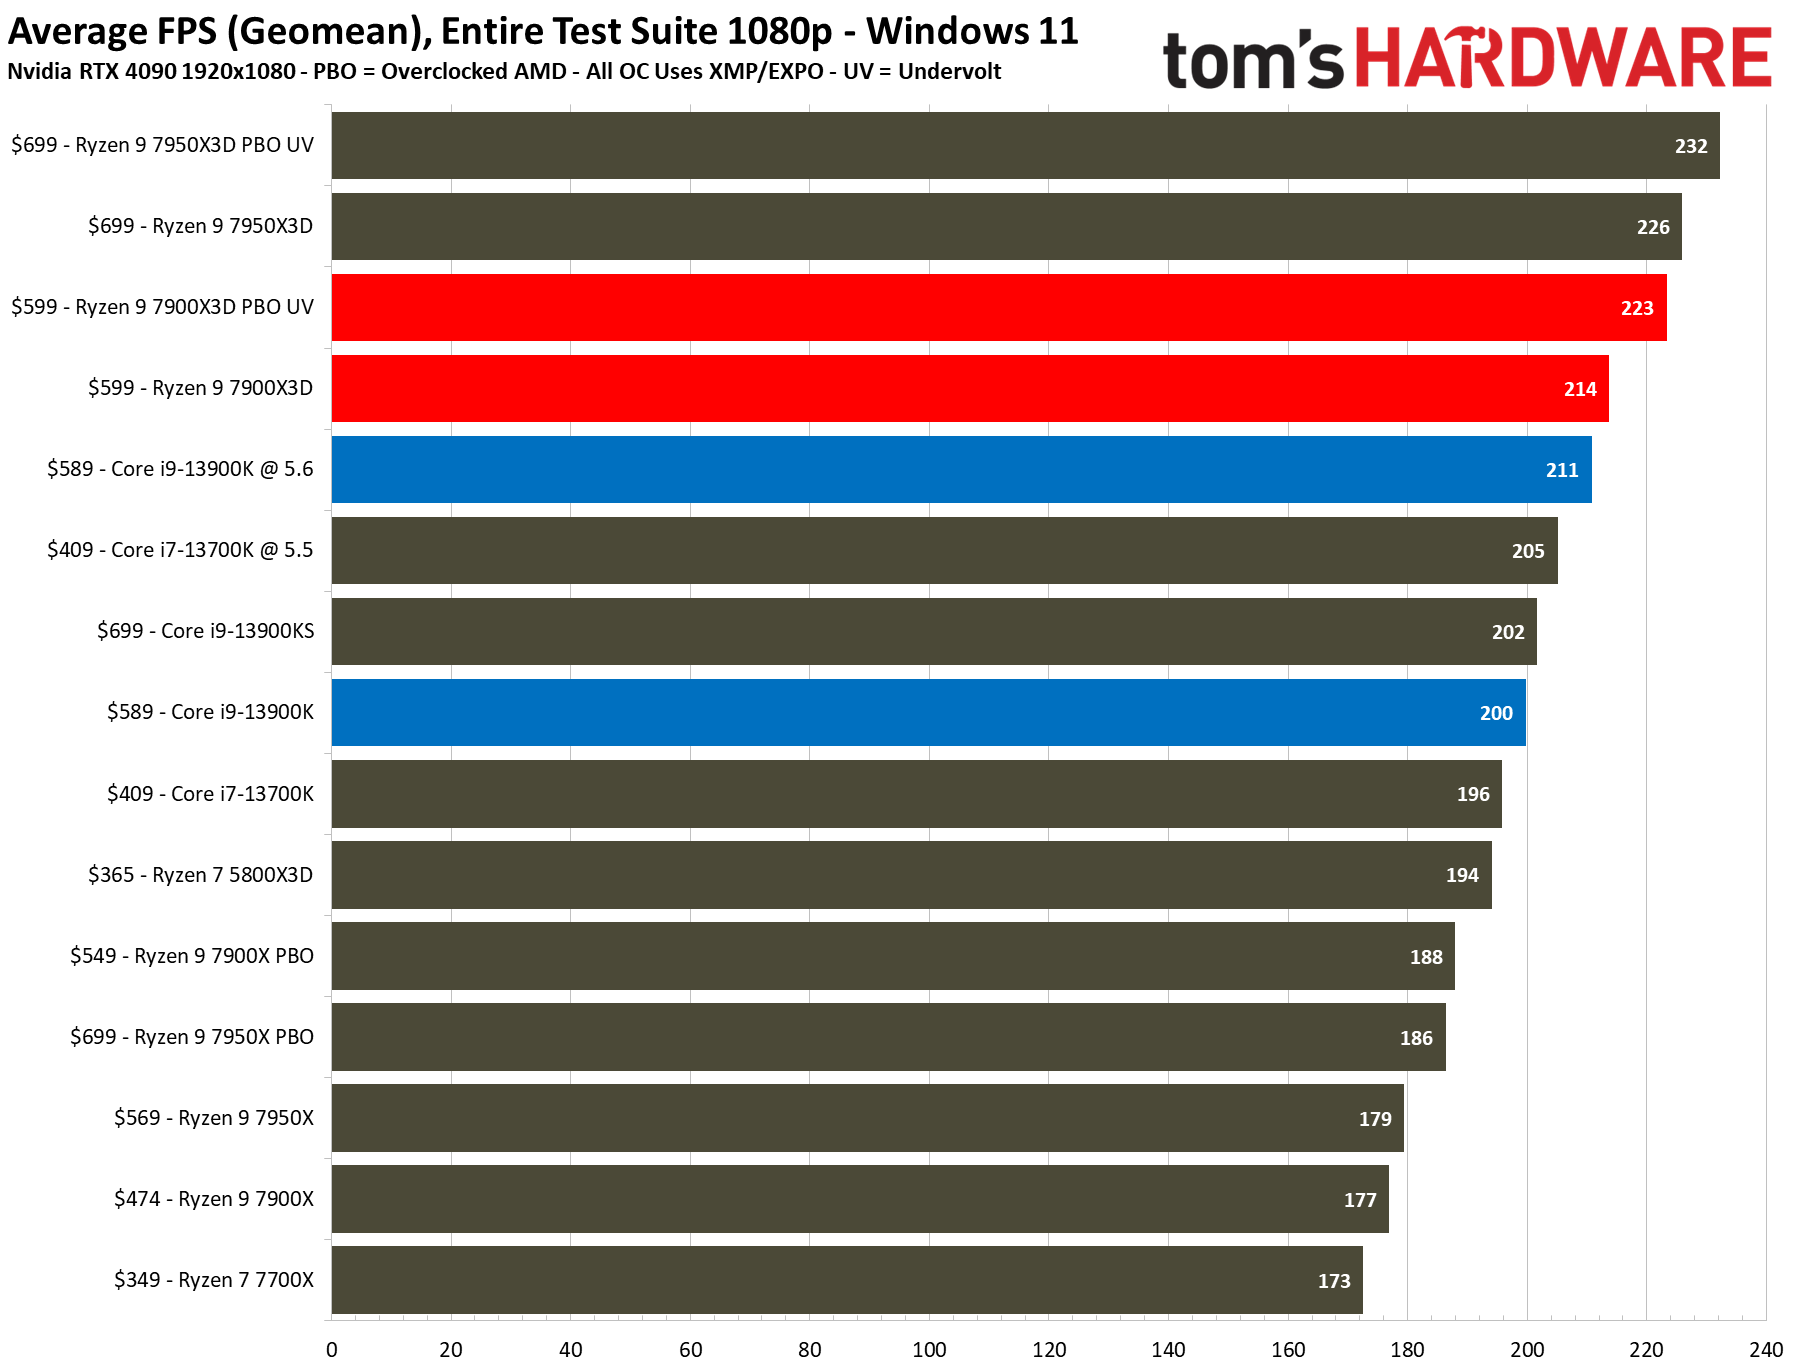
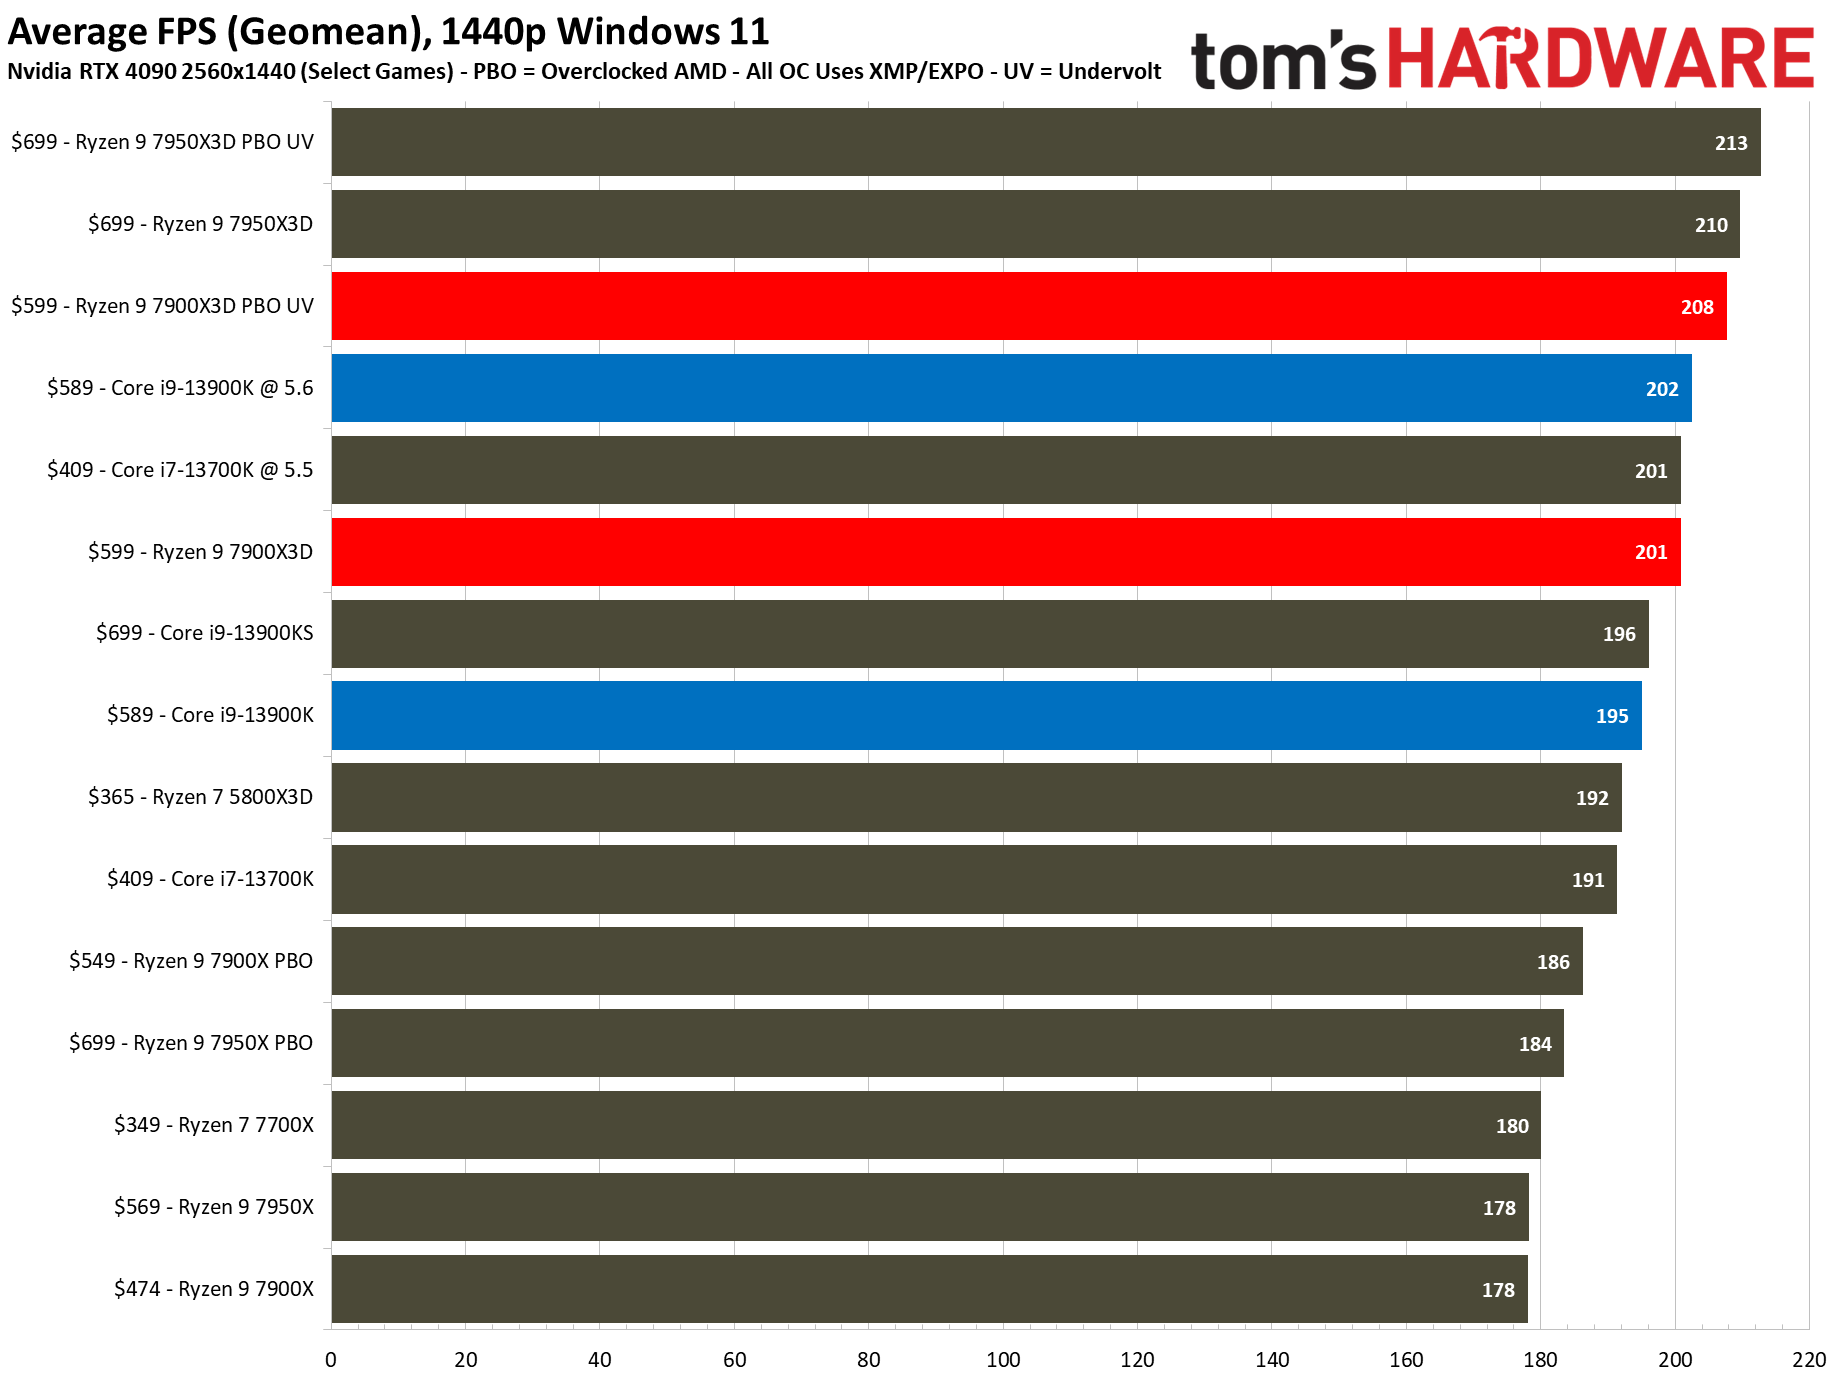
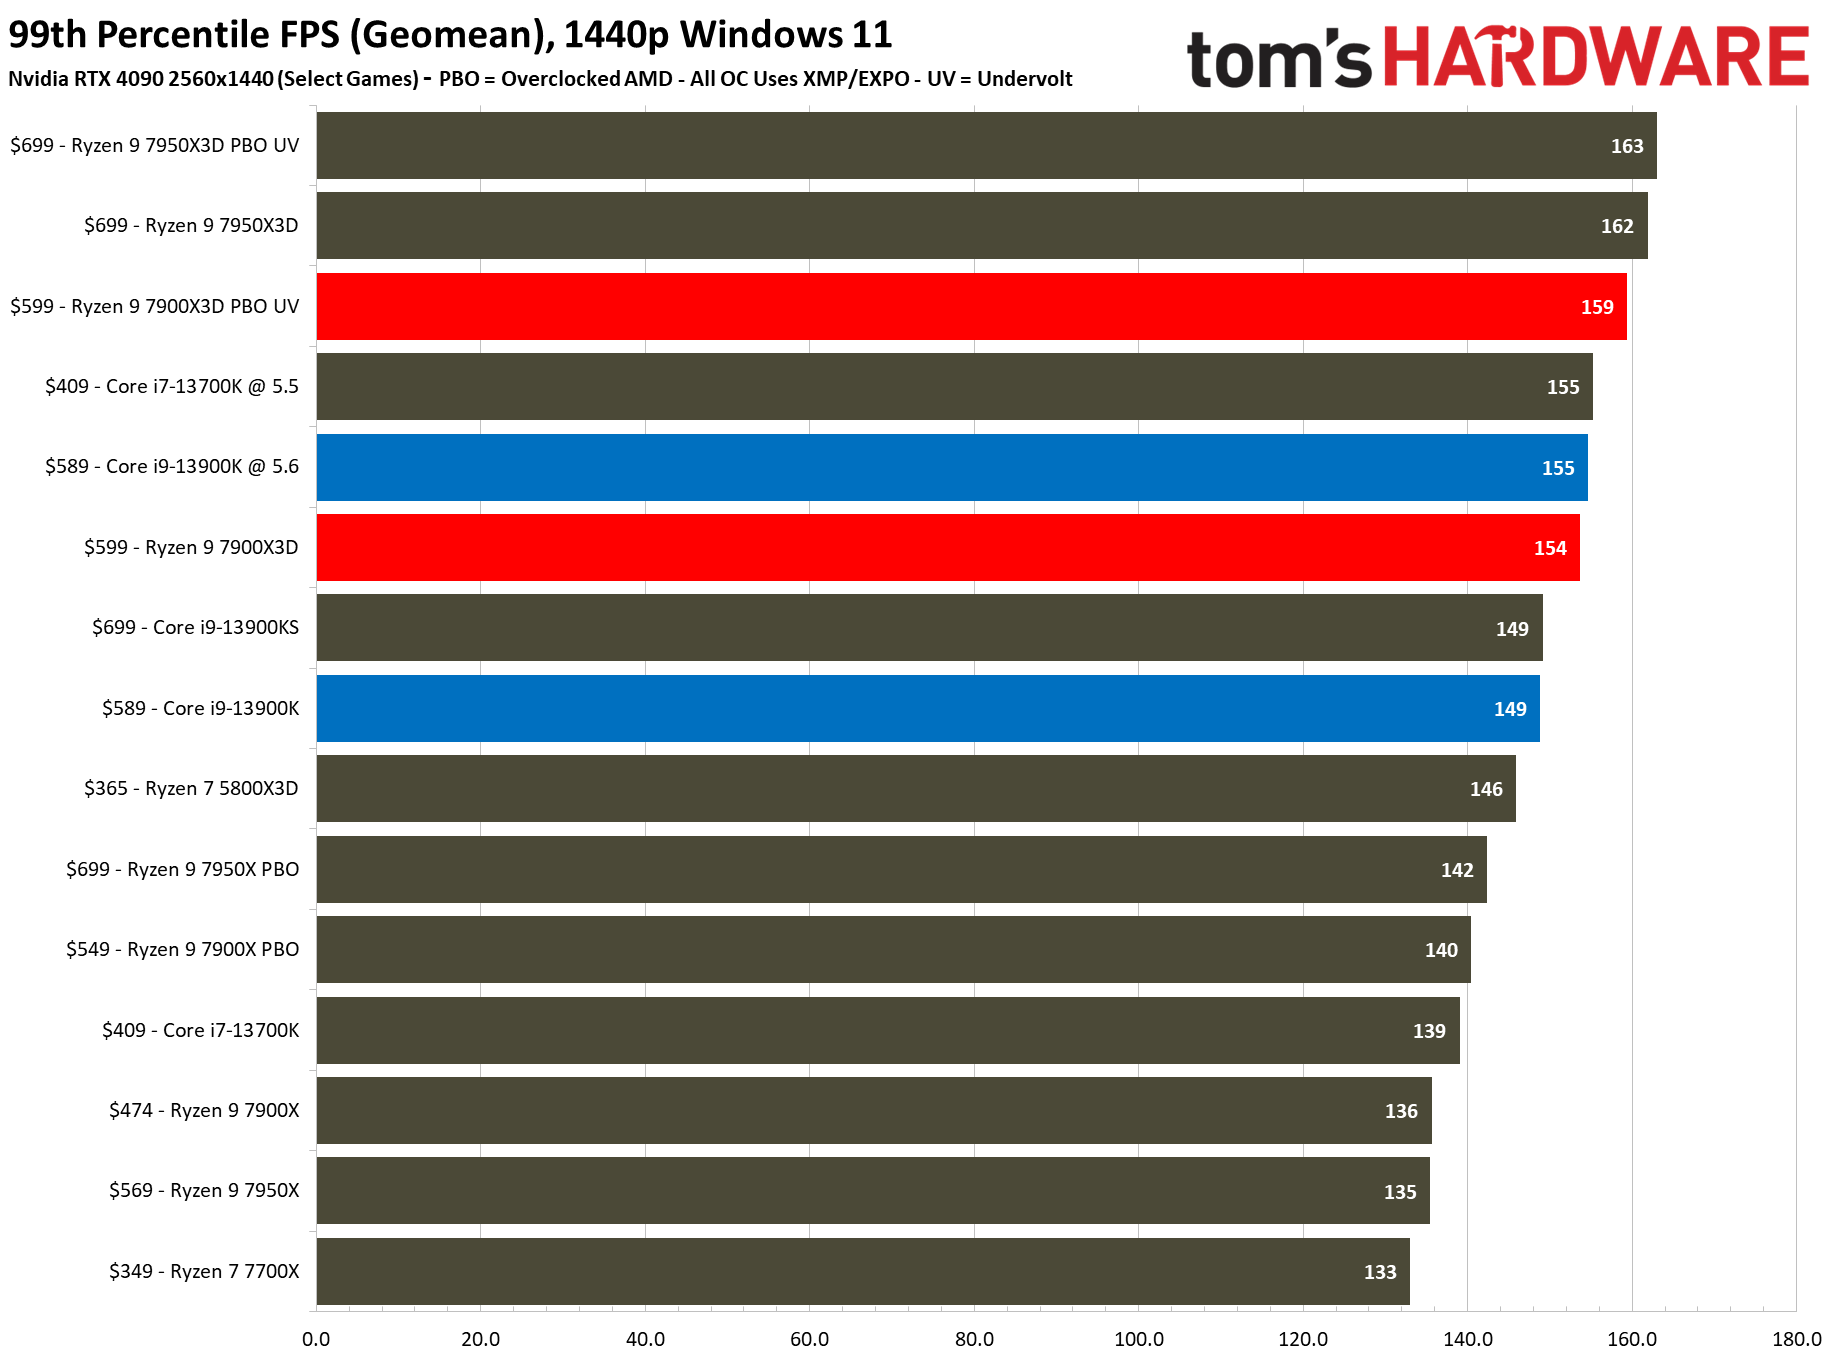
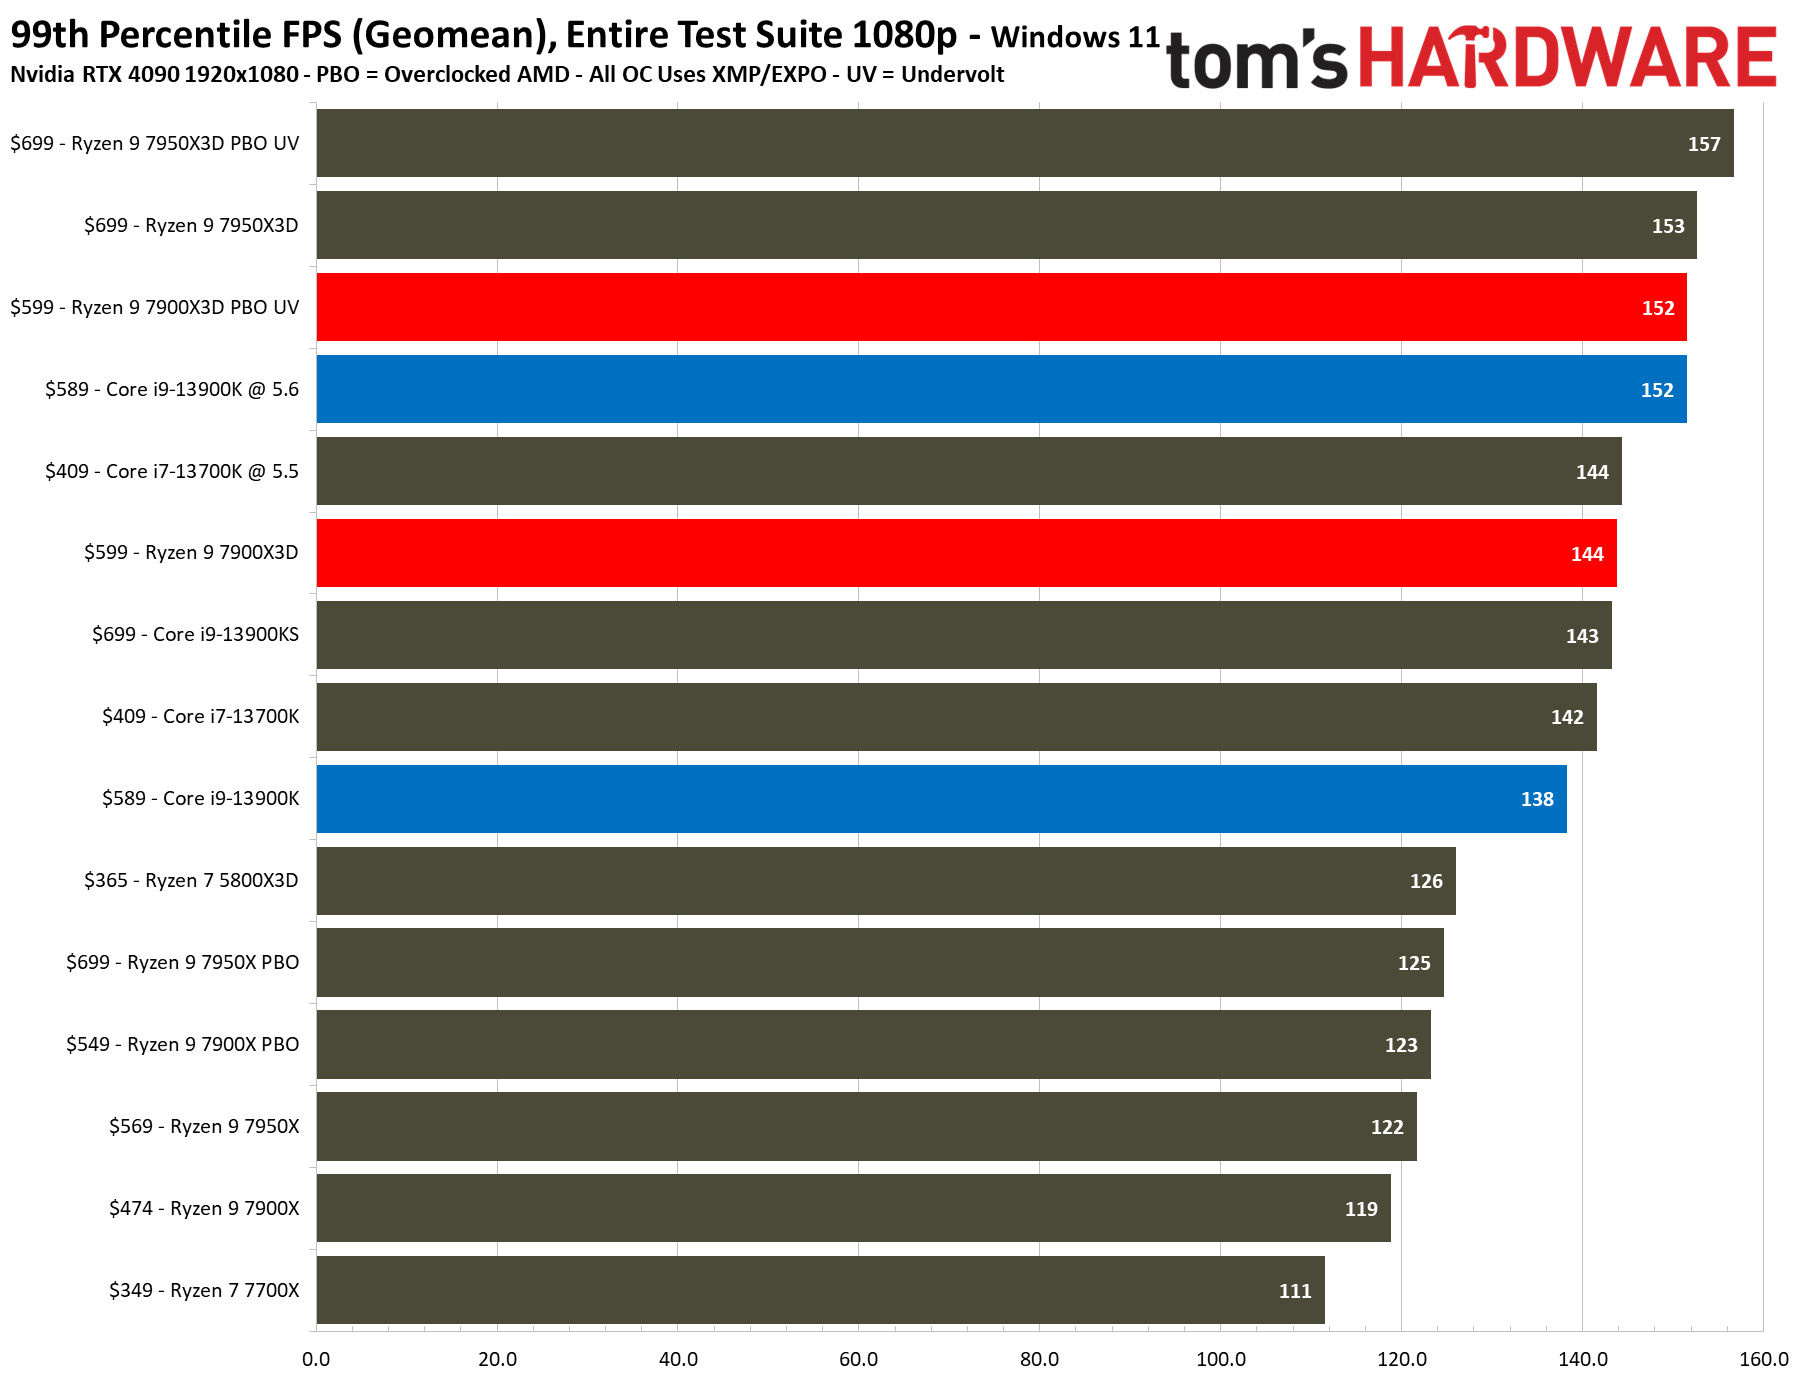
The first slides are simplified by excluding the overclocking configs, while the remainder contains the full roster of tested configurations. The $599 Ryzen 9 7900X3D lives up to its billing as a speedy gaming chip, but be aware that the 3D V-Cache doesn’t accelerate all titles equally, so you’ll have to assess the trends in the individual game benchmarks below. The 3D V-Cache tech also leads to reductions in productivity application performance, as you'll see on the following page.
The $699 16-core Ryzen 9 7950X3D is the 7900X3D's biggest competition — the flagship is 6% faster than the 12-core 7900X3D at stock settings and 4% faster after overclocking. However, it also comes with four additional cores that help reduce the shortcomings in productivity applications.
AMD also has the $449 eight-core Ryzen 7 7800X3D waiting in the wings. This chip comes to market in April and will deliver the lion's share of 3D V-Cache's gaming performance (~95%) for $150 less than the 7900X3D. This will likely be the gaming chip to beat for this generation of processors, and it will undoubtedly offer tremendously more value than the 7900X3D.
AMD aims the $599 Ryzen 9 7900X3D at the like-priced $589 Core i9-13900K. The 7900X3D wins the gaming contest, it's ~7% faster than the 13900K in 1080p gaming at stock and overclocked settings, but as you'll see on the next page, the 13900K is a far better all-rounder.
The 7900X3D is designed for gaming-specific rigs, so the Core i7-13700K is also a contender. At $409, this chip offers nearly the same gaming performance as the Core i9-13900K, so those looking for a more affordable high-end gaming rig have all the more reason to step down if they're looking to save some cash. The stock and overclocked 7900X3D is 9% faster than the 13700K, but the 13700K also costs significantly less cash while offering more performance in productivity applications.
If you're looking to save even more cash and are only interested in gaming, the Ryzen 7 5800X3D comes into the conversation. The 7900X3D is roughly 10% faster than the $365 Ryzen 7 5800X3D, but you'll pay $235 more just for the chip. Those savings compound after adding in the extra costs for a pricey AM5 motherboard and the premium for DDR5 memory. Meanwhile, the 5800X3D can drop into less-expensive AM4 boards and leverages cheaper DDR4 memory. This chip also has trade-offs associated with the 3D V-Cache, but it is a viable contender for value seekers.
The Ryzen 9 7900X3D is a whopping 25% faster than the vanilla Ryzen 9 7900X at stock settings, and 19% faster after overclocking both chips. Those are big generational gains, but the competition in this price range is stiff.
Our test suite heavily favors the improvements from 3D V-Cache, so we also included a table with results from an additional five games that we don’t normally test. Those extra titles aren't factored into the cumulative measurements above, but they show the same general trends.
| Tom's Hardware | 1080p Game Benchmarks |
| $699 — Ryzen 9 7950X3D | 100% |
| $599 — Ryzen 9 7900X3D | 94.6% |
| $699 — Core i9-13900KS | 89.3% |
| $589 — Core i9-13900K | 88.4% |
| $409 — Core i7-13700K | 86.7% |
| $569 — Ryzen 9 7950X | 79.4% |
| $358 — Ryzen 7 5800X3D | 85.9% |
| $474 — Ryzen 9 7900X | 78.3% |
Cyberpunk 2077 Benchmarks on AMD Ryzen 9 7900X3D
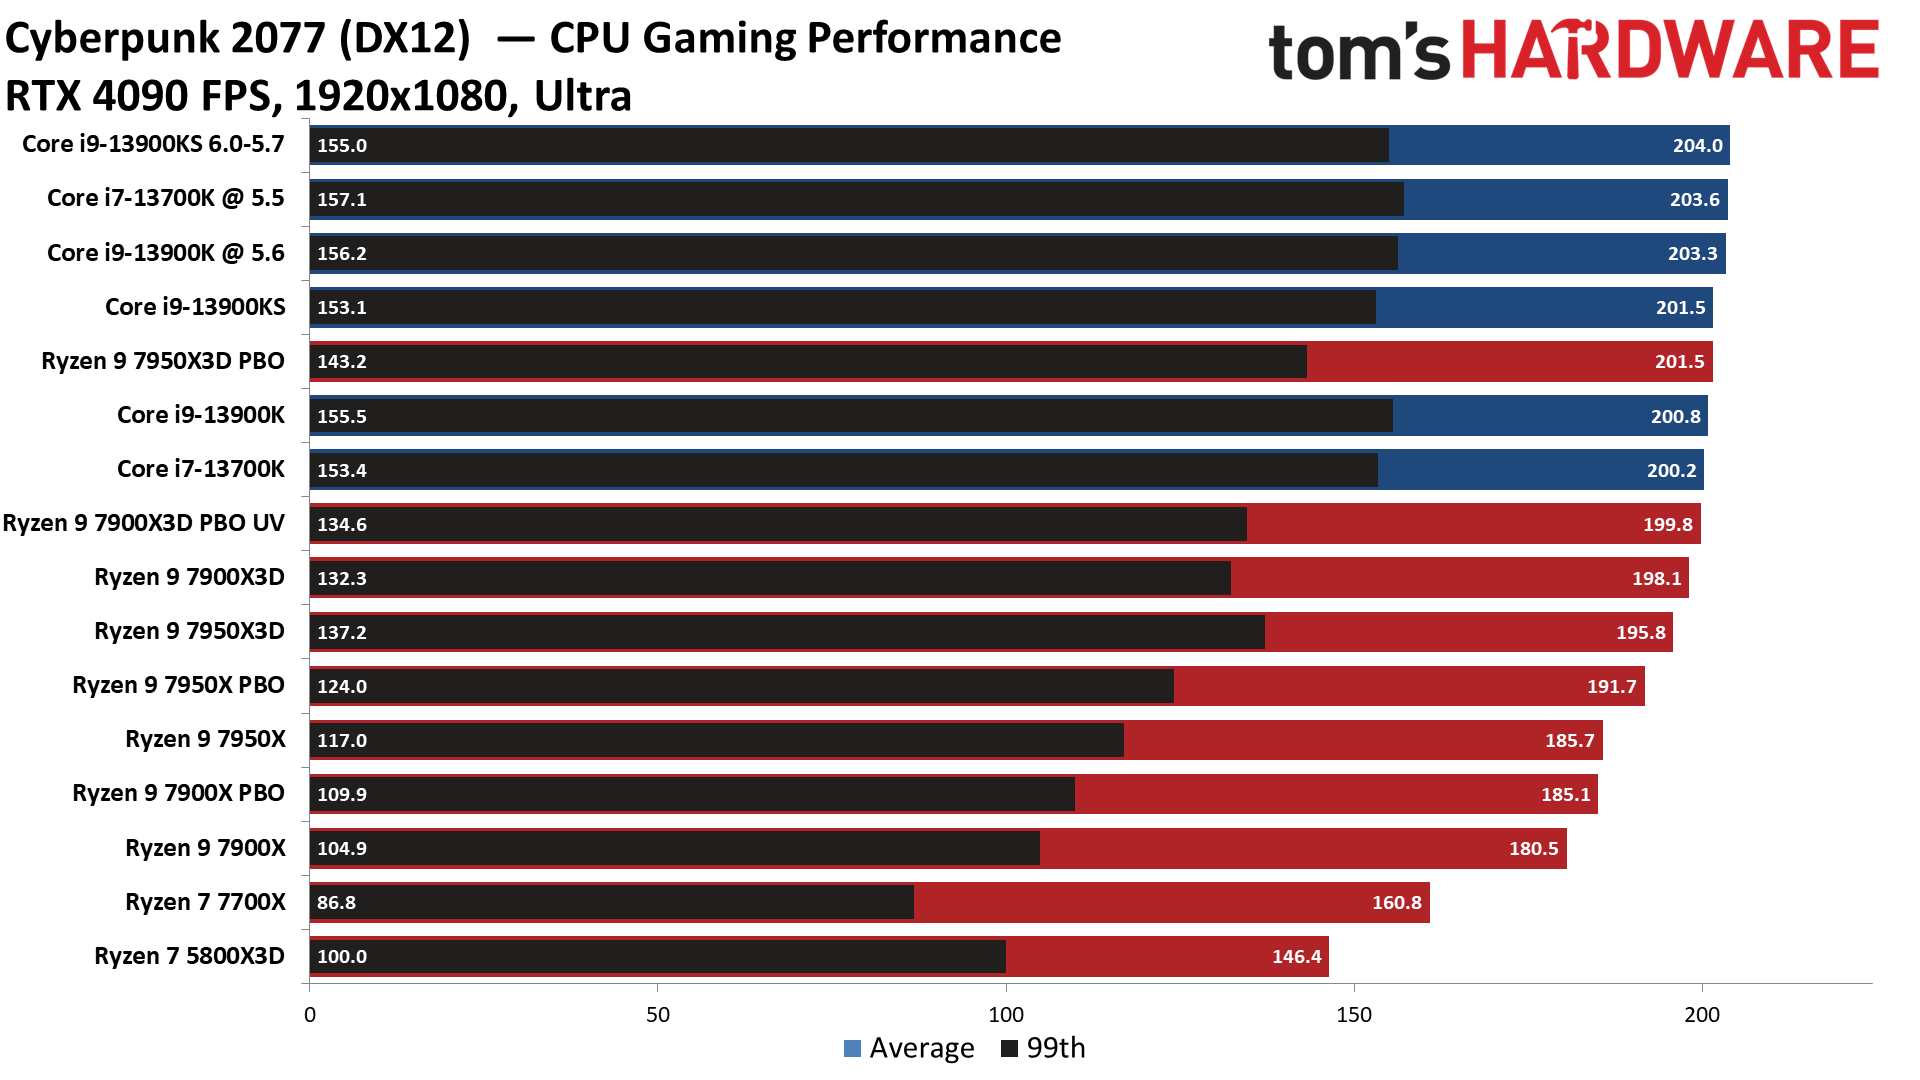
The Ryzen 9 7900X3D won’t provide much performance uplift over the standard Zen 4 models in all titles, which is important to remember — not all games benefit from the 3D cache-stacking tech — but here we see a sizeable uplift.
The Ryzen 9 7900X3D is 10% faster than the vanilla 7900X in Cyberpunk 2077, while the Core i9-13900K maintains a lead slim enough to almost call a tie. The deltas remain slim between the 13900K and 7900X3D after overclocking, too.
You'll also notice that the 79000X3D is ever-so-slightly faster than the 7950X3D in this title, but that's a rare occurrence throughout the rest of the suite.
Far Cry 6 Benchmarks on AMD Ryzen 9 7900X3D
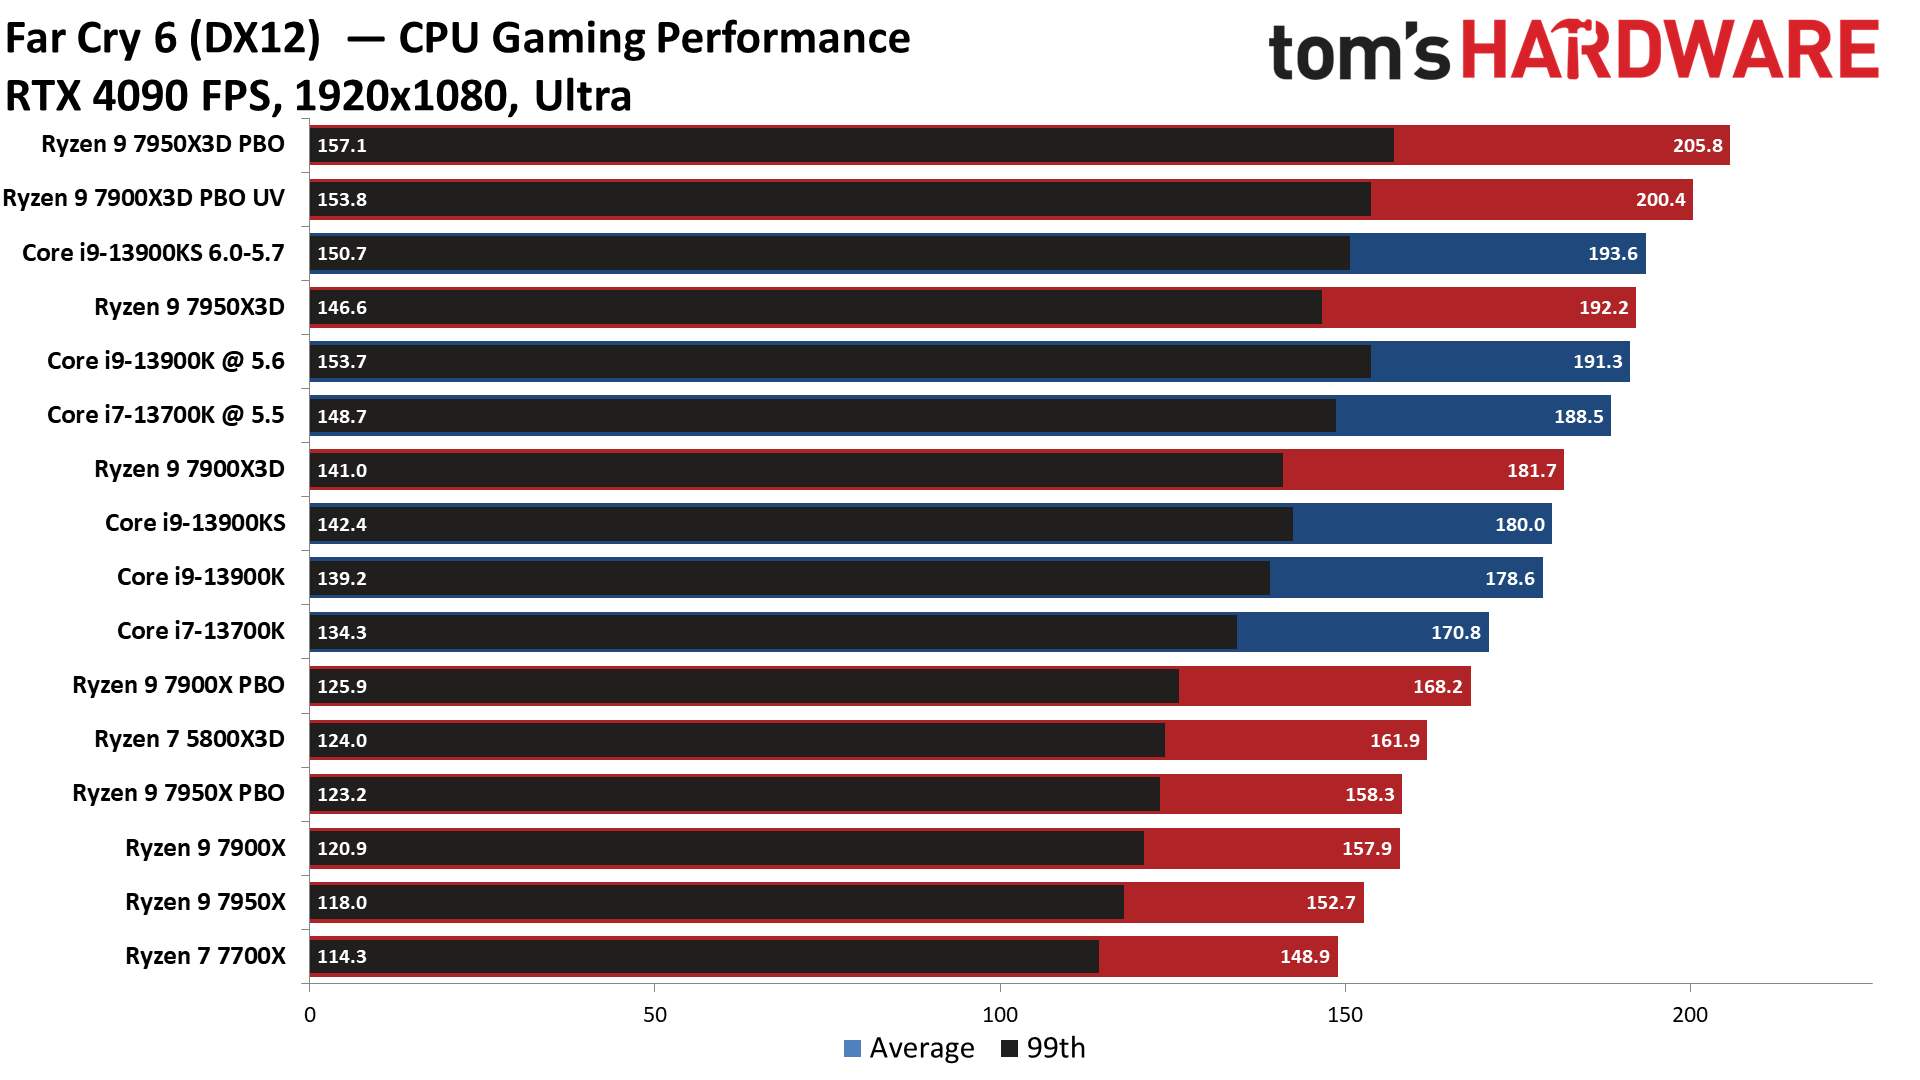
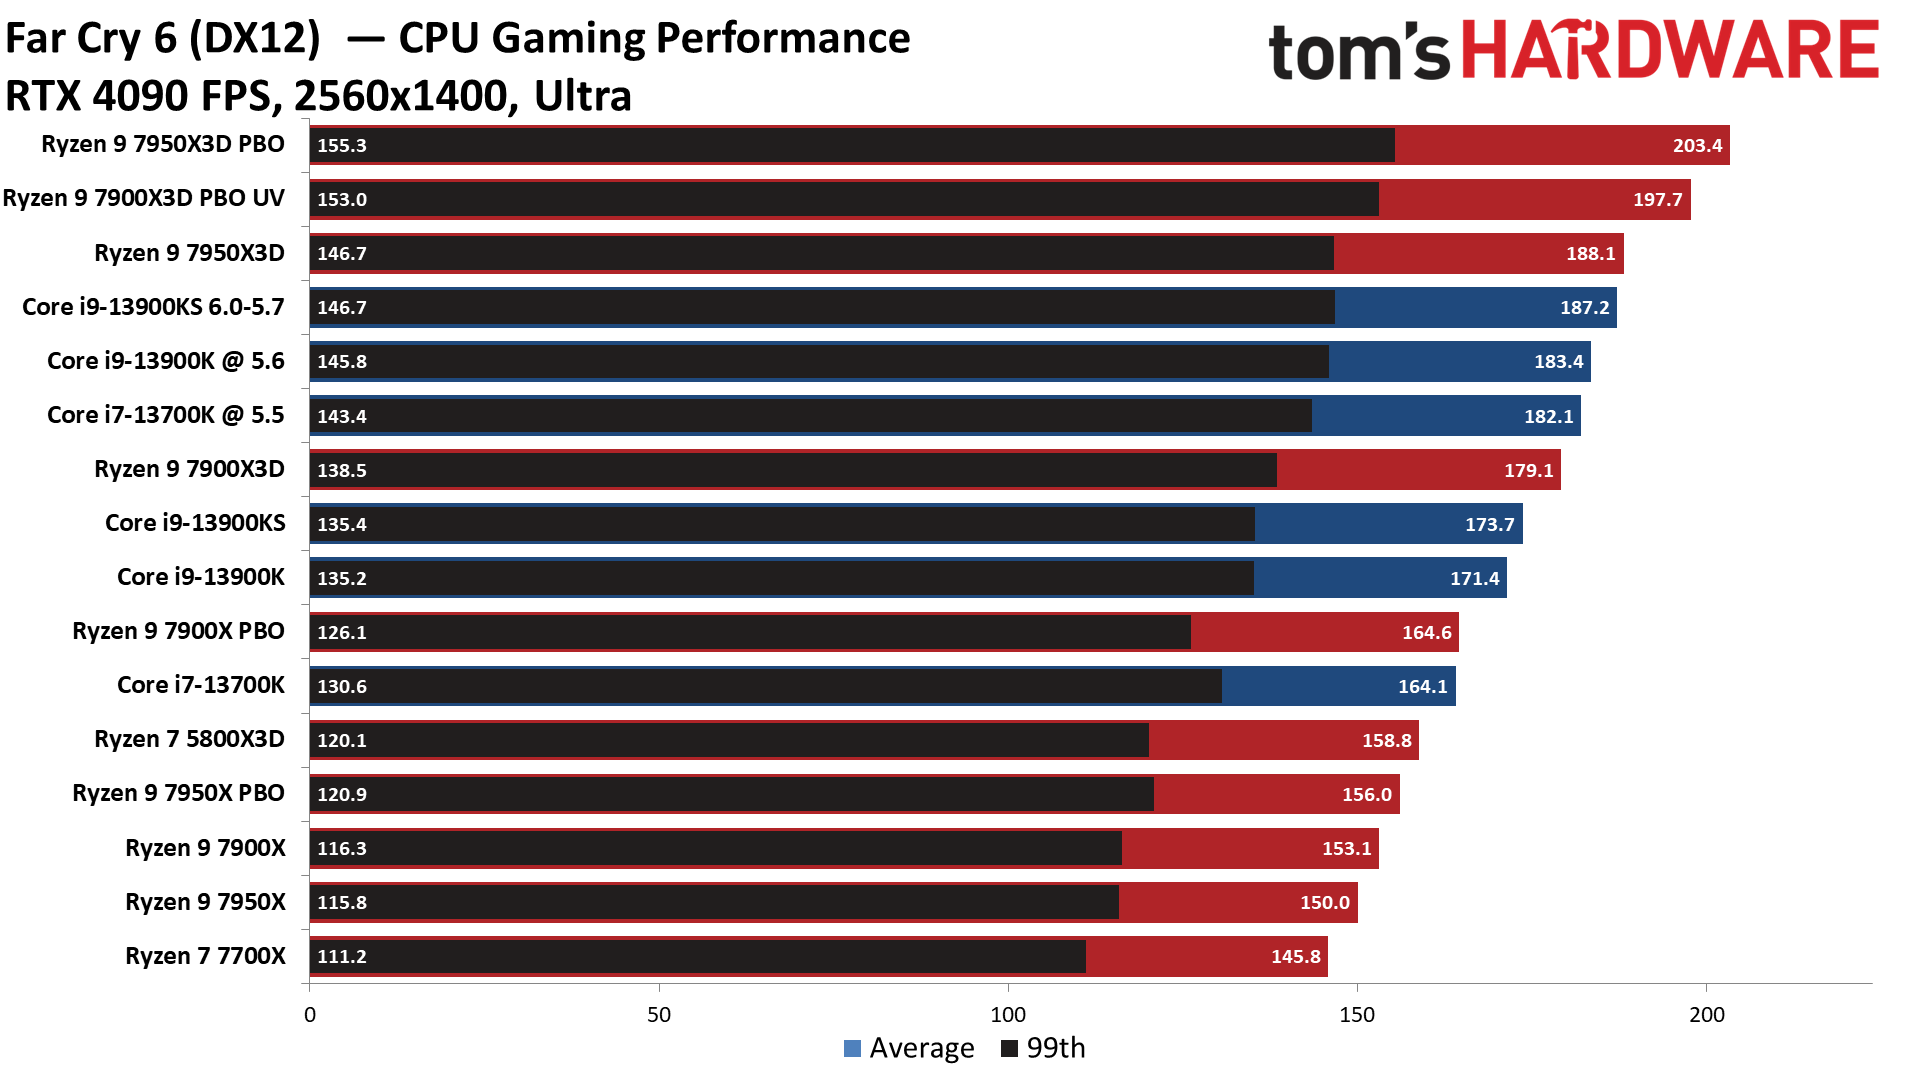
The stock 7900X3D beats the 13900K by a mere 2%, but that's all the more impressive because the Intel silicon pulls nearly twice as much power as the 7900X3D.
Get Tom's Hardware's best news and in-depth reviews, straight to your inbox.
F1 2021 Benchmarks on AMD Ryzen 9 7900X3D
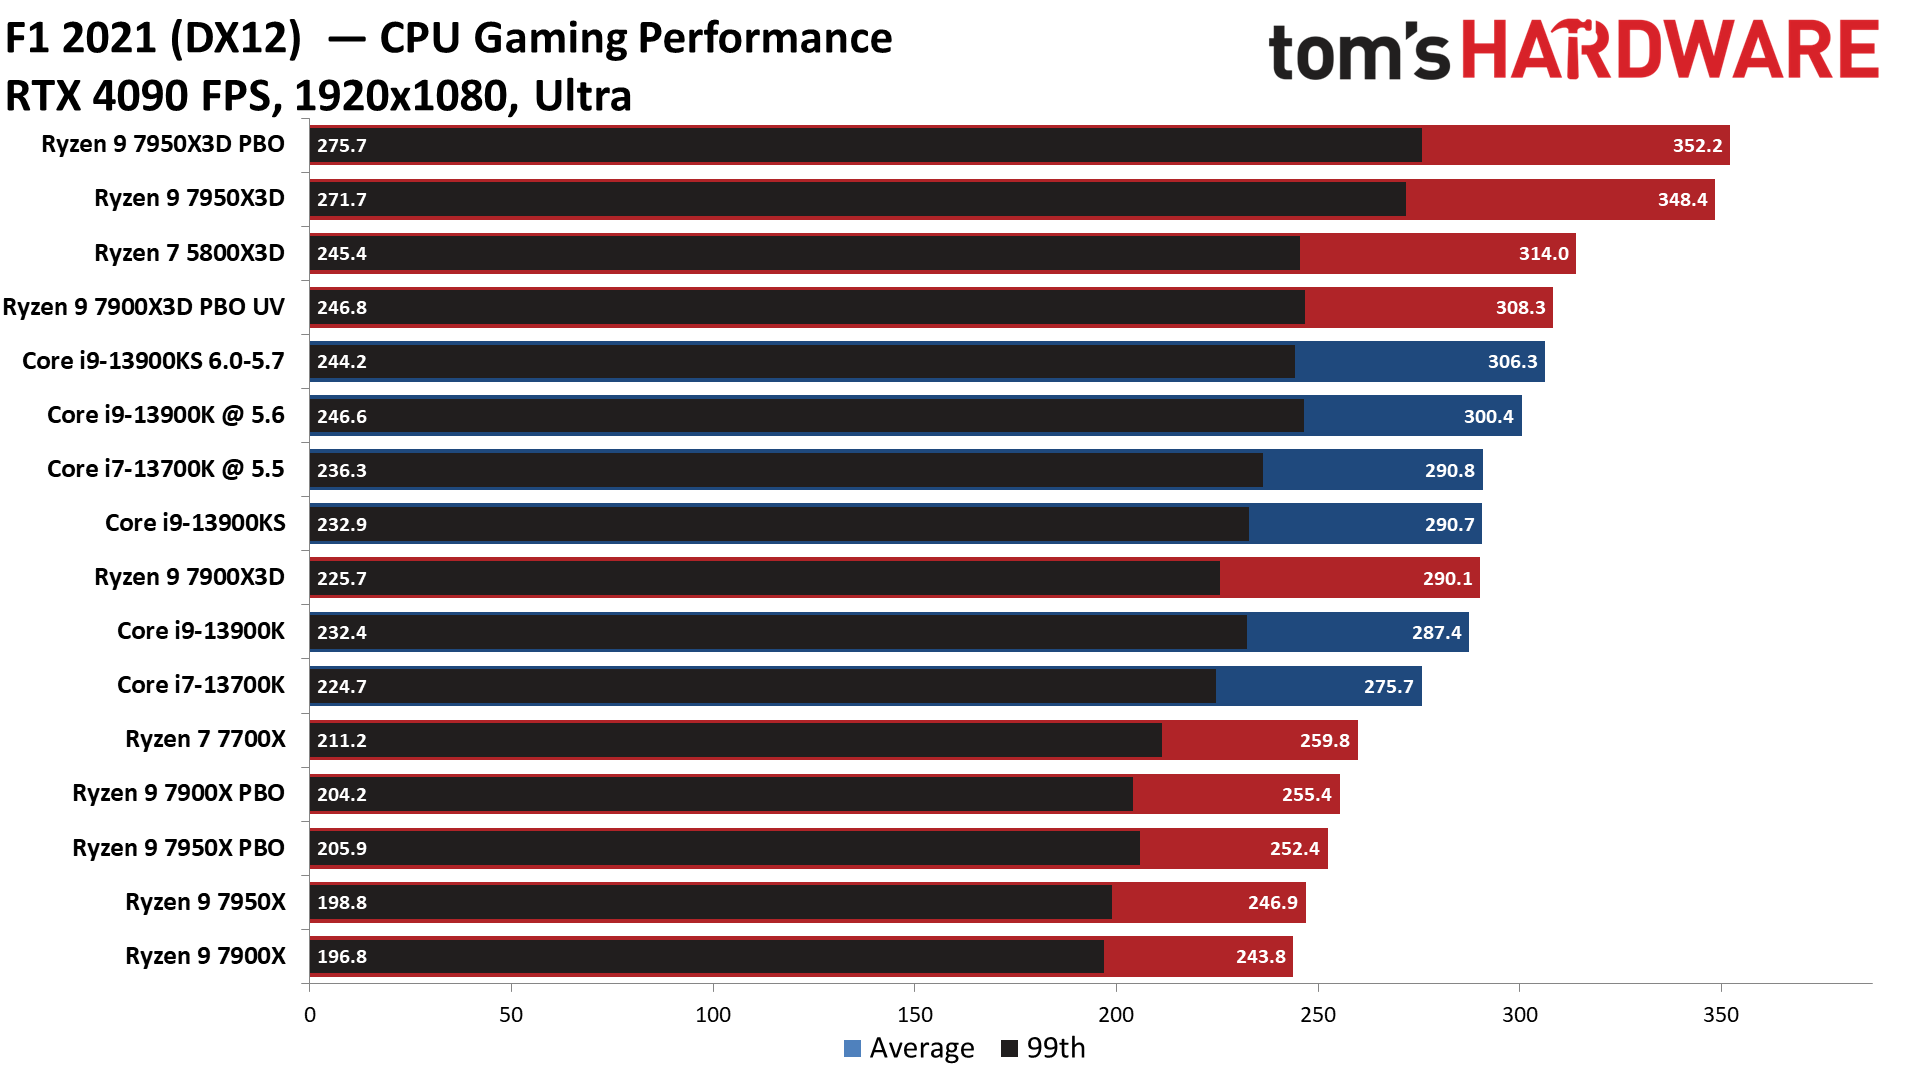
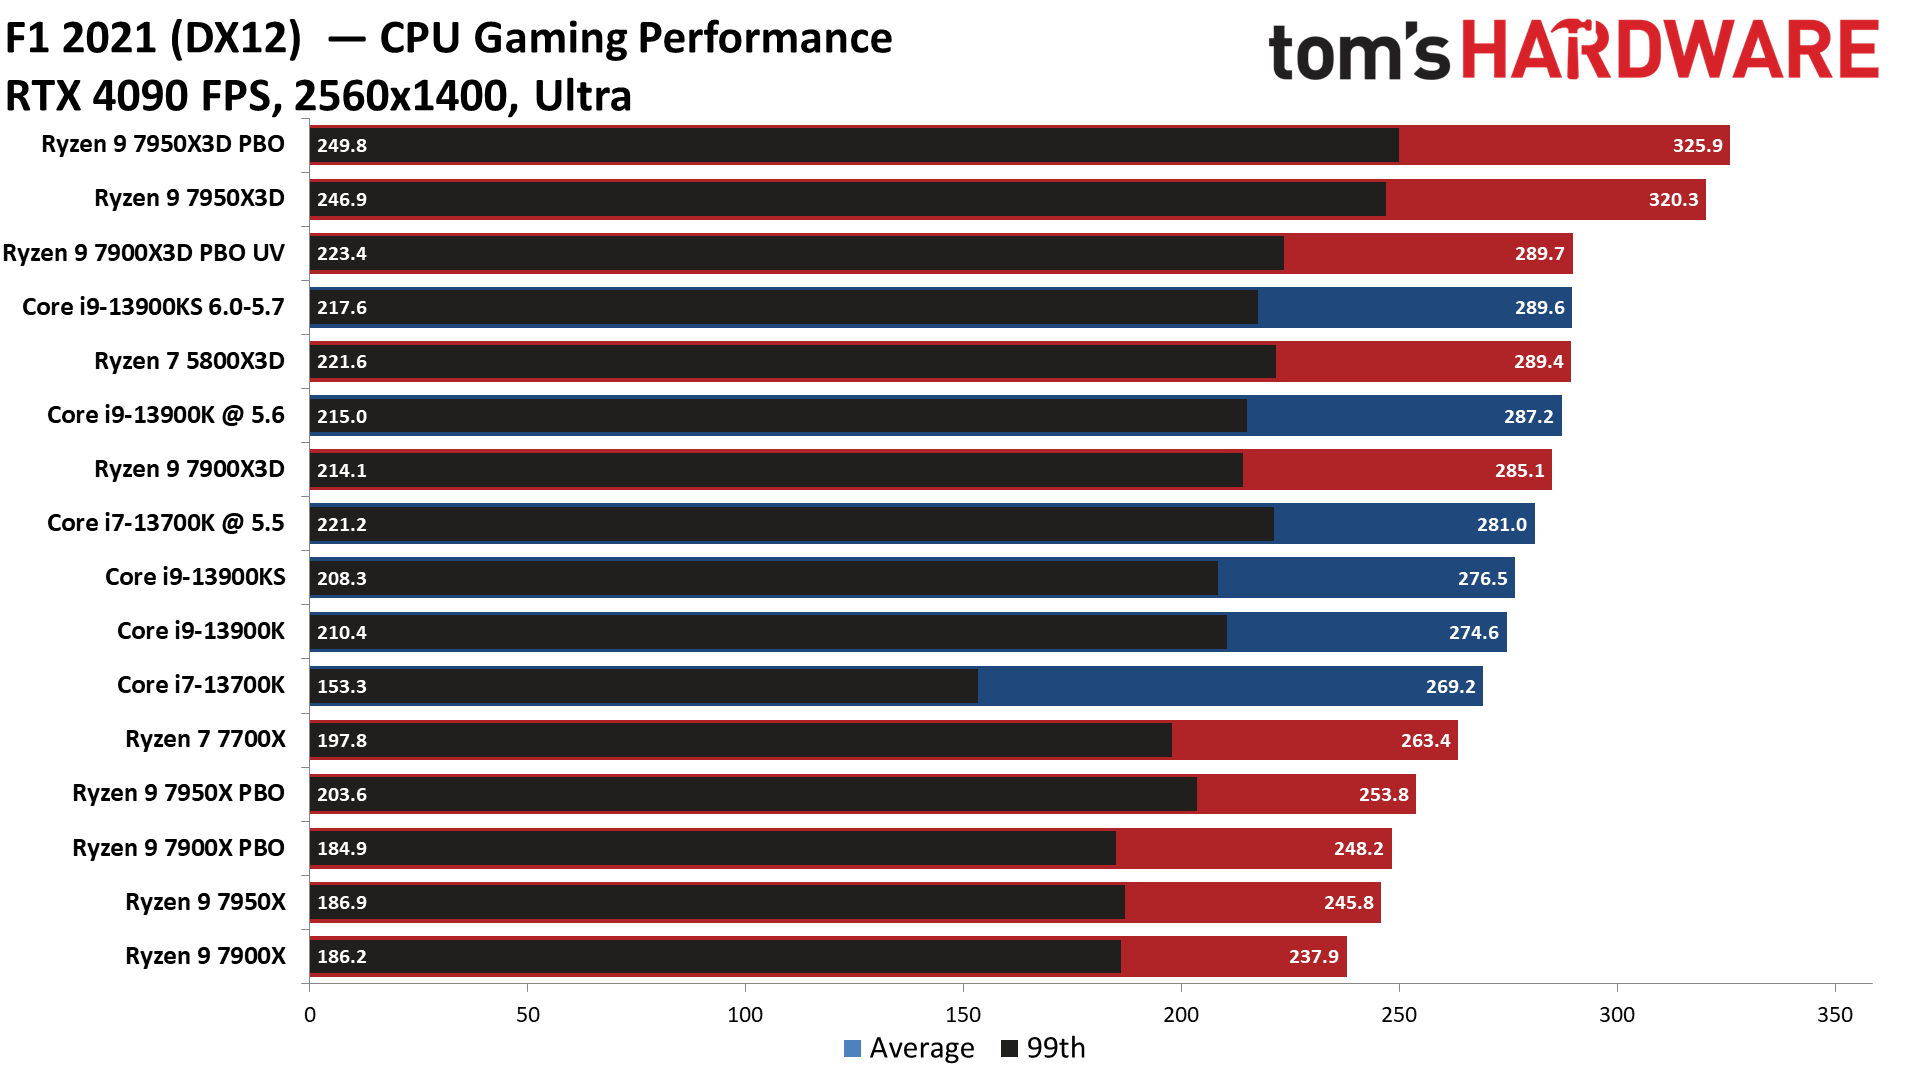
It’s obvious that F1 2021 enjoys a massive boost from the increased L3 capacity — the Ryzen 7 5800X3D with first-gen 3D V-Cache was an incredible 44% faster than its non-V-Cache counterpart, the Ryzen 7 5800X. We don’t see the same amount of gain with the 7900X3D, but its 19% lead over the 7900X is still sizeable.
Hitman 3 Benchmarks on AMD Ryzen 9 7900X3D
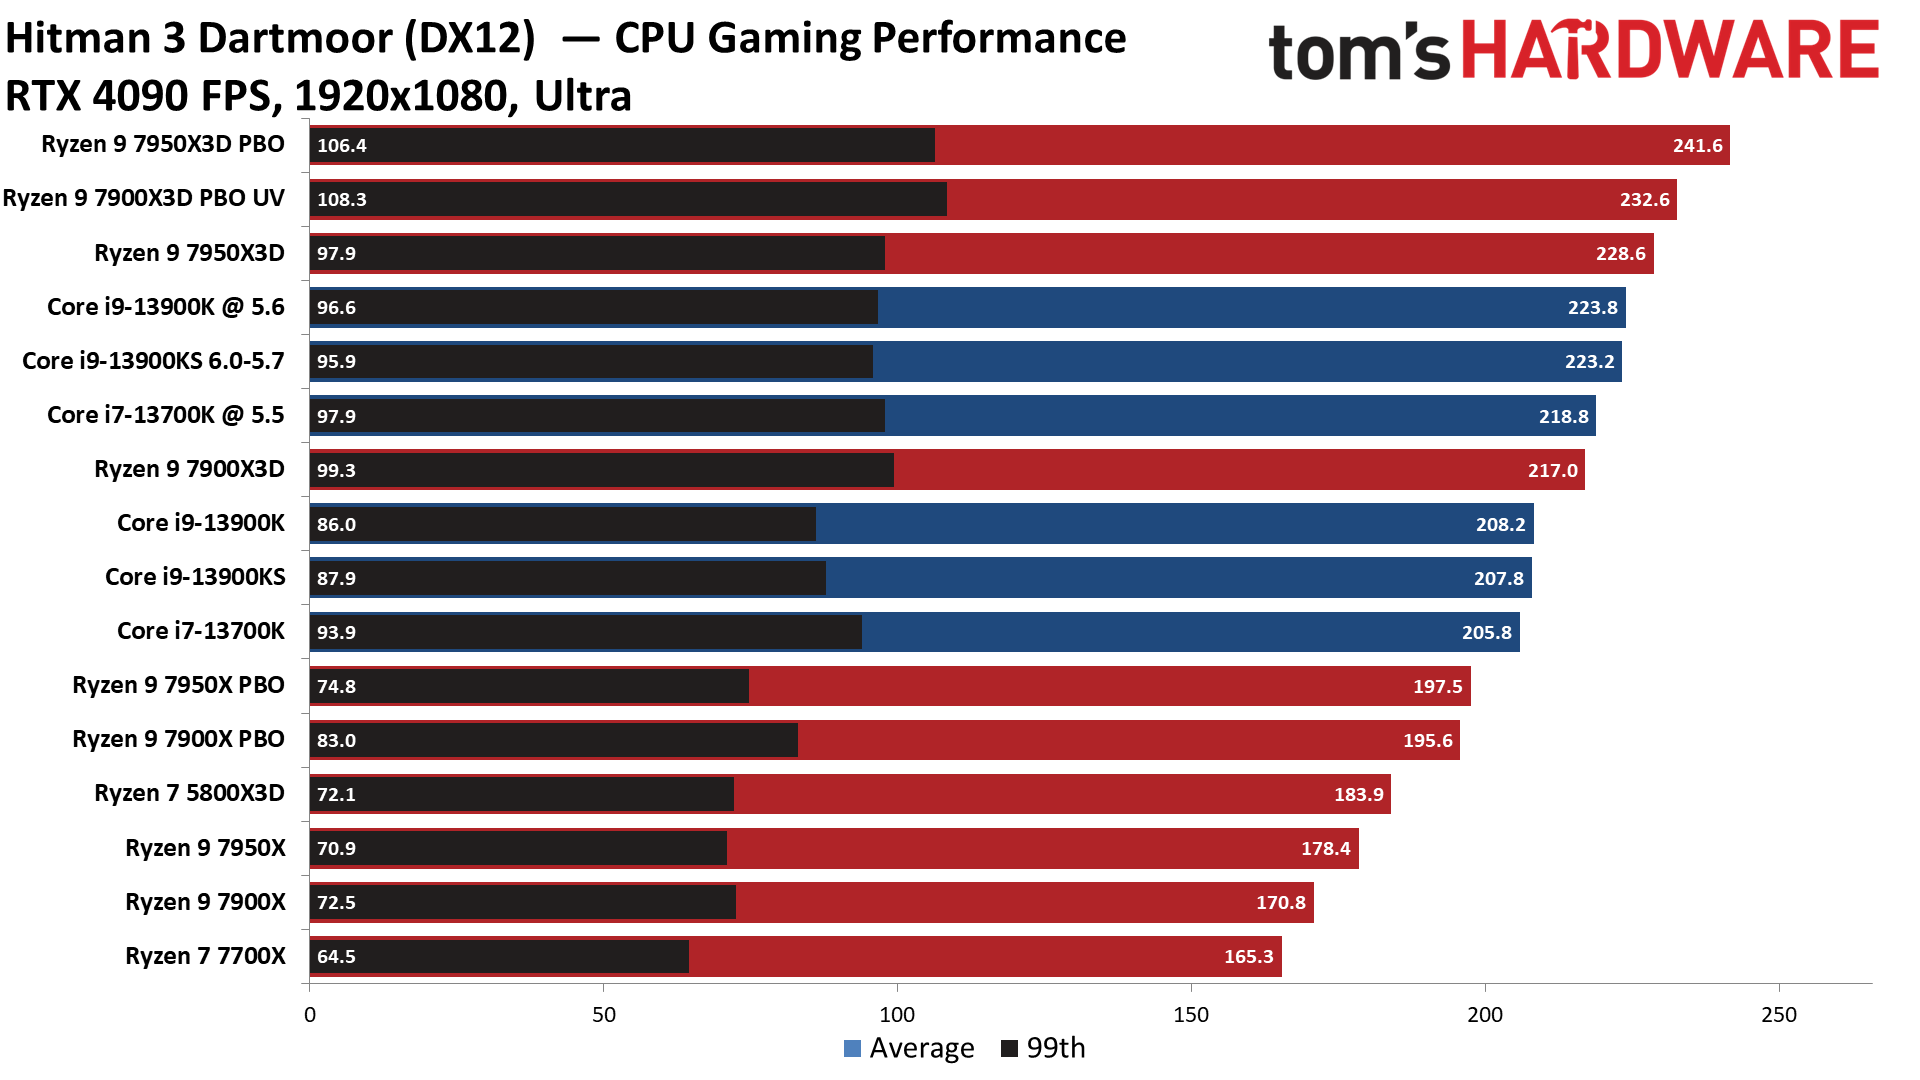
Hitman 3 is designed specifically to leverage the e-cores for certain game engine tasks, which has typically given Intel an advantage. However, the game also responds well to extra L3 cache.
Microsoft Flight Simulator 2021 Benchmarks on AMD Ryzen 9 7900X3D
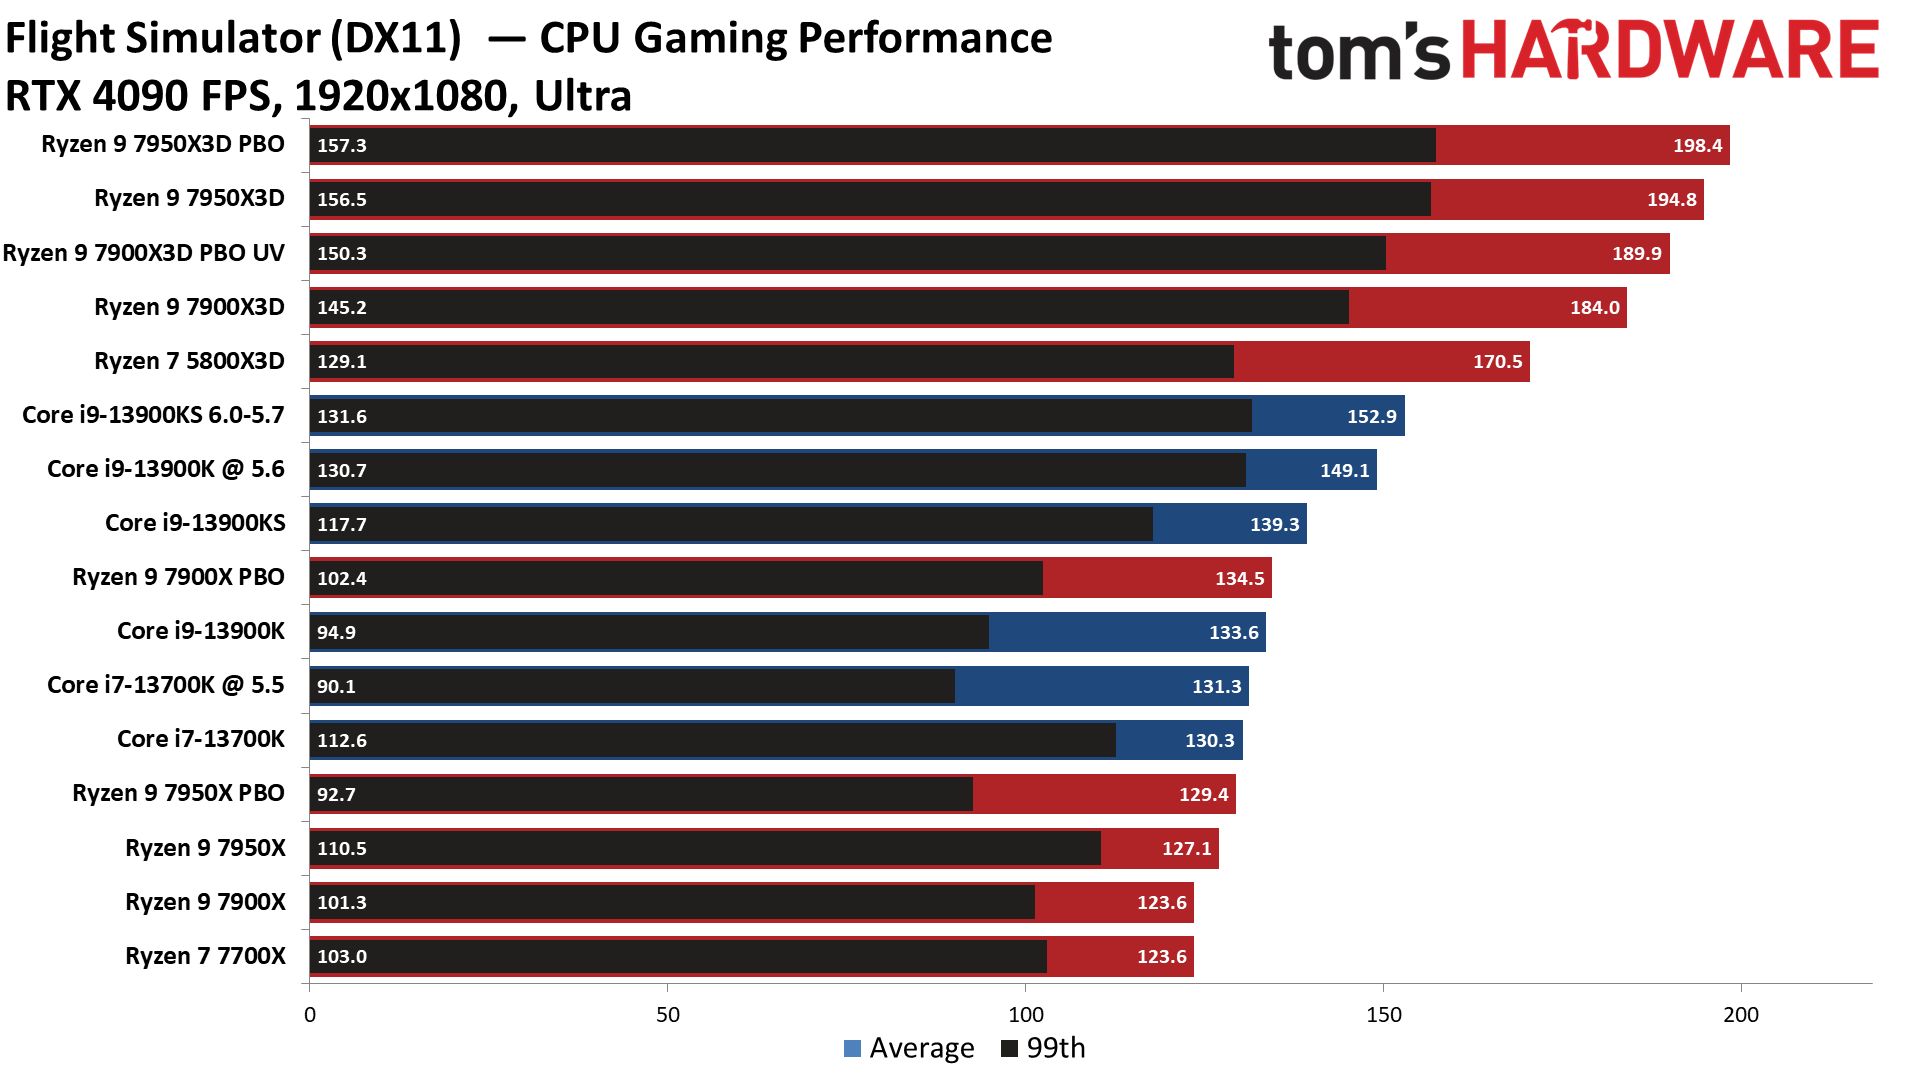
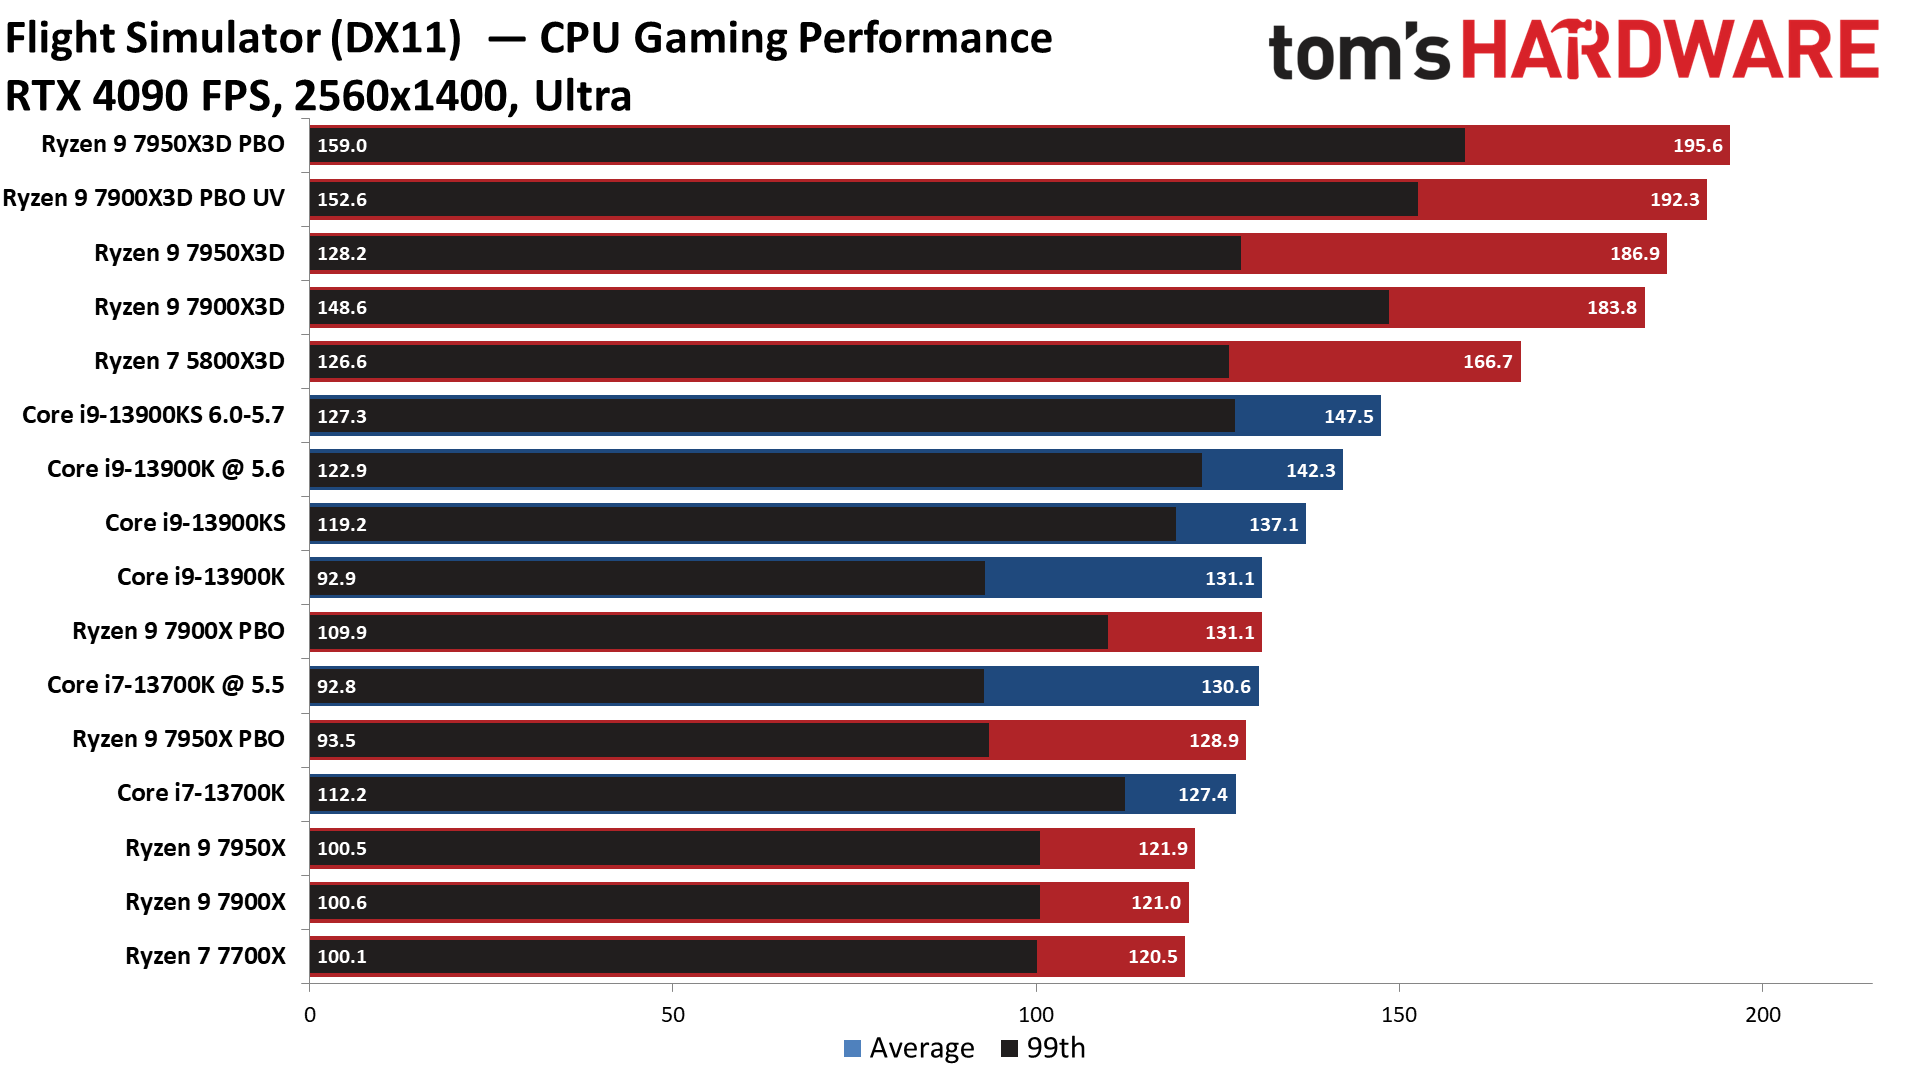
The 16-core 7950X3D’s performance in Microsoft Flight Simulator 2021 is almost unbelievable — the X3D chip is 53% faster than its vanilla counterpart, the 7950X, and 43% faster than the 13900K at stock settings. The 7900X3D is nearly just as impressive, being 49% faster than the vanilla 7900X and 37% faster than the 13900K.
Microsoft Flight Simulator 2021 obviously benefits tremendously from L3 cache, but that doesn't represent the 7900X3D's performance in all titles. This illustrates how outliers can make the 7900X3D seem more impressive in cumulative measurements, so be sure to examine performance in individual games.
Red Dead Redemption 2 Benchmarks on AMD Ryzen 9 7900X3D
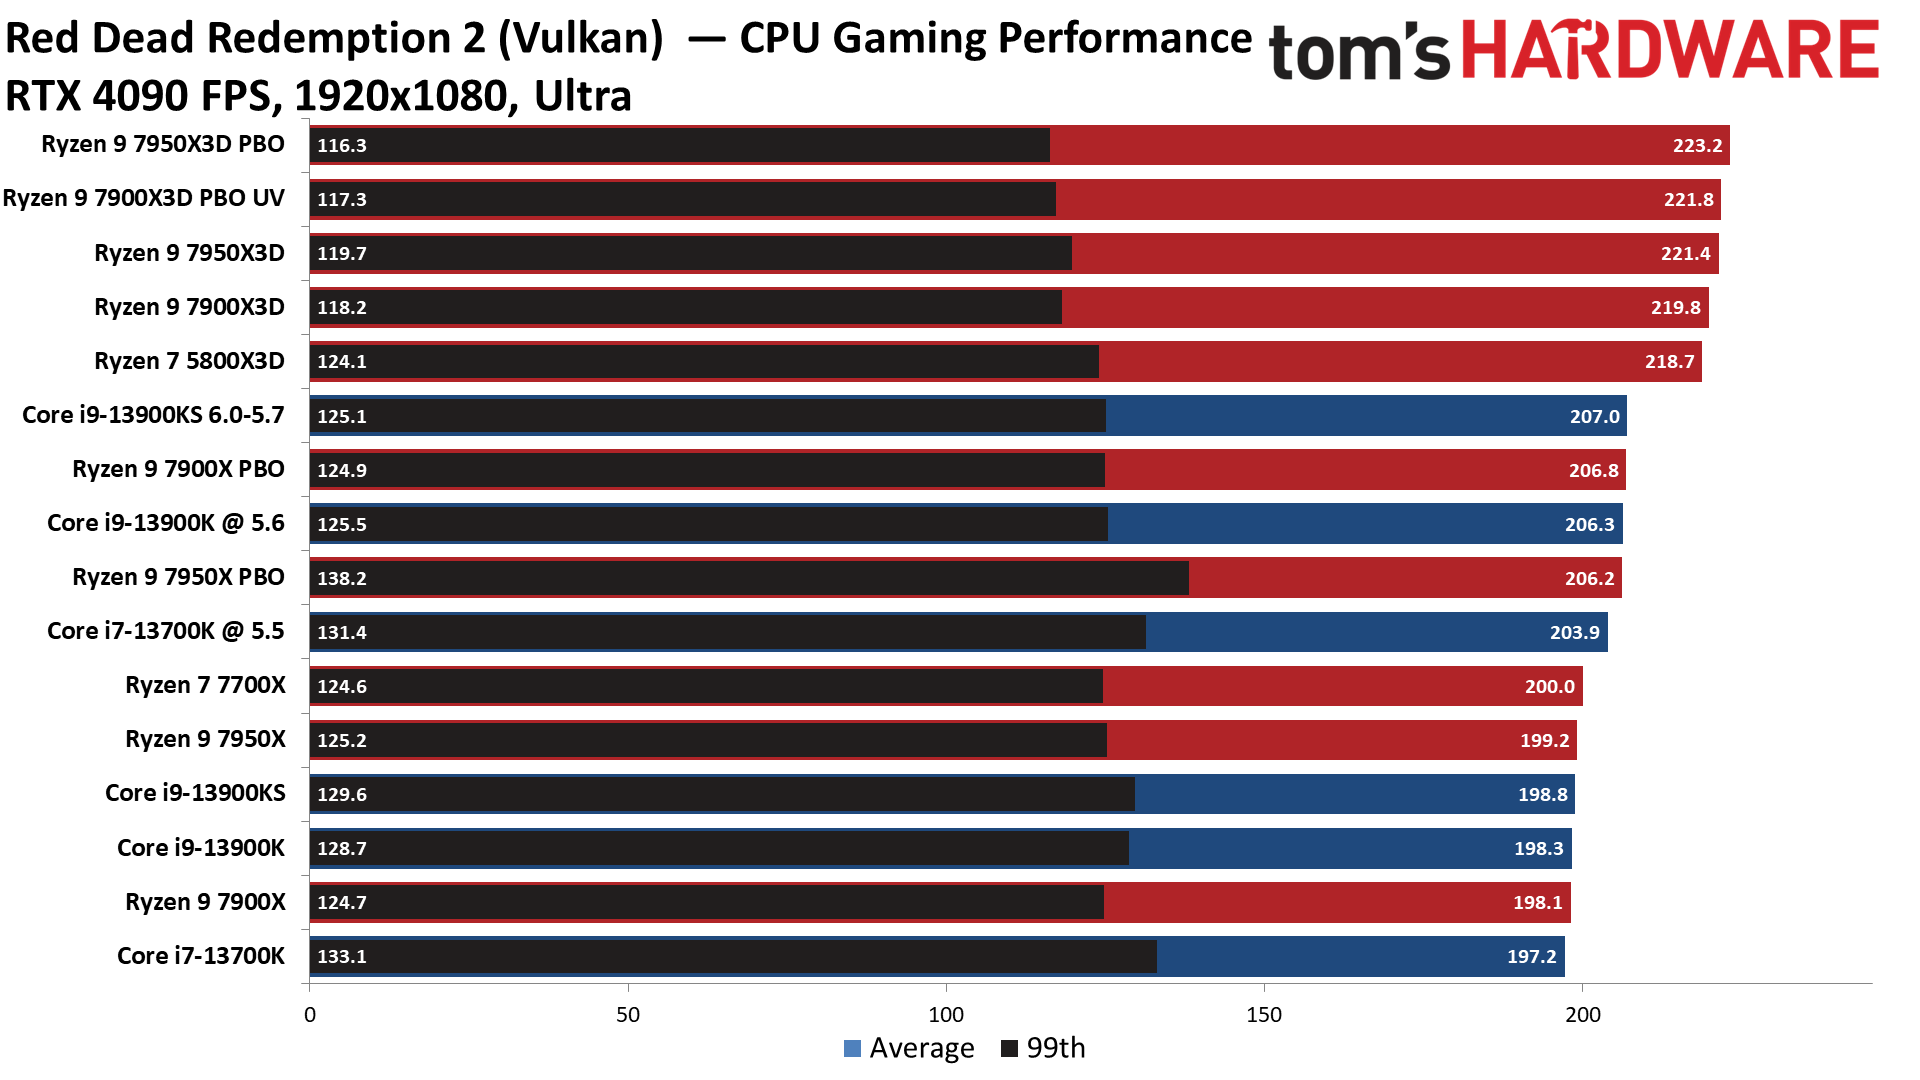
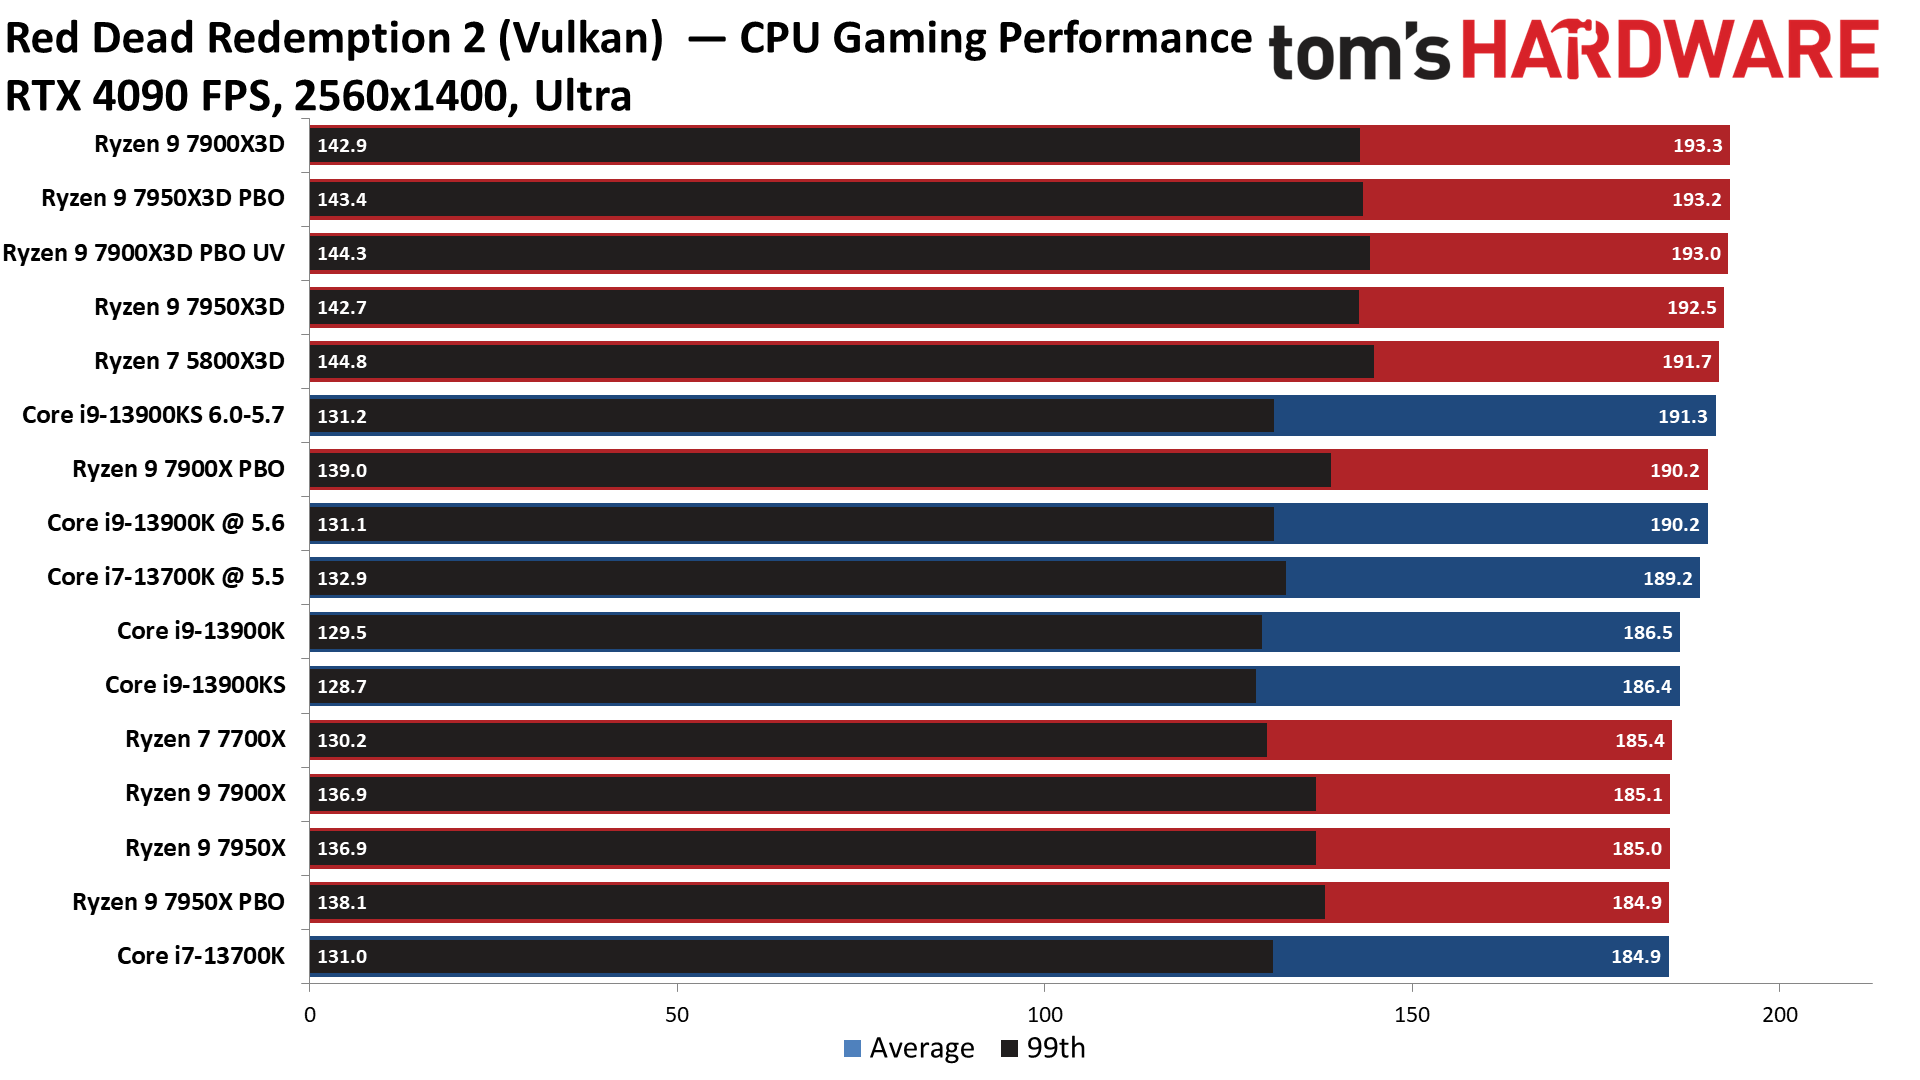
The Red Dead Redemption 2 chart splits into two clear classes, with the X3D chips delivering next-level performance compared to the Intel chips and standard Ryzen models. Notably, all of the X3D models are within 1% of each other here, including the Zen 3-powered 5800X3D, so it is clear that the L3 cache delivers the overwhelming amount of the uplift in this title.
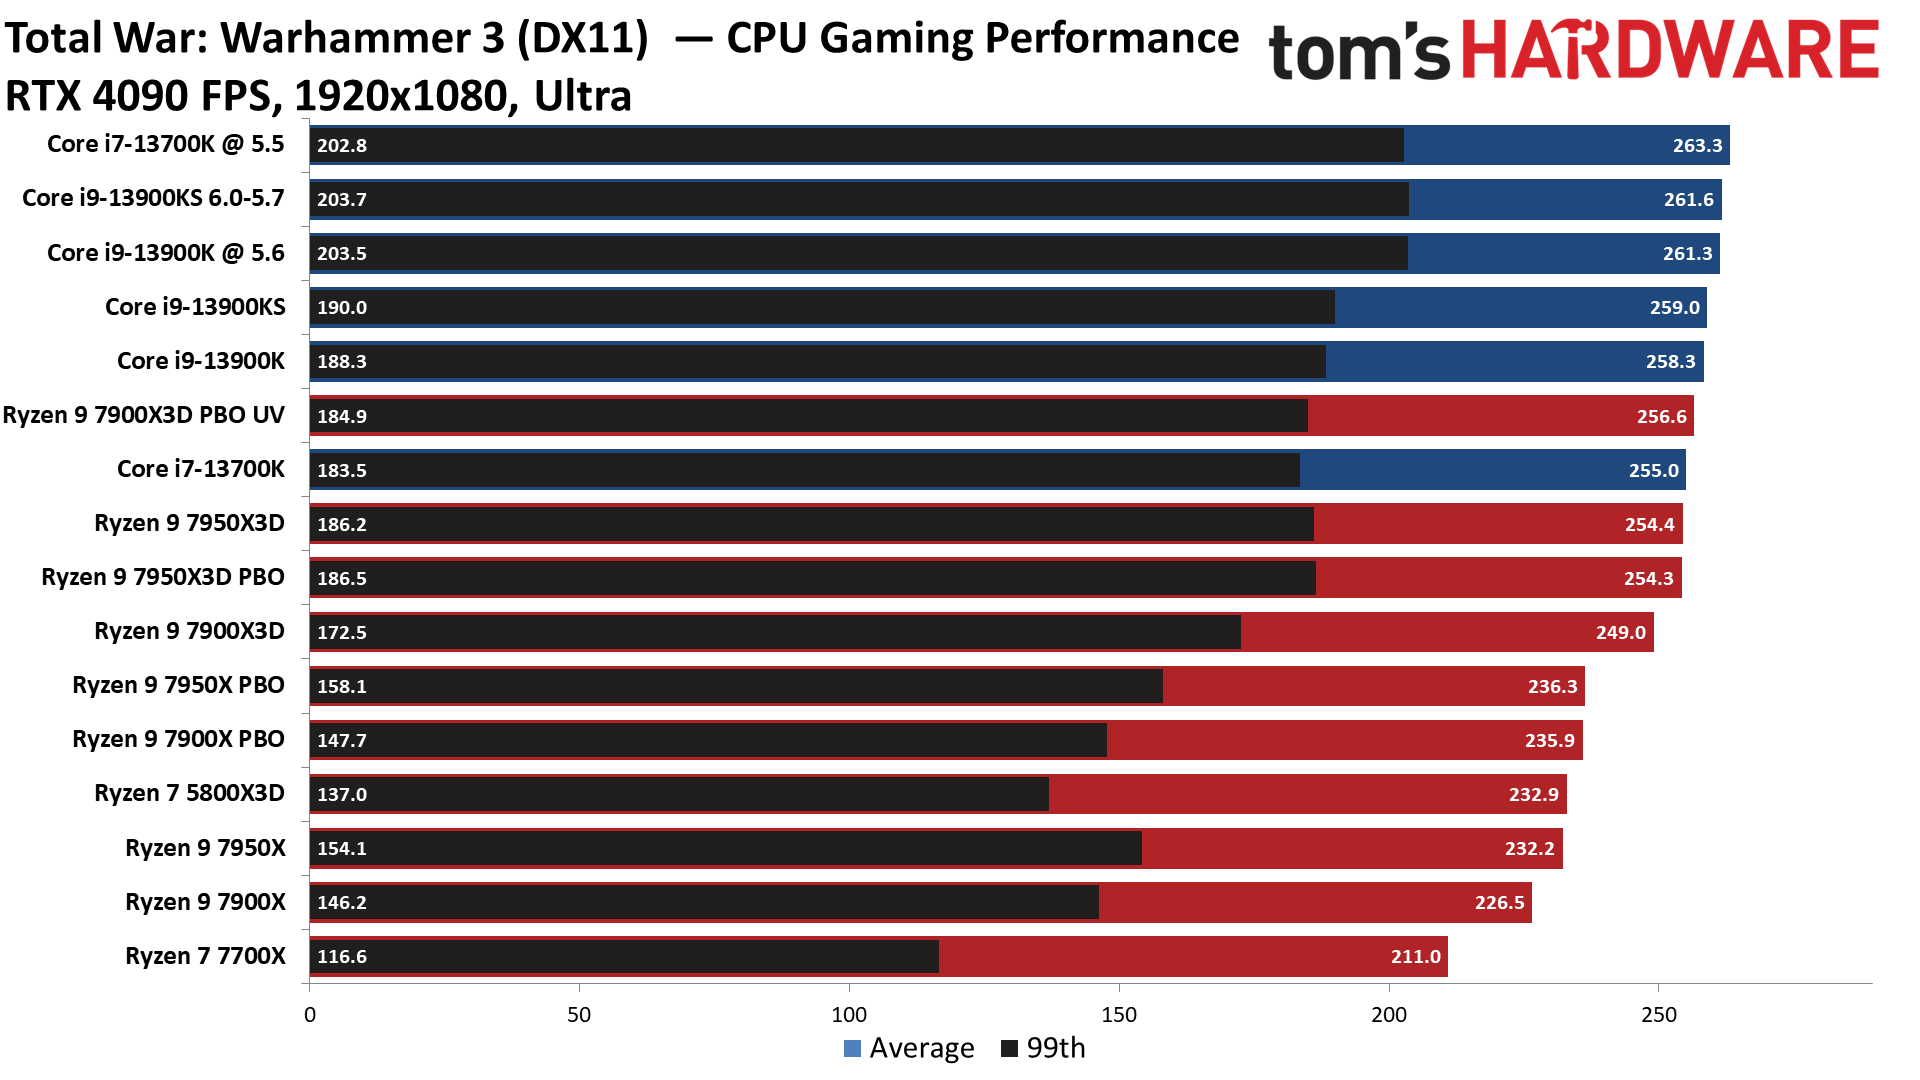
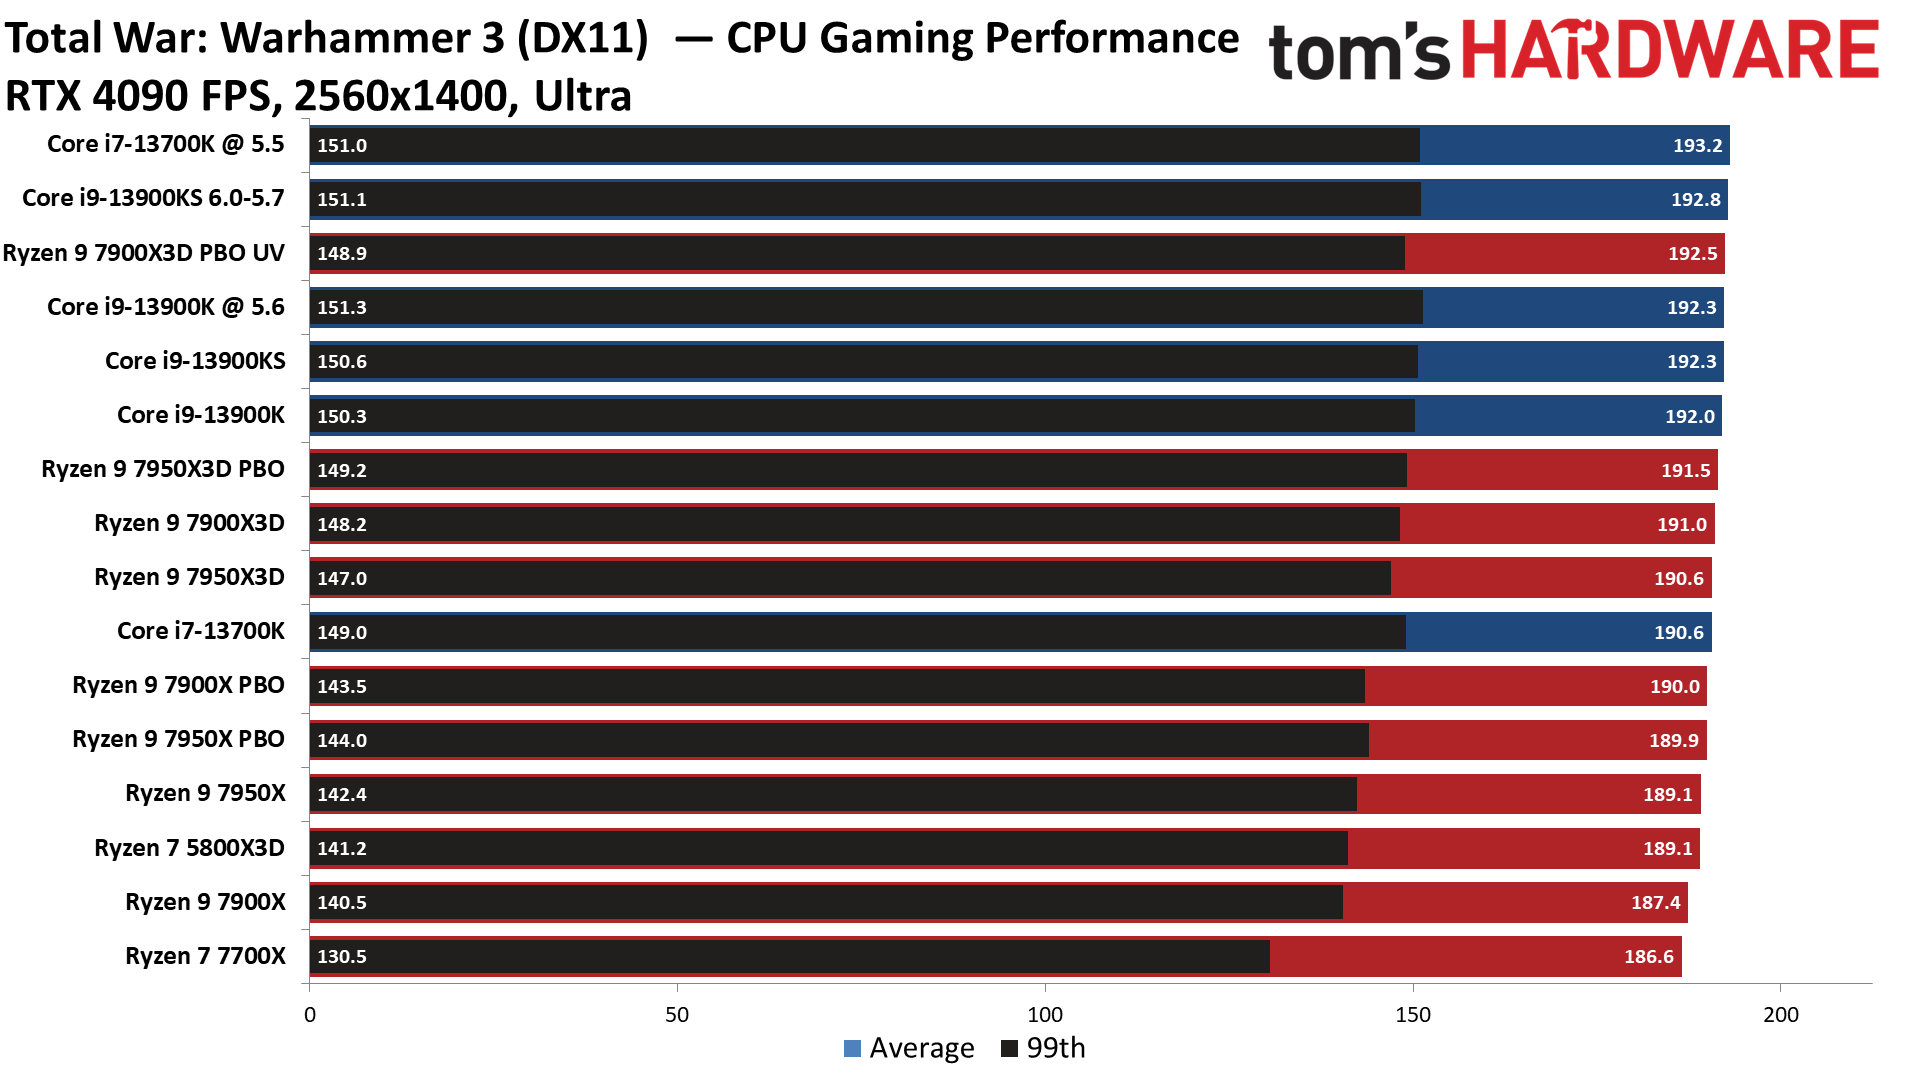
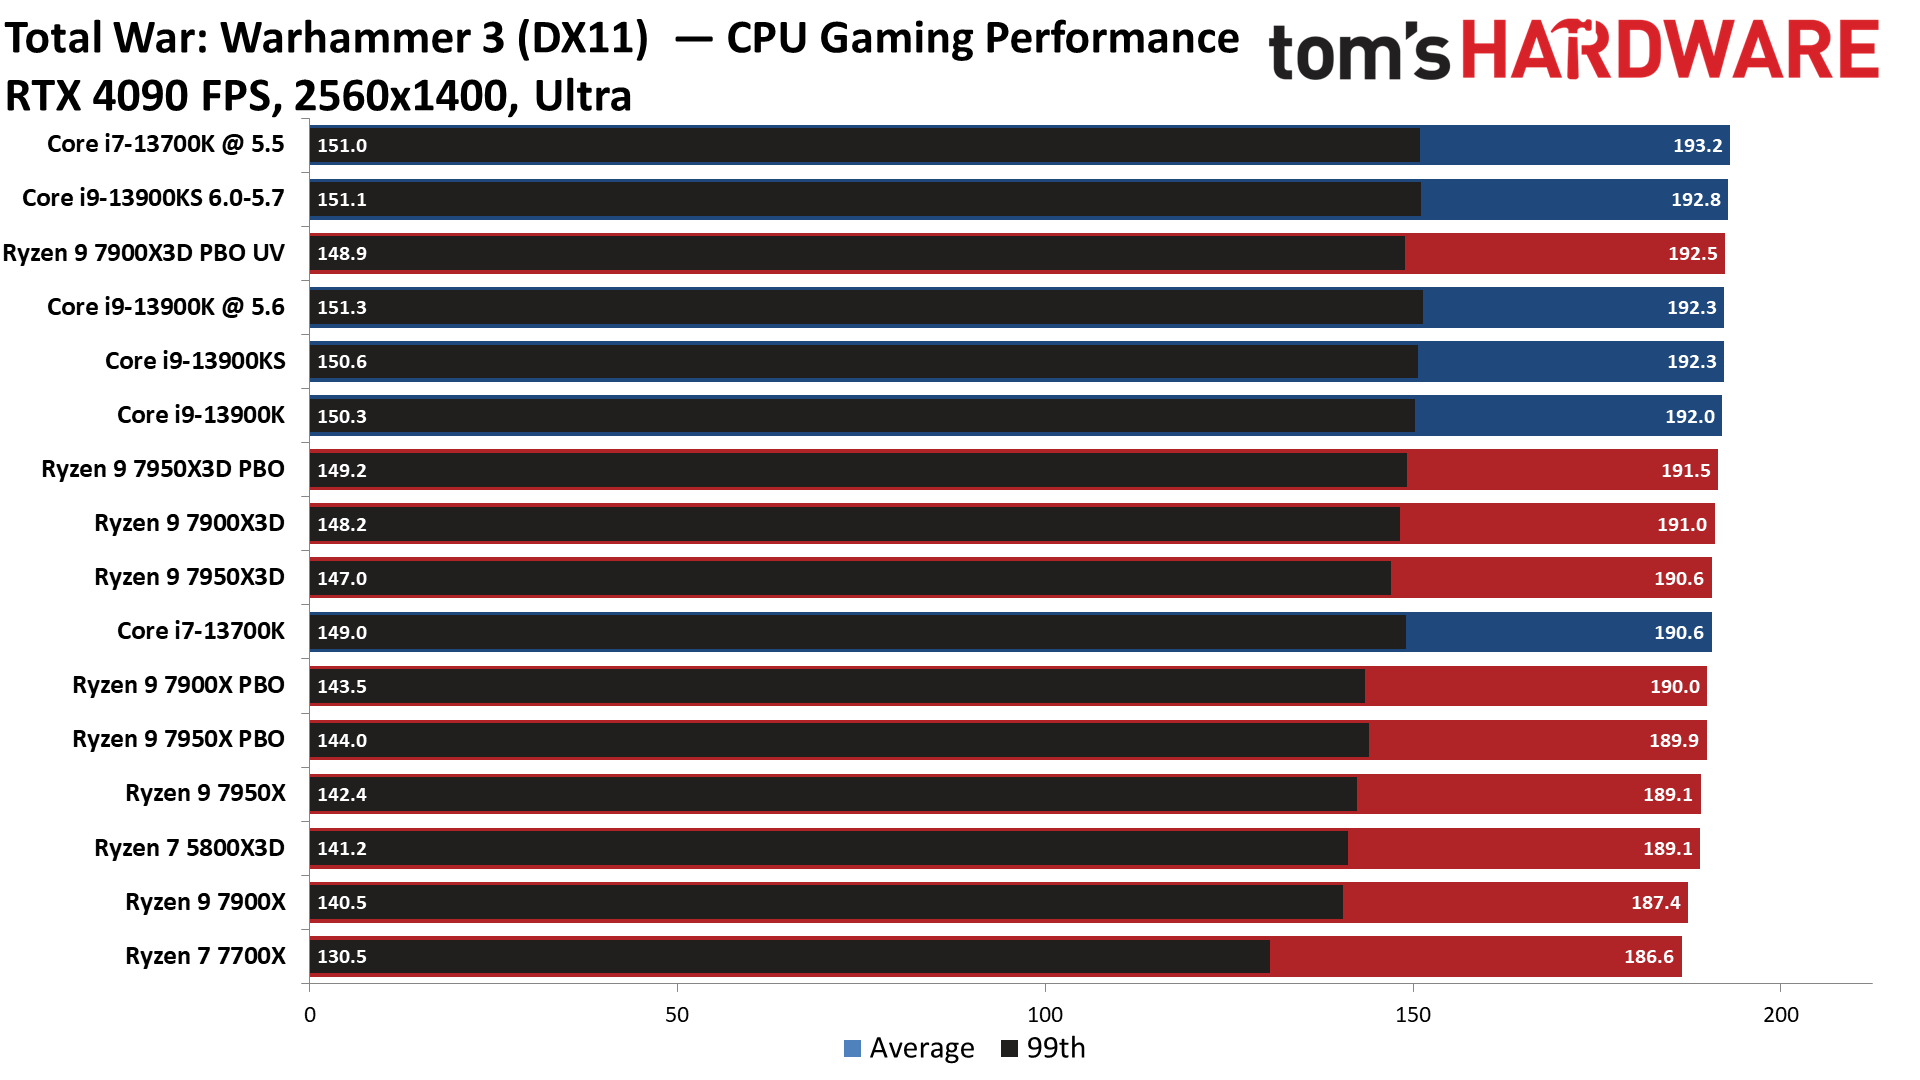
Warhammer 3 Benchmarks on AMD Ryzen 9 7900X3D
Watch Dogs Legion Benchmarks on AMD Ryzen 9 7900X3D
Extra AMD Ryzen 9 7900X3D Game Benchmarks - GTA V, Project Cars 3, Shadow of the Tomb Raider, Far Cry 5, Borderlands 3
| Tom's Hardware - 1080p Extras | Ryzen 9 7900X3D | 7900X3D vs 13900K | 7900X3D vs 7950X3D | Ryzen 9 7950X3D | Core i9-13900K |
| Grand Theft Auto V | 182.4 fps | -1.7% | Tie | 182.4 fps | 185.5 fps |
| Project Cars 3 | 340.6 fps | +15.5% | -4.8% | 357.6 fps | 295 fps |
| Shadow of the Tomb Raider | 309.3 fps | +12.6% | -6.9% | 332.2 fps | 274.6 fps |
| Borderlands 3 | 227.7 fps | +22.2% | -1.7% | 231.6 fps | 186.4 fps |
| Horizon Zero Dawn | 241.9 fps | +11% | -8.6% | 264.7 fps | 218 fps |
After seeing some of the large deltas in our test suite, we decided to expand our view to a few more game titles that we don't normally test. We threw together this quick table to give a basic view of a different mix of game titles with stock processor settings.
These numbers aren't reflected in our overall geometric mean listed above but provide further context. The Ryzen 9 7900X3D provides 13900K-beating performance in a broad range of titles, with results ranging from -1.7% to +22.2%.
- MORE: Best CPU for gaming
- MORE: CPU Benchmark Hierarchy
- MORE: Intel vs AMD
- MORE: How to Overclock a CPU
Current page: AMD Ryzen 9 7900X3D Gaming Benchmarks
Prev Page AMD Ryzen 9 7900X3D: Power Consumption, Overclocking, Efficiency, Test Setup Next Page AMD Ryzen 9 7900X3D Productivity Benchmarks
Paul Alcorn is the Editor-in-Chief for Tom's Hardware US. He also writes news and reviews on CPUs, storage, and enterprise hardware.
-
Brian D Smith -No support for DDR4 memoryReply
LOL...that's like saying a horse cannot use an elephant's saddle. Seriously, why even say that as a negative? Oh...it's Paul. -
Giroro I question the point of a non-flagship gaming CPU when nobody is making a non-flagship gaming GPU.Reply -
logainofhades ReplyGiroro said:I question the point of a non-flagship gaming CPU when nobody is making a non-flagship gaming GPU.
The 7900xt, 4070ti, and 4080 are not flagship models. That would be the 7900xtx and the 4090. -
Metteec Brian D Smith: I get your point, but the Intel i9-13900K (the competitor to the Ryzen 9 7900X3D) supports both DDR4 and DD5. Therefore, Paul's feedback on this particular issue is warranted. AMD's design decision to switch exclusively to DDR5 is a detractor to many buyers, including myself, who would have upgraded their CPUs but can't because they would have to invest in DDR5. Conversely, Intel has eased the transition its 12th generation processor by offering compatible motherboards with either DDR4 or DDR5.Reply
I would guess that Intel's 14th generation will ditch DDR4 for good, but as of now, DDR4 compatibility is one thing that the i9-13900K has going for it over the Ryzen 9 7900X3D.
Disclosure: I hold positions in both Intel and AMD stock and use predominantly AMD products. -
2Be_or_Not2Be I wonder how the upcoming single-CCD 7800X3D will perform. I like that it's a single-CCD CPU vs the dual-CCD in the 7950/7900X3D. If it can boost to 5.6GHz, despite the official boost rating only showing 5.0GHz, then that could potentially be the best of both worlds (gaming & application, when app not limited by # of cores).Reply -
2Be_or_Not2Be ReplyMetteec said:Disclosure: I hold positions in both Intel and AMD stock and use predominantly AMD products.
Disclosure: I am currently losing money with positions in both Intel and AMD stock and use predominantly AMD products. :) -
Maebius My crystal ball foresees that after a while (a few months) , the 7900X3D will be very very closely (street)priced to the 7800X3D.Reply -
jeremyj_83 Reply
13th Gen supports DDR4 because it is socket compatible with 12th Gen. Making 13th Gen DDR5 only would have meant that Z690 (and other 12th Gen chipsets) only supported 1 CPU version. As of late Intel has made it such that chipsets support 2 generations of CPUs. When 12th Gen came out, it made sense for there to be DDR4 support as DDR5 was at a huge price premium. Fast forward to now and the price premium over DDR4 is much lower, still not 1:1 but..., so supporting 2 memory types is only for socket compatibility for Intel's standard 2 generations. Had Intel gone DDR5 only on 13th Gen we probably would have seen DDR5 prices drop much faster than they already are.Metteec said:Brian D Smith: I get your point, but the Intel i9-13900K (the competitor to the Ryzen 9 7900X3D) supports both DDR4 and DD5. Therefore, Paul's feedback on this particular issue is warranted. AMD's design decision to switch exclusively to DDR5 is a detractor to many buyers, including myself, who would have upgraded their CPUs but can't because they would have to invest in DDR5. Conversely, Intel has eased the transition its 12th generation processor by offering compatible motherboards with either DDR4 or DDR5.
I would guess that Intel's 14th generation will ditch DDR4 for good, but as of now, DDR4 compatibility is one thing that the i9-13900K has going for it over the Ryzen 9 7900X3D.
Disclosure: I hold positions in both Intel and AMD stock and use predominantly AMD products. -
Roland Of Gilead Reply
Agree with you for the most part, but this idea that DDR5 is a killer for any consumers and having to go with AMD (without choice) for Zen4/AM5 doesn't add up. DDR4 support for Intel's current 13th Gen ends with Raptor. (maybe a Raptor -s not known yet). Meteor or next desktop is exclusively DDR5. Add to that, that AMD will support maybe 3/4 new CPU's on the same socket. Intel don't do that. The cost upfront, of maybe 100-150, sure does make up for not having to upgrade on Intel every two years.Metteec said:Brian D Smith: I get your point, but the Intel i9-13900K (the competitor to the Ryzen 9 7900X3D) supports both DDR4 and DD5. Therefore, Paul's feedback on this particular issue is warranted. AMD's design decision to switch exclusively to DDR5 is a detractor to many buyers, including myself, who would have upgraded their CPUs but can't because they would have to invest in DDR5.
For what it's worth, I'd rather have a socket that lasts 4-5 years, and allow for simple drop in upgrades, that are and can be substantive. -
DavidLejdar I am avoiding the 7900X3D. Some games like to use up to 8 cores (when they are available), and the 6+6 setup means that some workload gets directed to 2 additional cores on the second CCD. This doesn't mean a stutter-fest. But what's the point (for gaming as such), when the 7800X3D may actually deliver better gaming performance, having 8 cores with 3D V-Cache?Reply
I think it is fair to point out that the CPU goes only with DDR5. But it would also be fair to run some tests comparing gaming performance of e.g. the 13900K with DDR4 and DDR5, as the charts seem to be presenting the performance with DDR5 only, which then makes it a somewhat moot point to say: "And this one can use DDR4 as well, which is a huge plus.", without then elaborating whether a DDR4 rig does deliver the same performance as a cheaper CPU with DDR5 perhaps may, etc.Metteec said:I would guess that Intel's 14th generation will ditch DDR4 for good, but as of now, DDR4 compatibility is one thing that the i9-13900K has going for it over the Ryzen 9 7900X3D.
