ASRock X399M Taichi Review: TR4 Goes Tiny
Why you can trust Tom's Hardware
Synthetics, Applications and Gaming Performance
1950X Data: Synthetics, Applications & Games
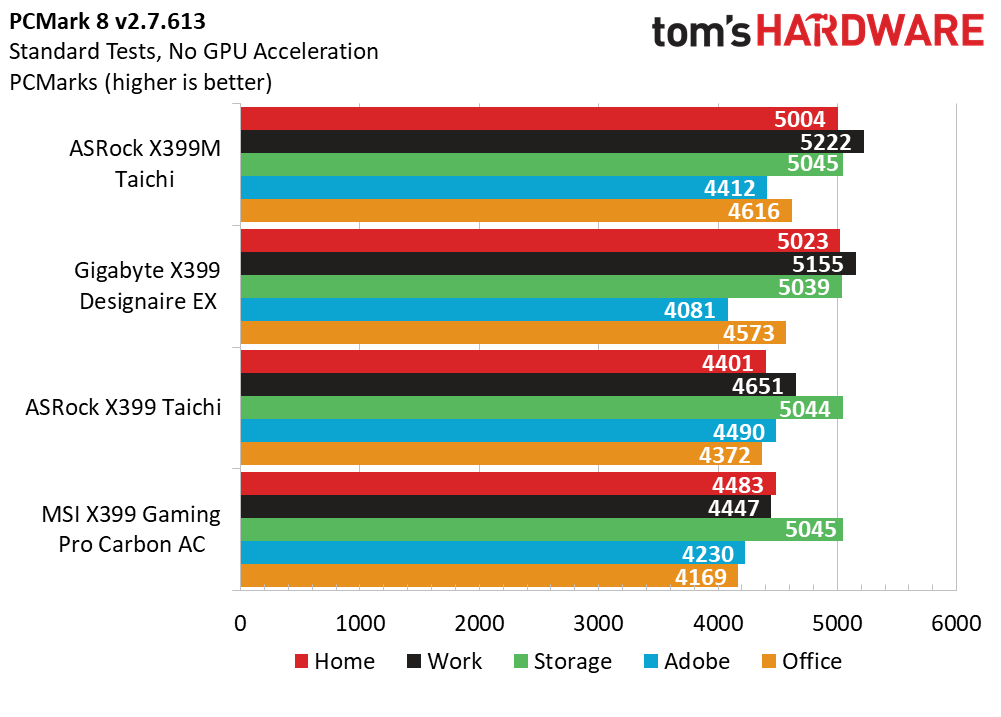
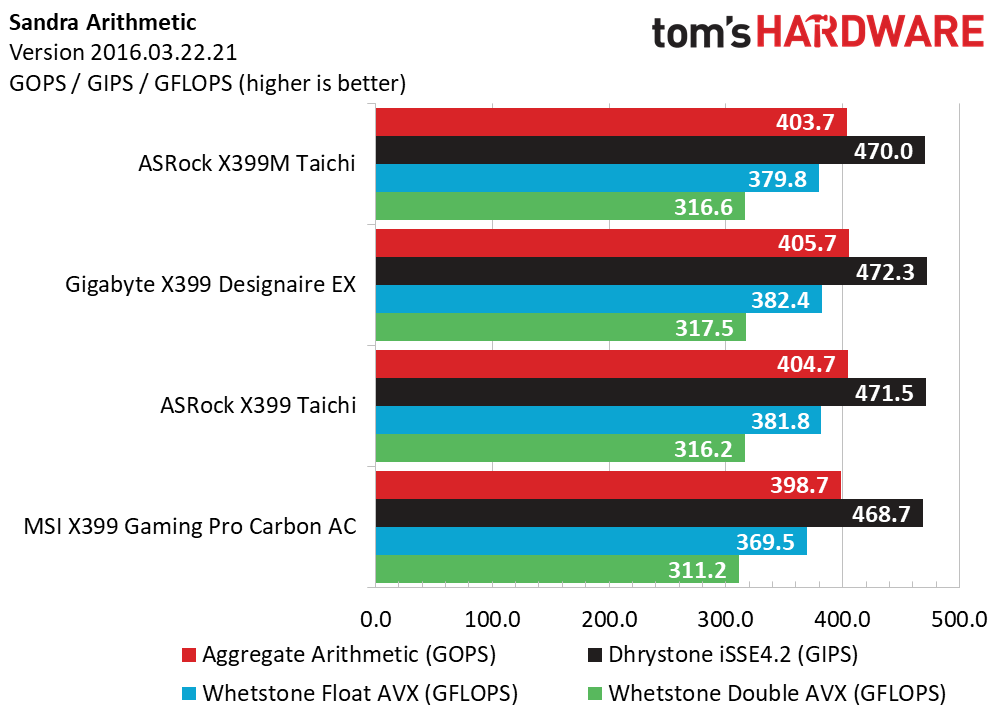
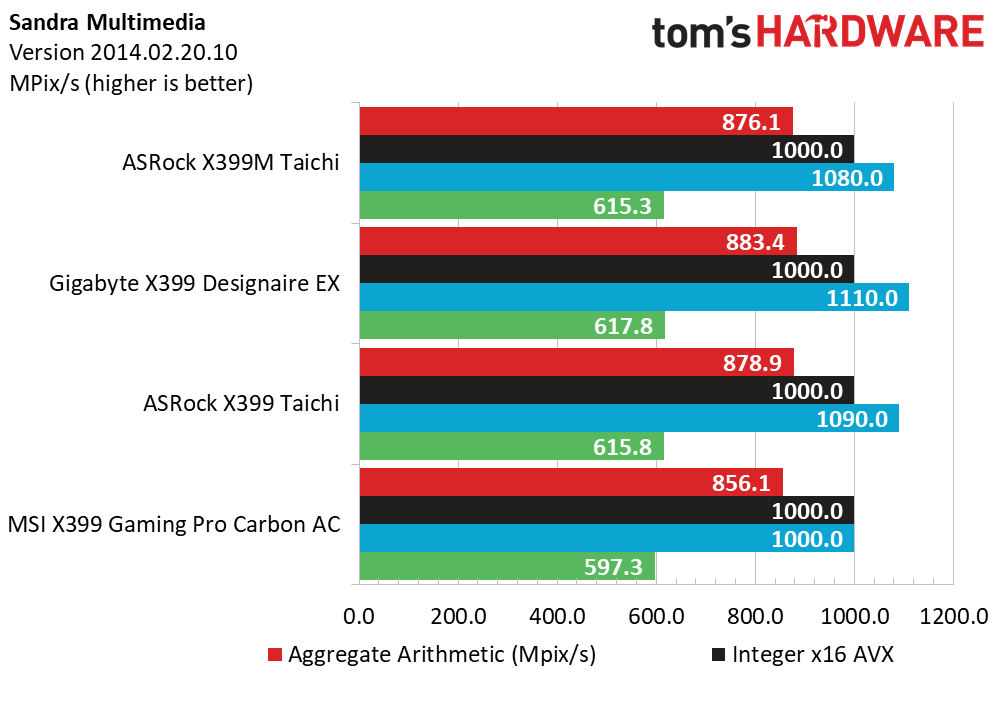
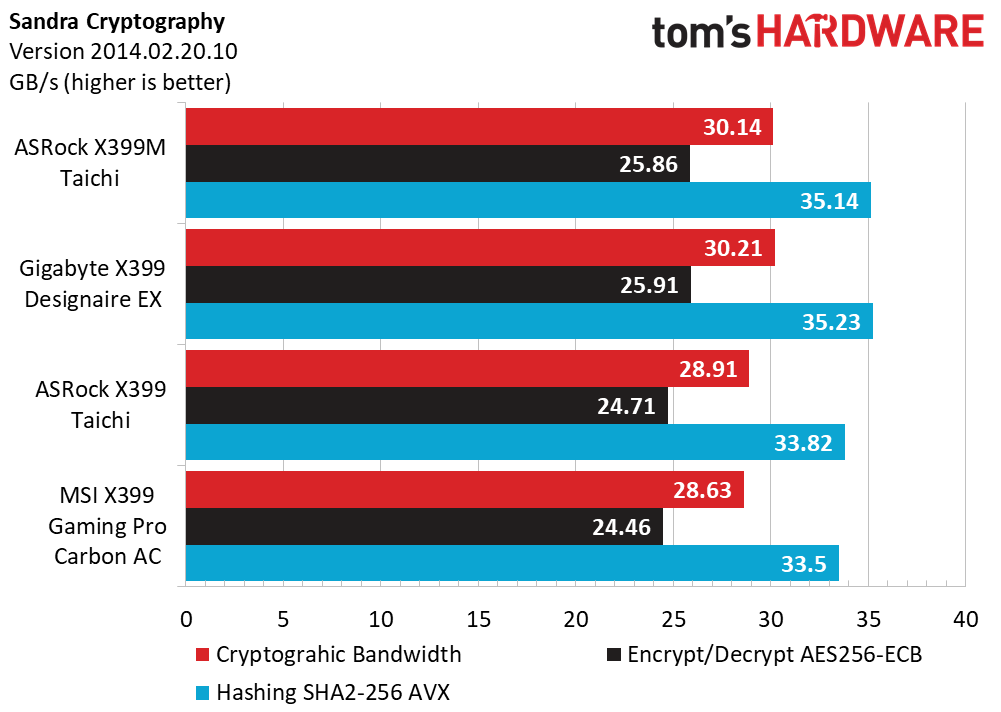
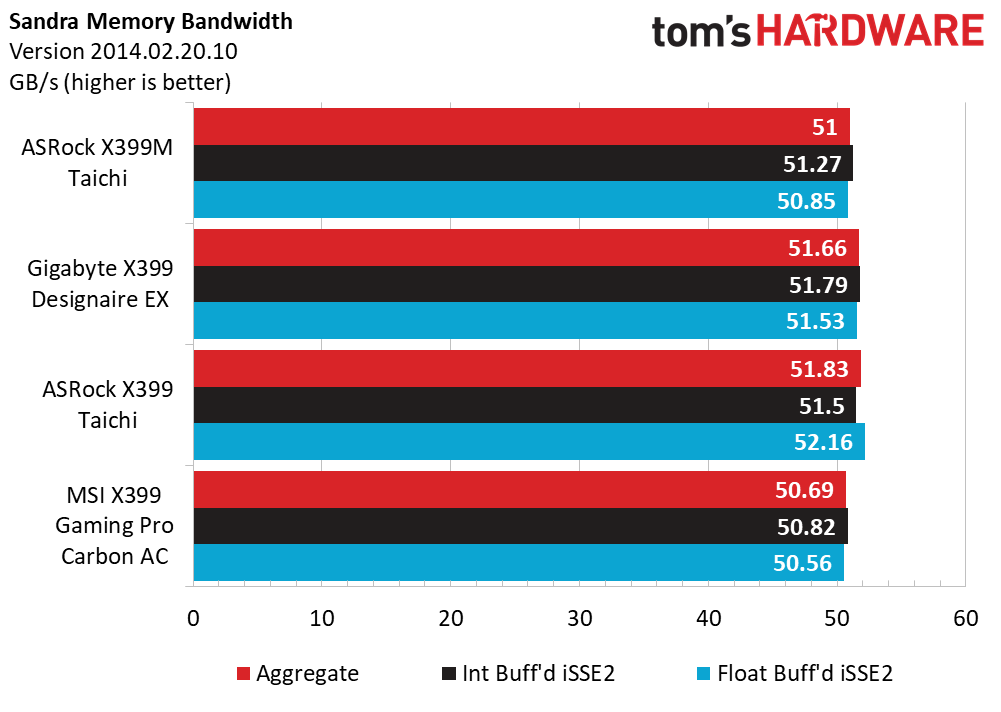
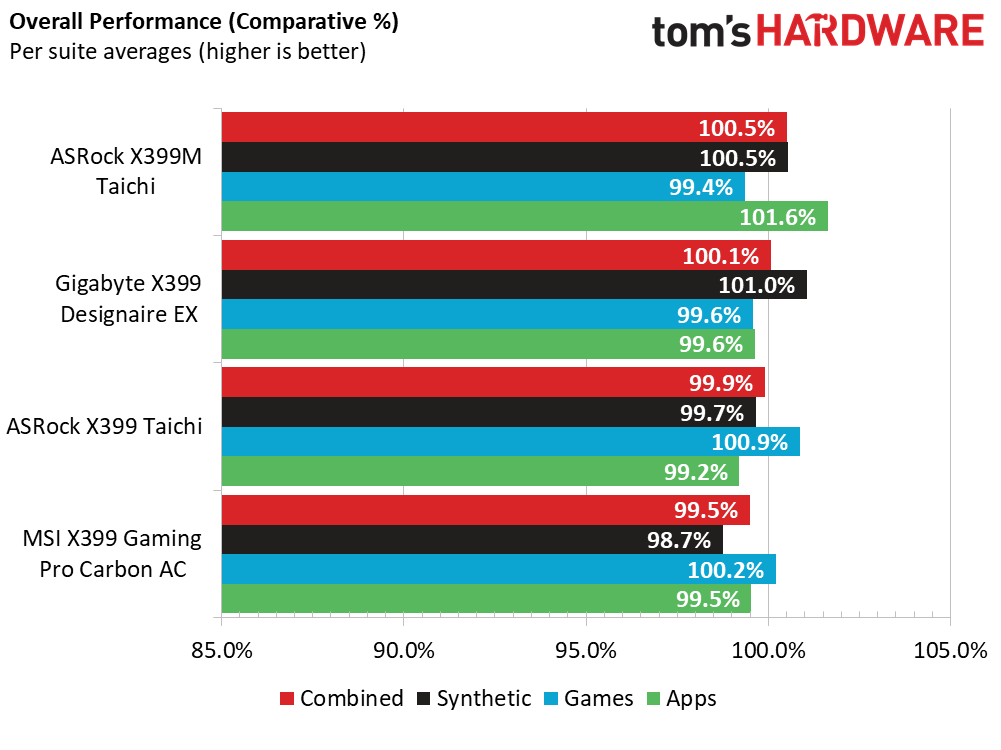
Our ASRock X399M and Gigabyte Designaire boards appear to enjoy favorable wins with the Home, Work, and Office benchmarks, likely in part due to driver or chipset changes over the past year, while Adobe and Storage benchmarks appear to be unaffected for the most part. However, Sandra shows consistent results in the Arithmetic, Multimedia, and Memory suites regardless of test execution date. Cryptography does show slight advantages to the more recent test samples, though the 5 percent spread is nearly negligible.
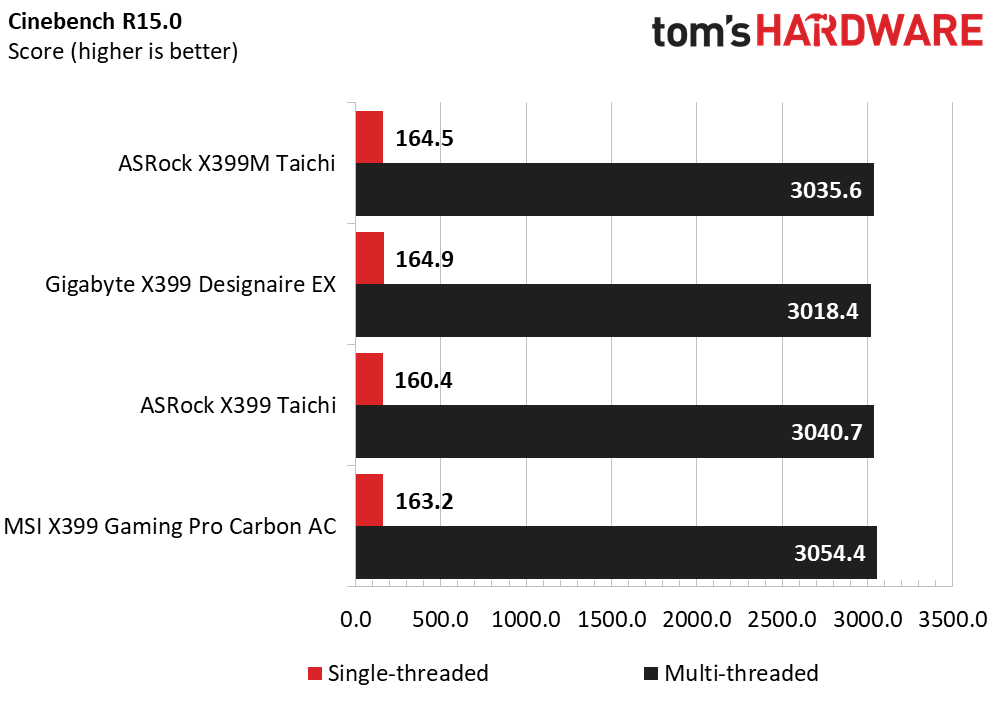
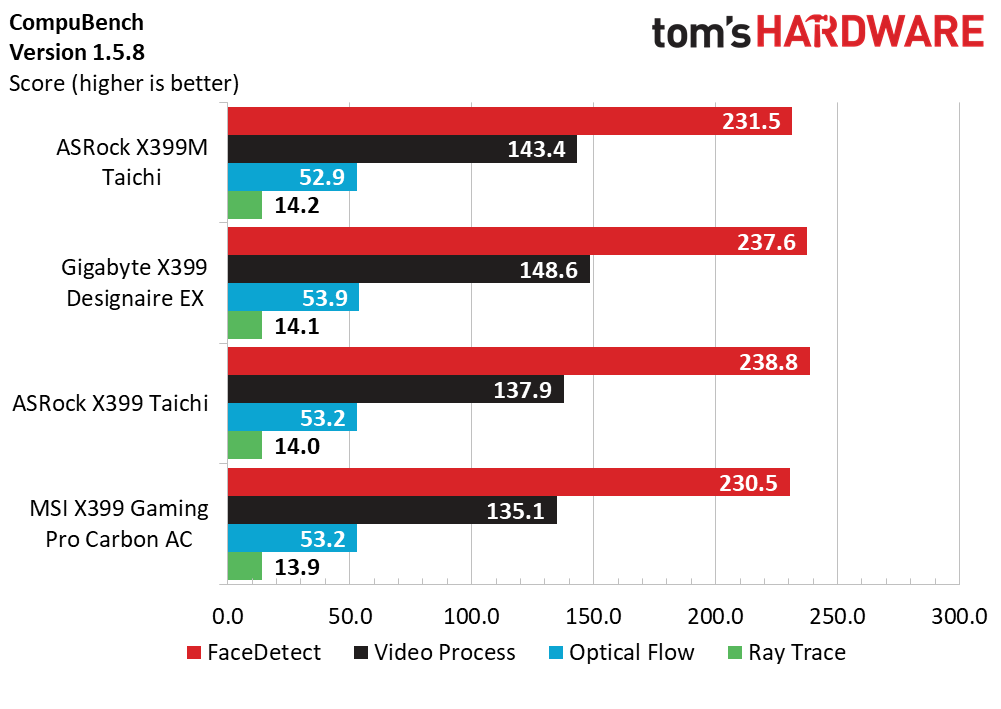
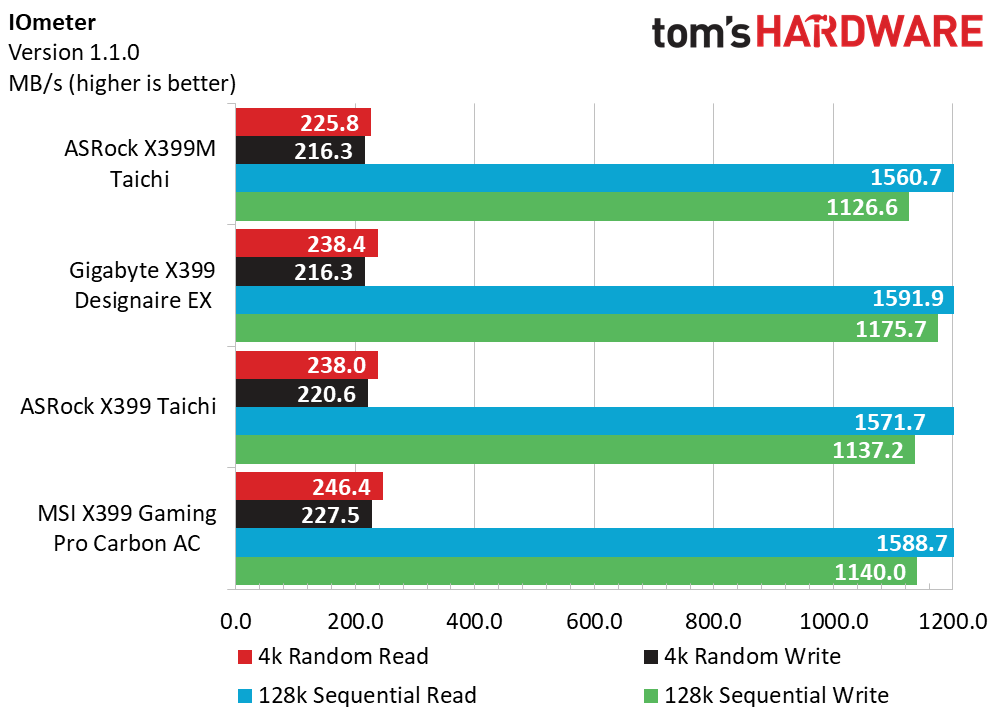
Everyone’s favorite multithreaded synthetic test these days is Cinebench. And the tiny X399M Taichi enjoys a second place win in single-threaded performance there, but slumps to third place with multi-threaded performance. Compubench shows similar preference in the Video Process workloads. But beyond that, all systems operate within range of 4 percent from first to the last place. IOmeter is our preferred storage benchmark for the Toshiba RD400 drives and there the X399M sees negative marks across the board by upwards of 8 percent from the leaders. This begs the question of whether we should believe PCMark or IOmeter when it comes to storage speed.
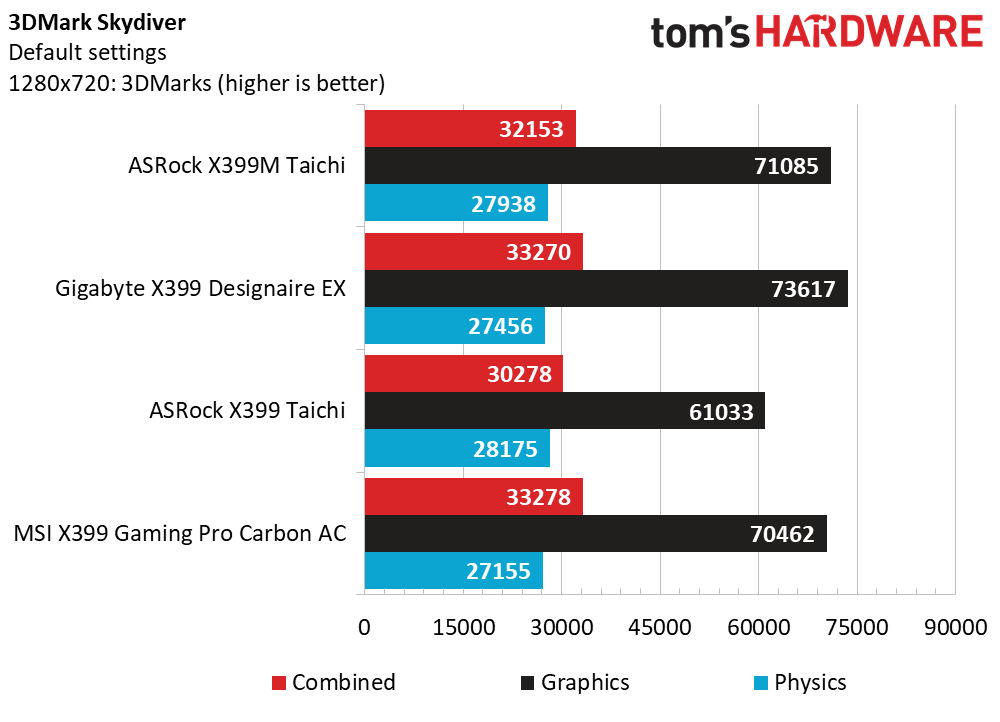
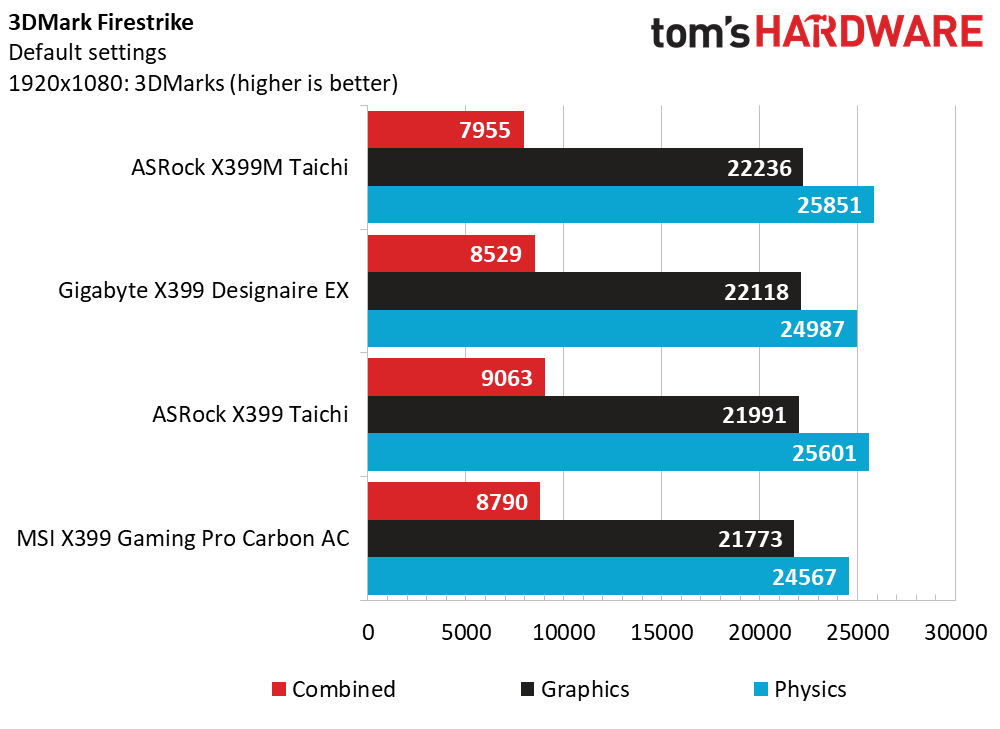
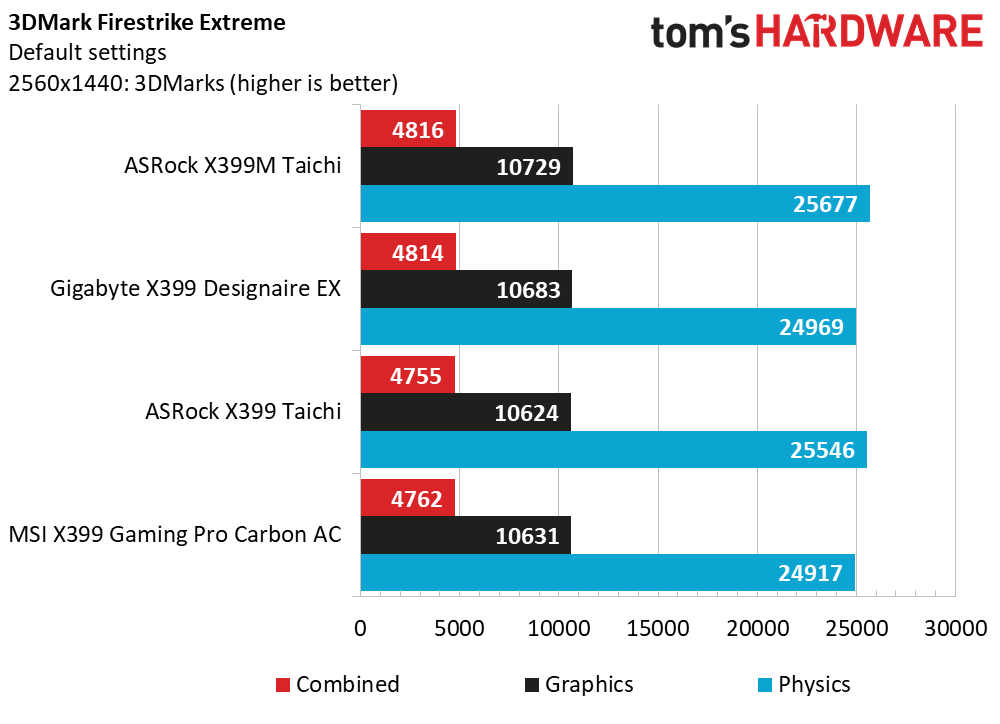
We favor the Firestrike and Firestrike Extreme results from 3Dmark for a workstation platform, and the X399M Taichi comes out on top with the 1440p workload across all metrics. The original X399 Taichi also performs well at the 1080p setting in our testing, though its smaller brother starts to slip up with the lighter graphical workloads. Focusing on the CPU scores, all boards show a performance range of 3-5 percent across all workloads.
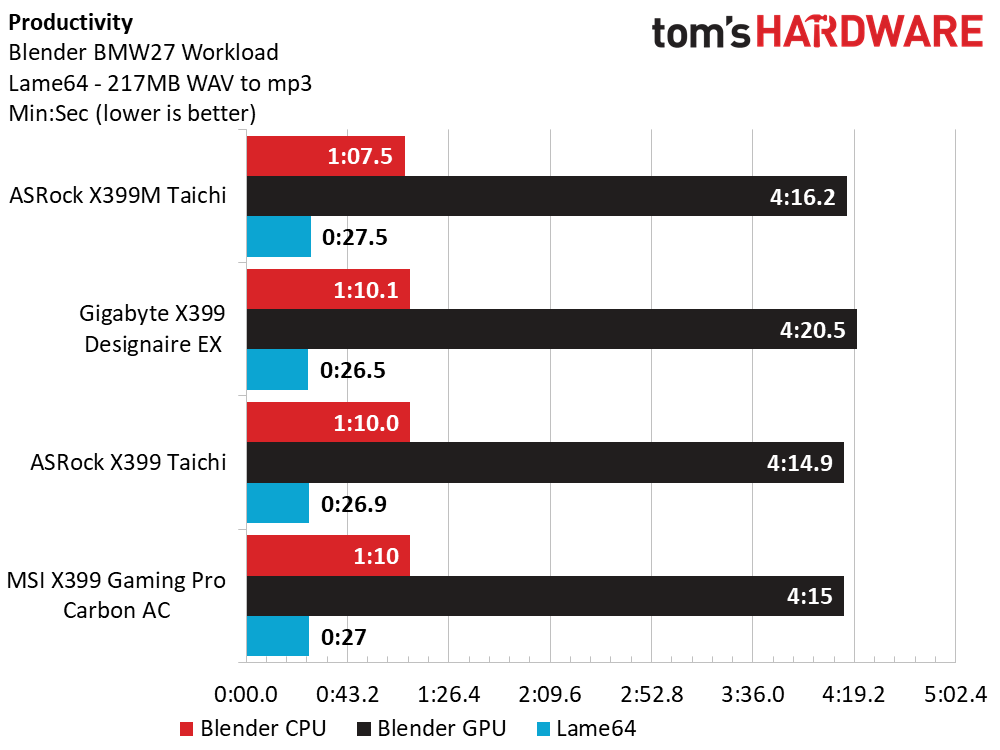
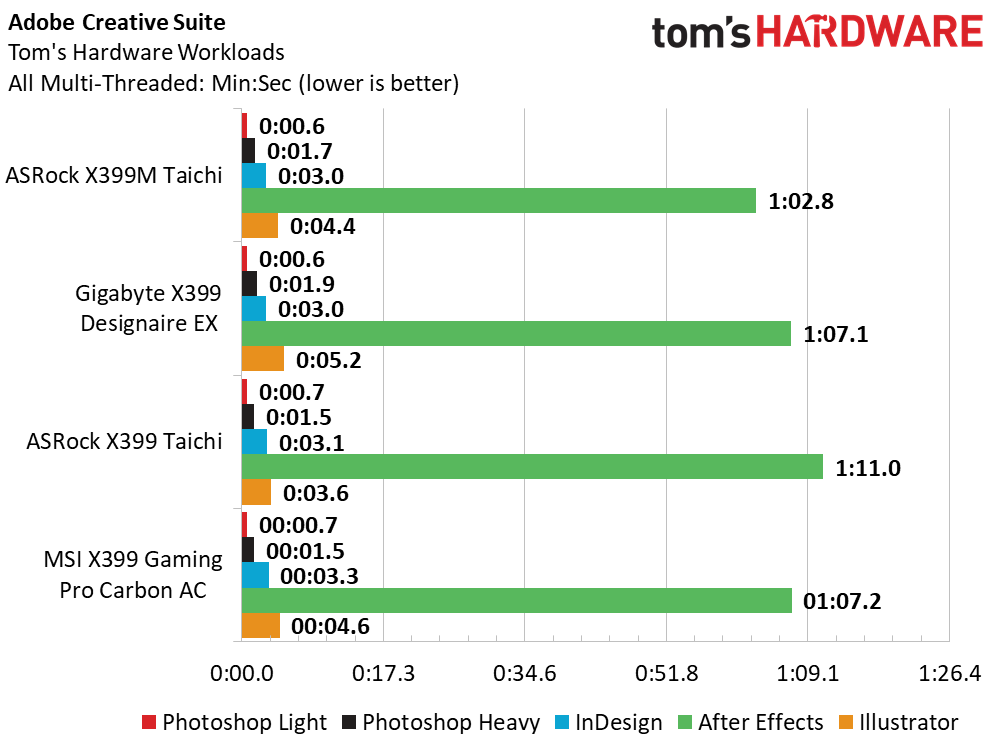
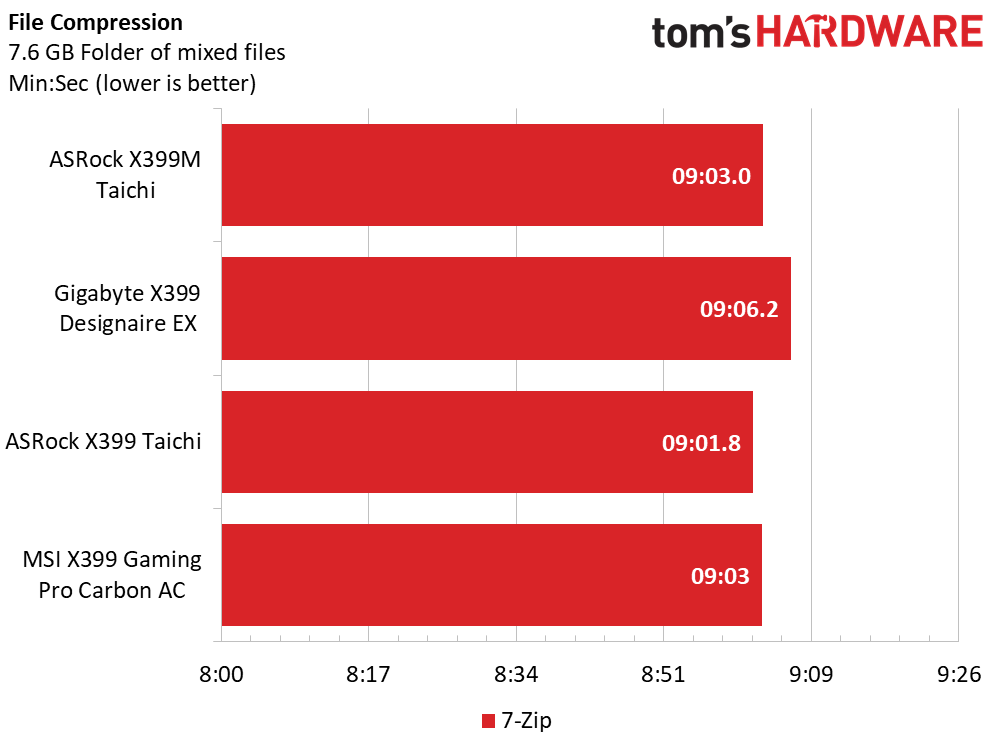
Our Application suite is by no means the sweet spot for Threadripper, but many of the jobs we run do favor the core counts at their disposal. Our CPU Blender workload shows a favorable advantage to the X399M board but lags by a half a second in the LAME encoding scenario. Adobe shaves 5 to 9 seconds off the After Effects workload and lags by fractions of seconds in Illustrator. The X399M is tied in the middle of the pack with 7-zip, which still favors clock rates rather than cores.
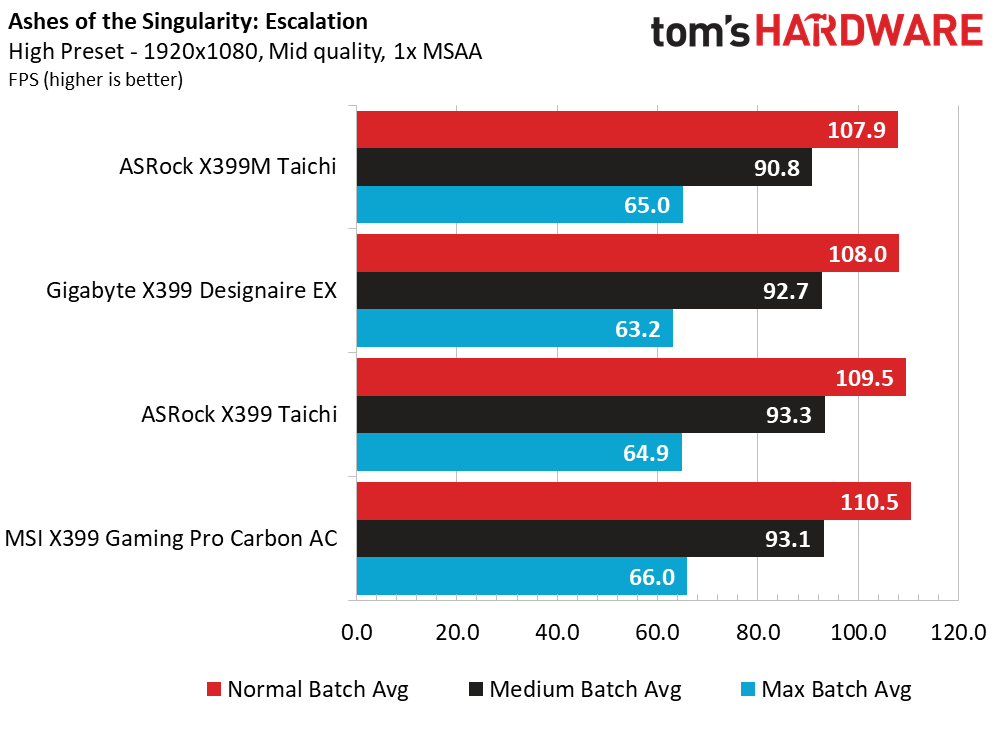
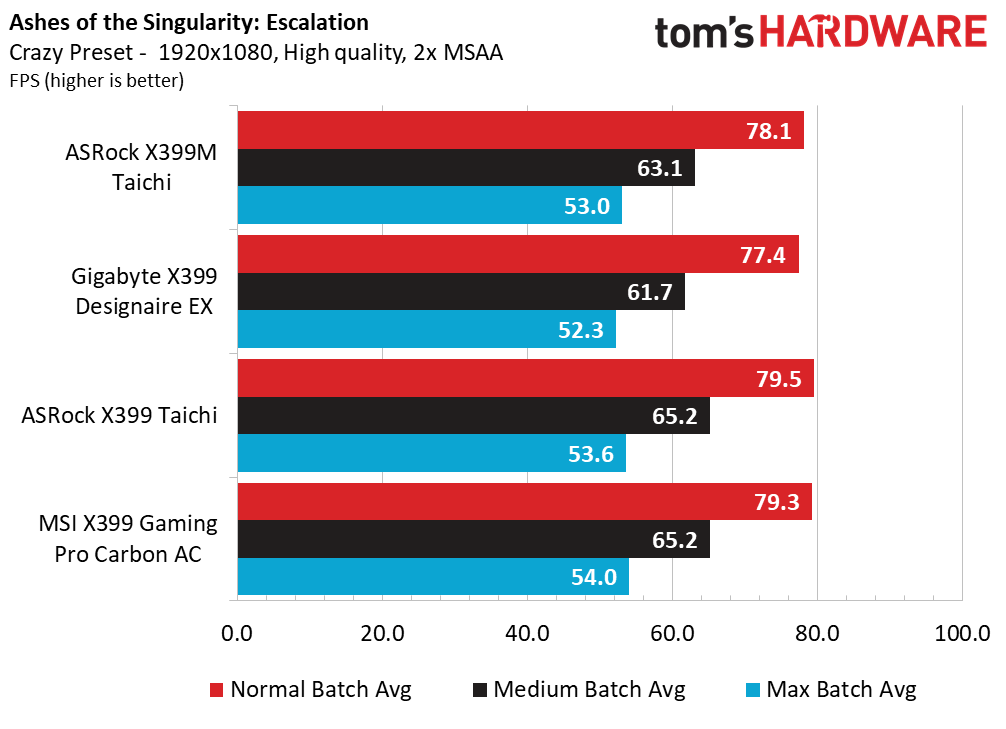
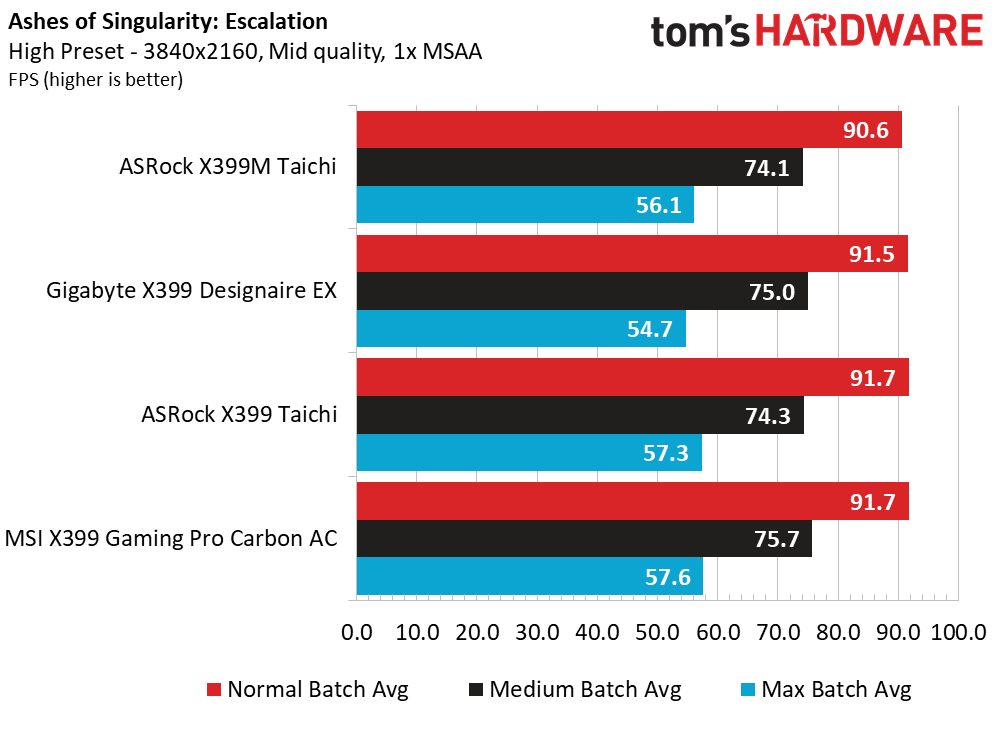
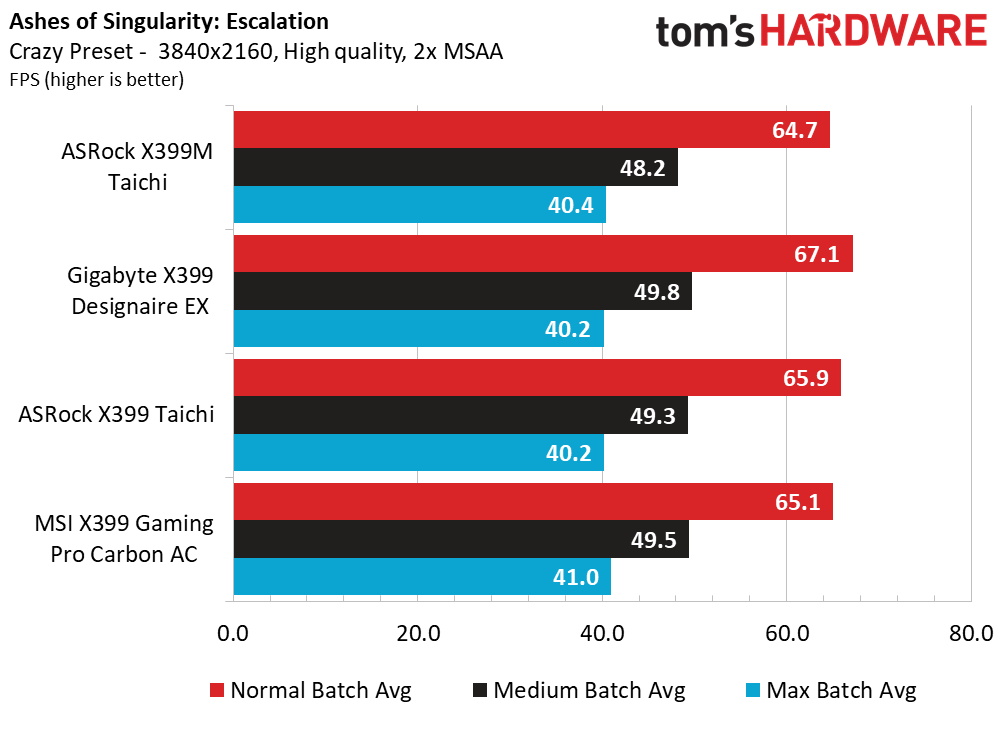
Our previous reviews have proven that gaming at mainstream resolutions is not the ideal use case for Threadripper, but the 1950X processor is still potent there. Our resident CPU-bound title, Ashes of the Singulatiry, shows very consistent results across the test samples, with the larger ATX Taichi taking some wins at the 1080p Crazy setting, but the MSI Pro Carbon and Designaire takes wins when we step up to 4K High / Crazy presets. The X399M Taichi takes back-of-the pack scores here, though this should not be discouraging considering the small 3.5 percent performance gap.
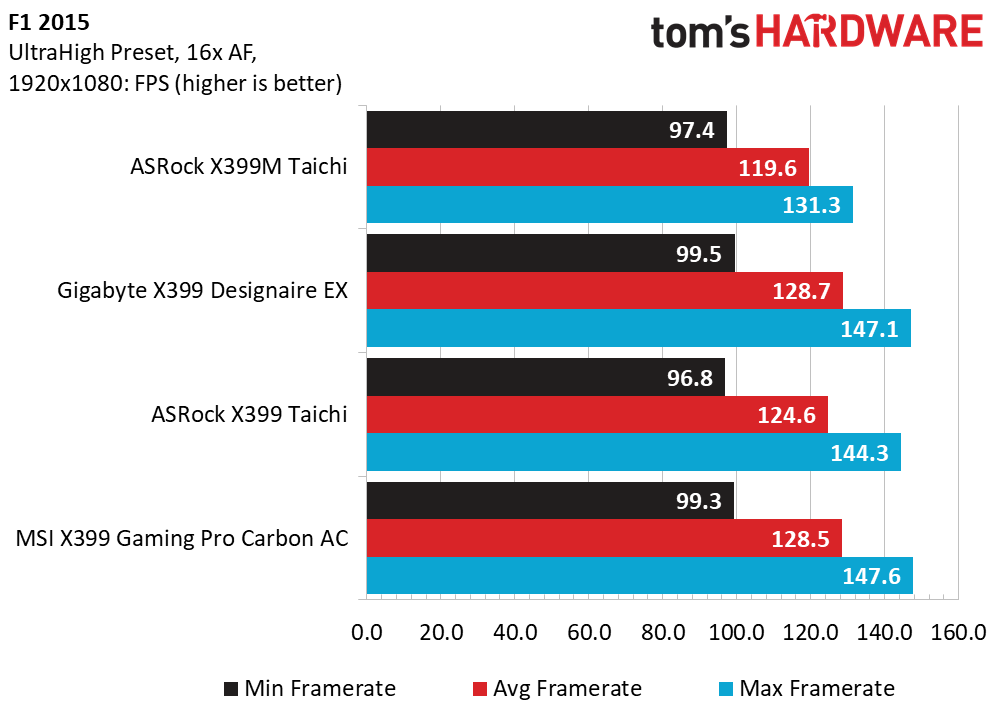
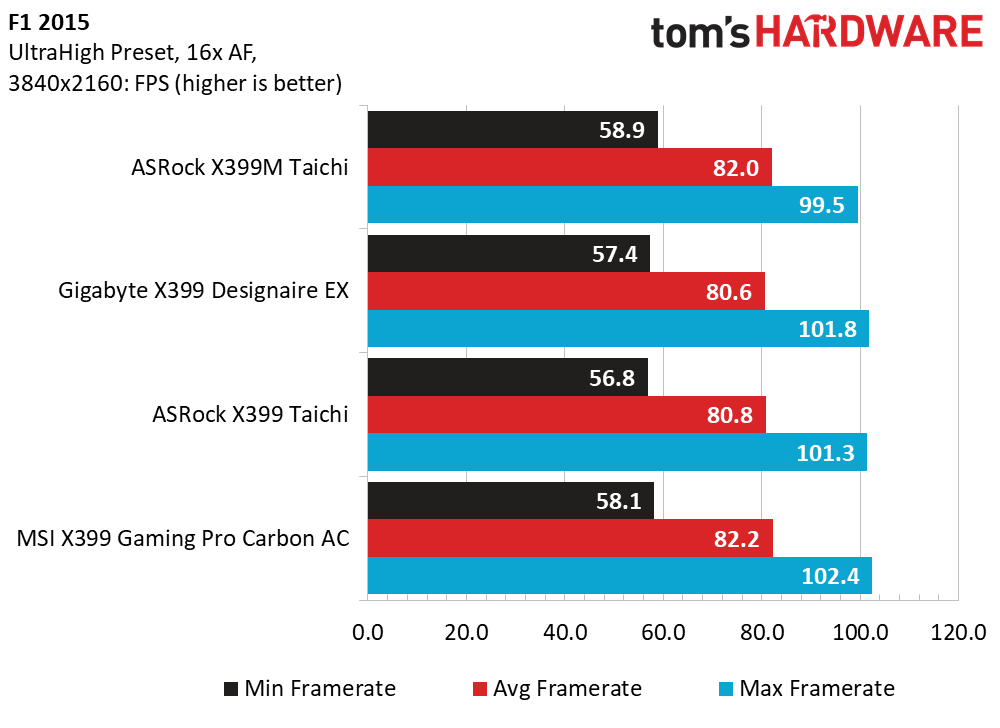
F1 2015 has troubles with core / thread counts larger than 30, so our 1950x doesn’t fully leverage its potential in this game--and that's even more more true with the 2990WX. At 1080p, both ASRock boards fall behind the MSI and Gigabyte contenders, but the story changes as graphical resolution quadruples. Again, each sample here is within a single-digit percentage range of its competitors.
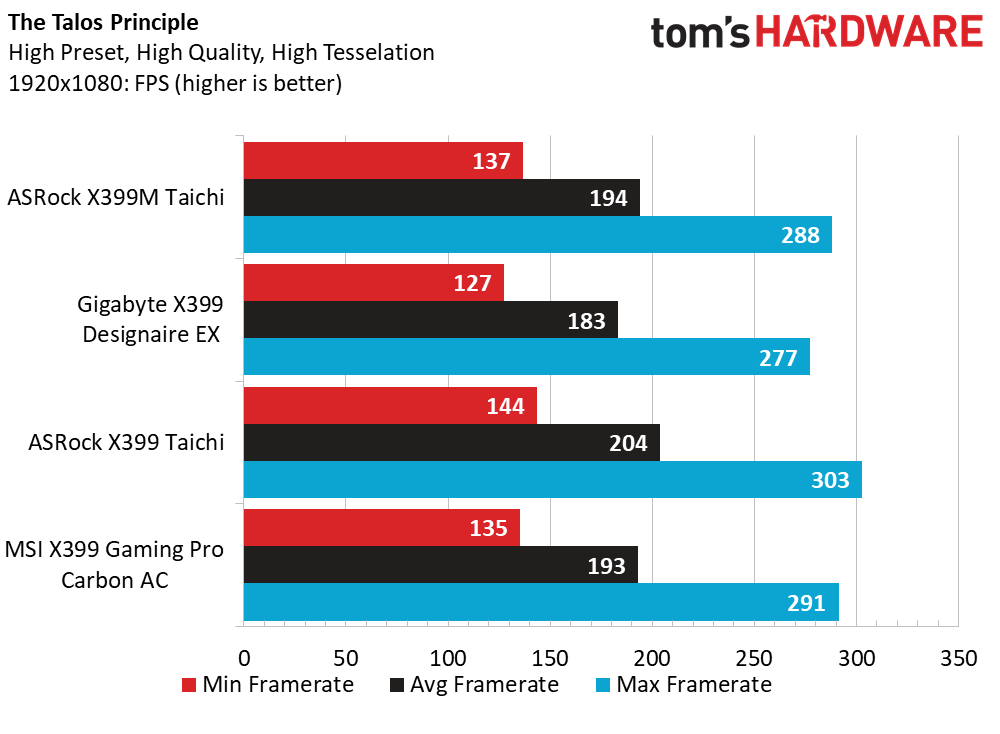
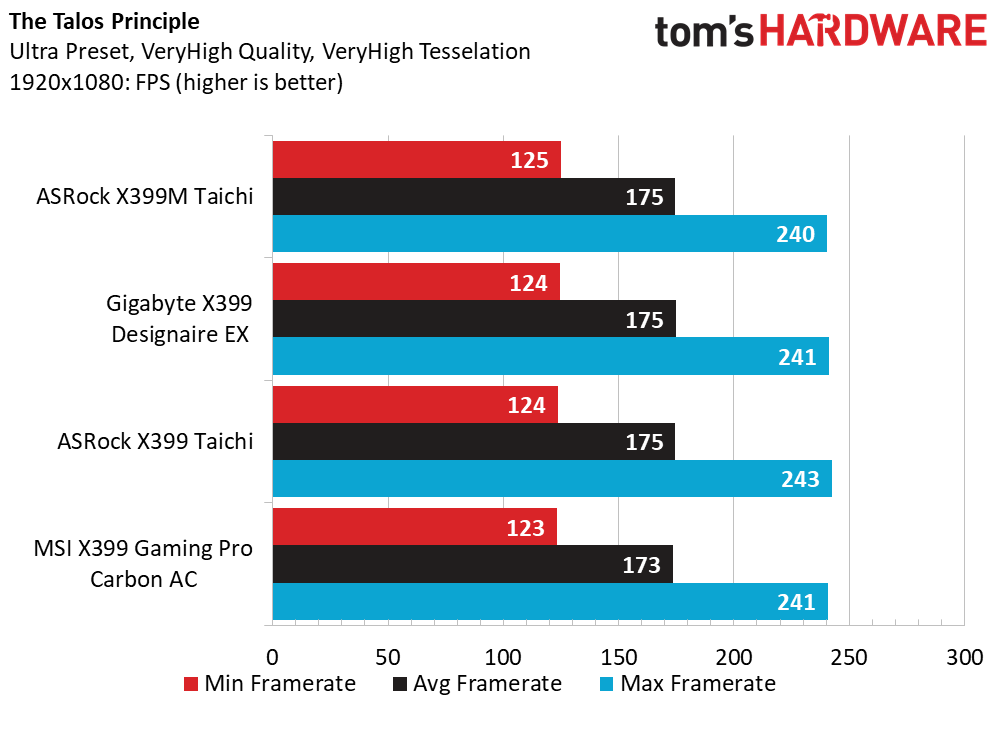
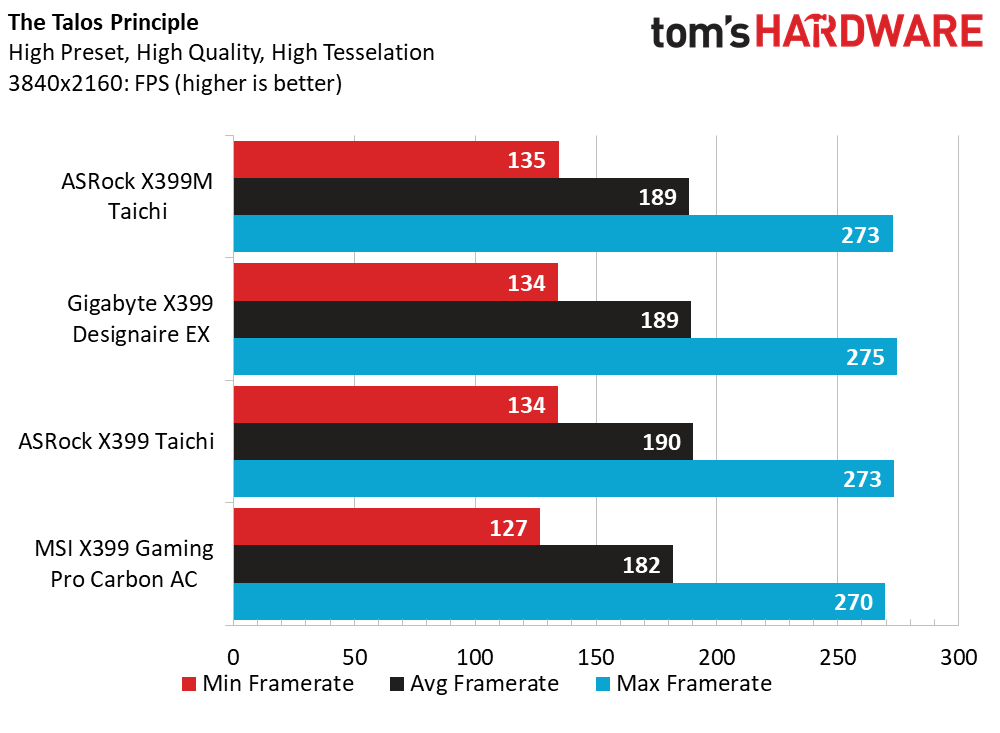
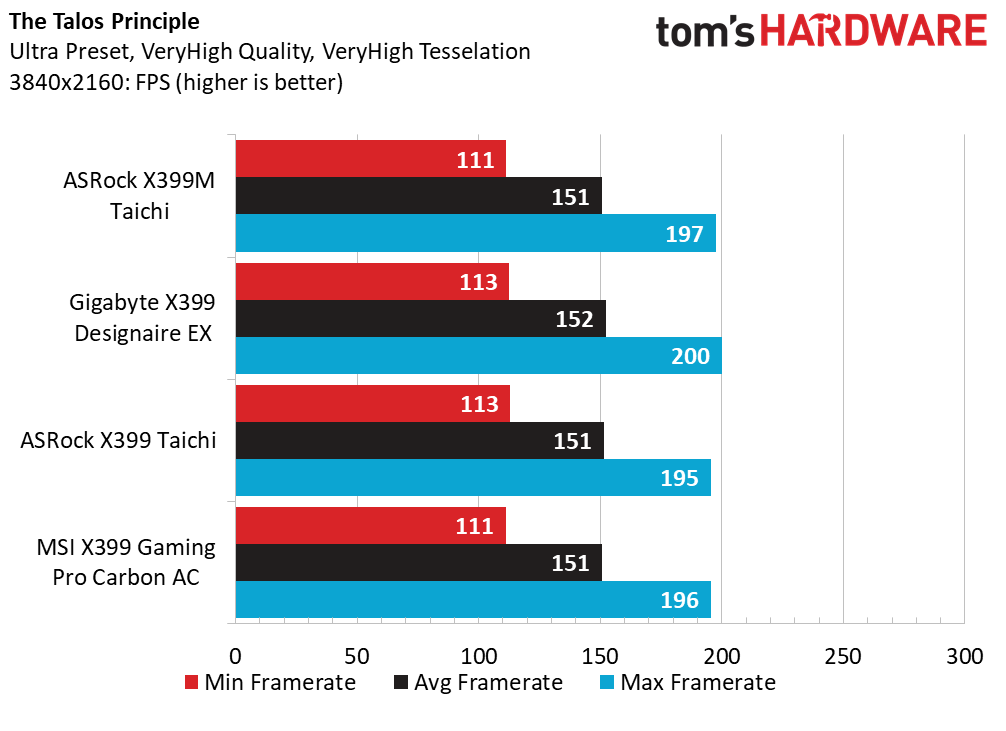
The Talos Principle repeats our observations from previous test games, and the little Micro-ATX monster lands in either second or third place in a majority of test conditions. Framerates are still suitable for both high-refresh-rate monitors and larger-resolution screens. So X399 users can take breaks from editing video other work tasks by playing this puzzle game.
Get Tom's Hardware's best news and in-depth reviews, straight to your inbox.
2990WX Data: Synthetics, Applications & Games
Shifting gears to the new big-boy CPU, the 2990WX sacrifices core frequency and power for those tasty threads, nearly doubling the capacity of our 1950X sample. Granted, it’s not a direct apples-to-apples comparison, but these tests should also give is an idea of how the 2950X could operate on this same platform.
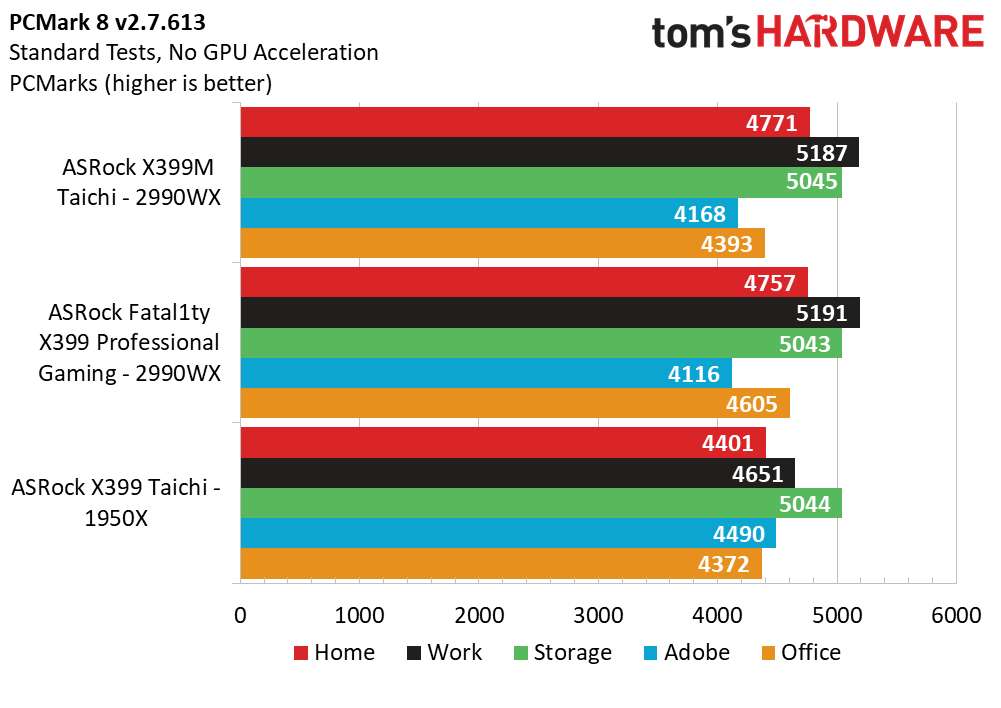
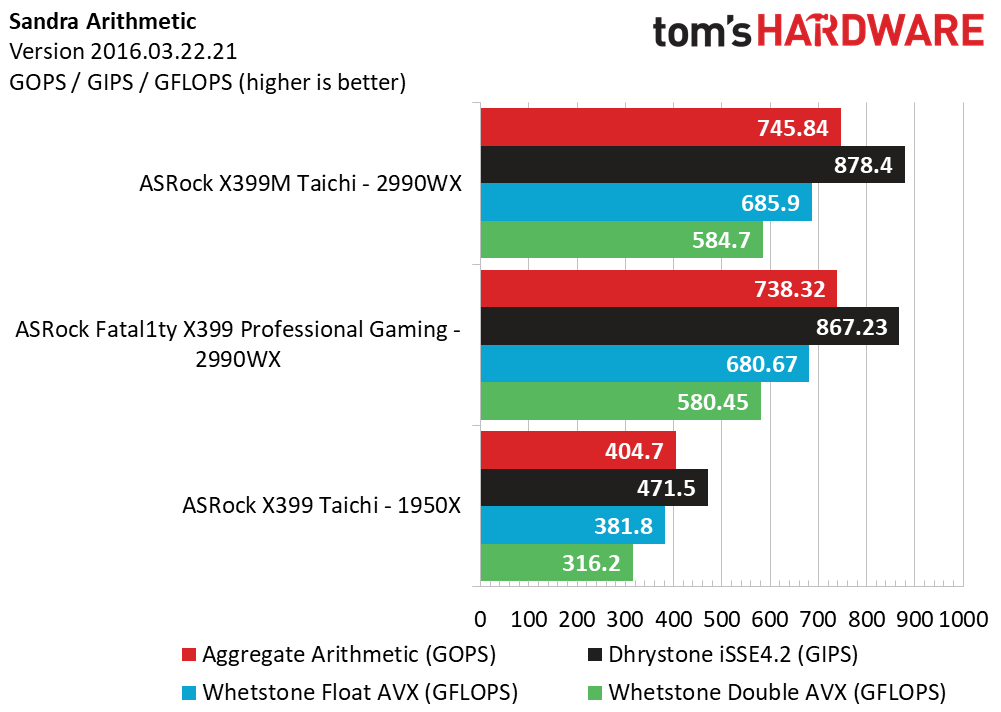
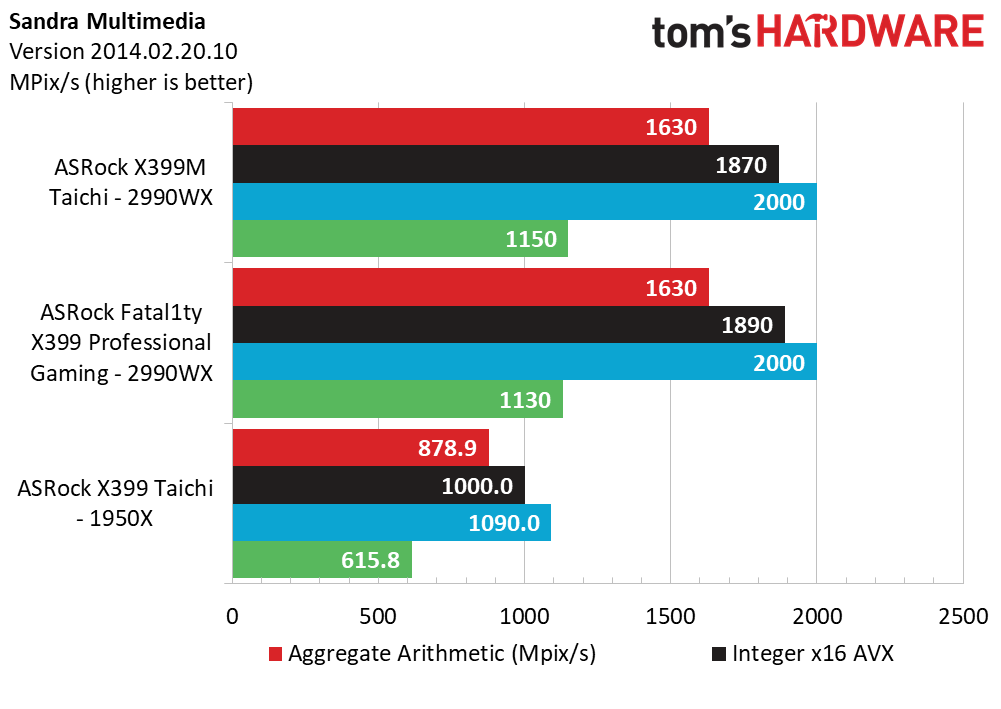
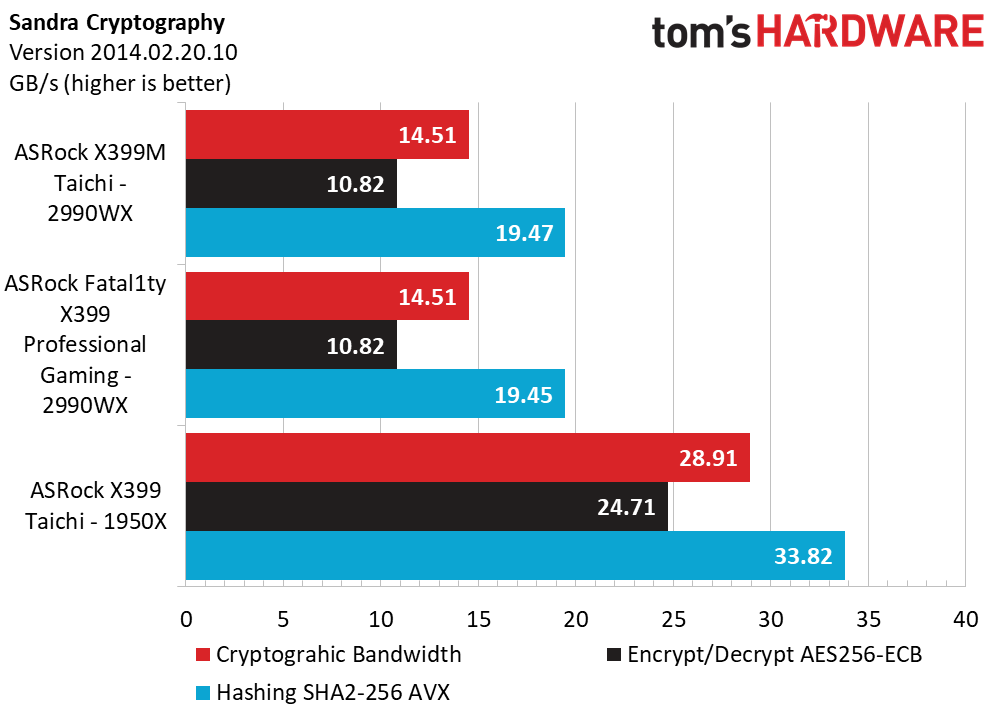
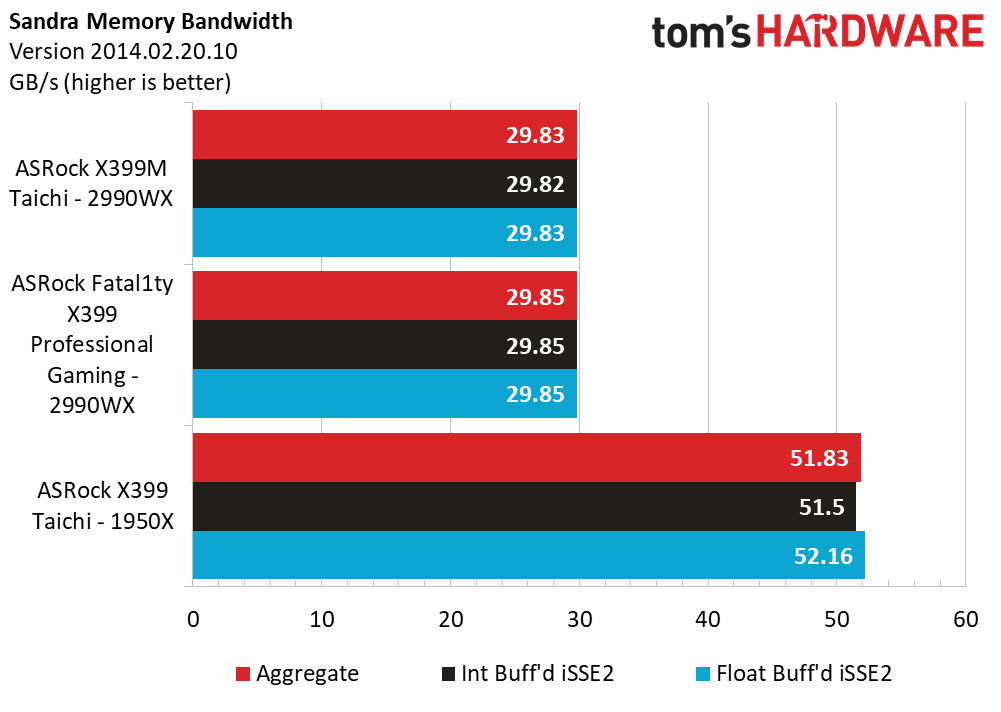
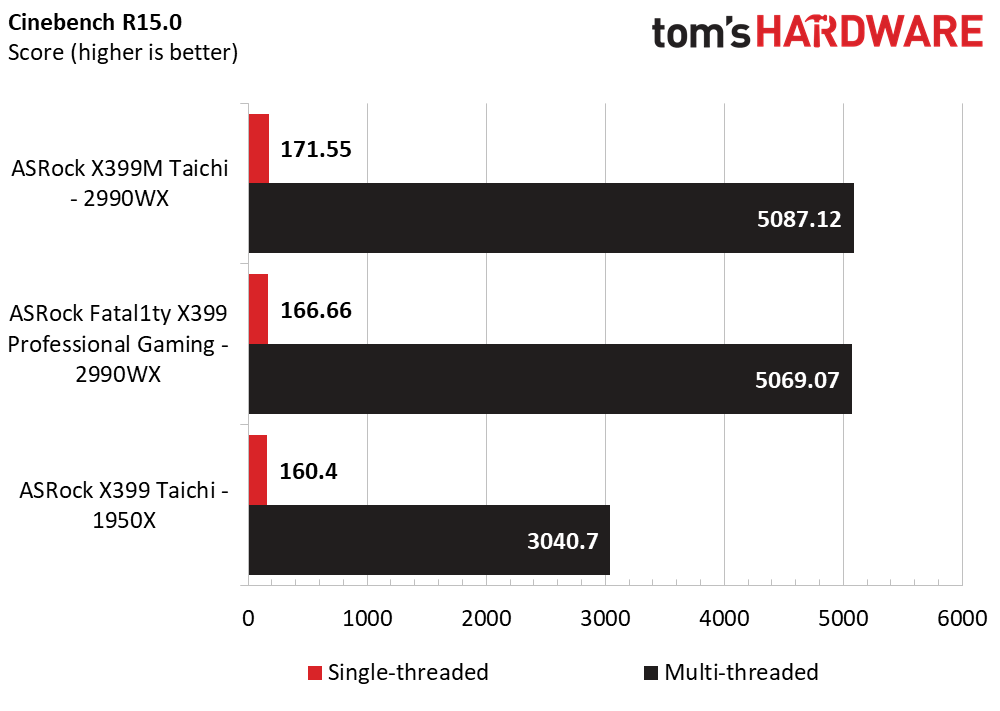
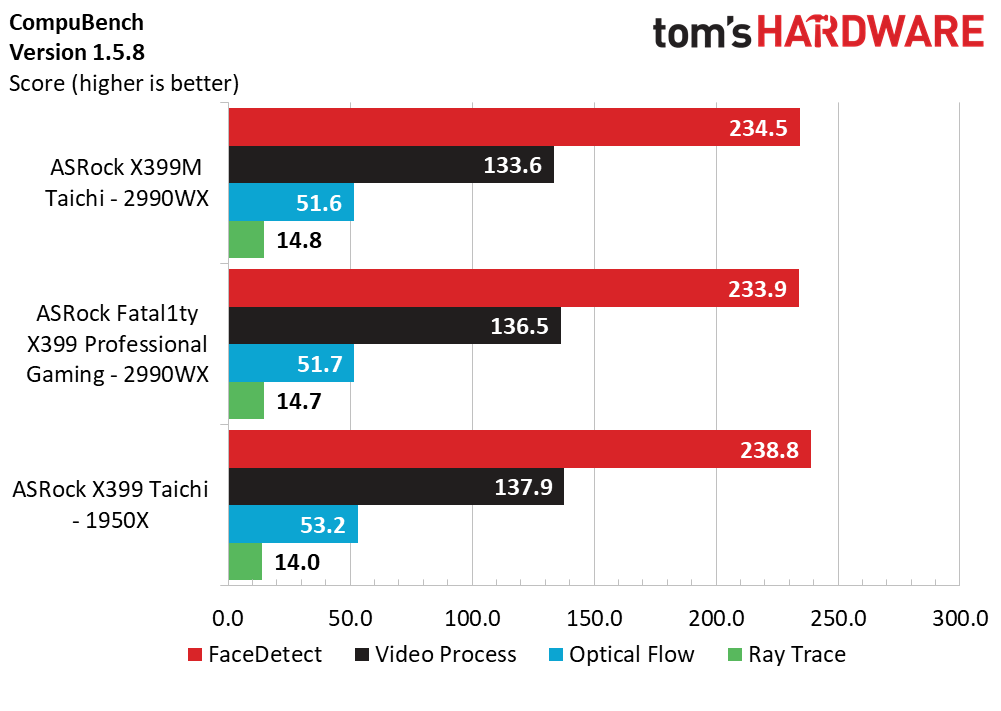
At first glance, the 2990WX synthetic data looks very compelling on both the X399M and Professional Gaming boards, showing gains in all the PCMark workloads except Storage, Adobe CC, and Microsoft Office scenarios. The WX processor really struts its stuff with Sandra, showing excellent scaling in both the Arithmetic and Multimedia workloads by nearly 90 percent compared to the 1950X. Piling on the gains, Cinebench steams ahead with a 67 percent performance gain thanks to the core counts and the occasional boosts from Threadripper power management. However, those gains quickly erode with a 42 percent memory bandwidth degrade and as much as 50 percent lower crypto results. Despite the architectural differences between these processors, the X399M manages to stay ahead of the Fatal1ty Professional Gaming board in most instances.
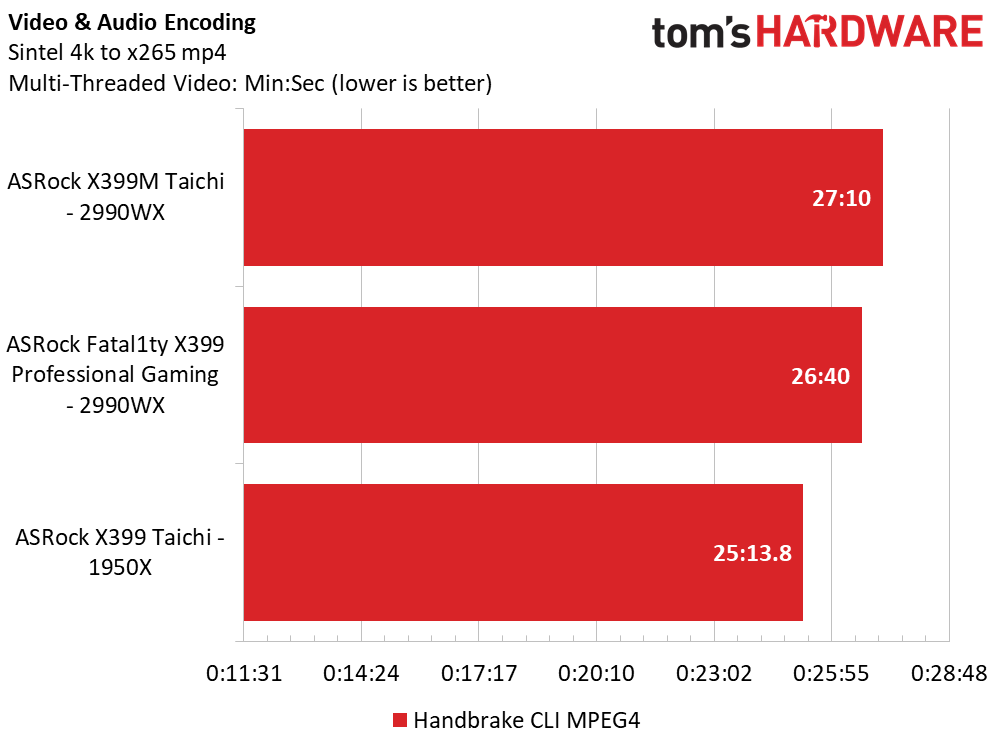
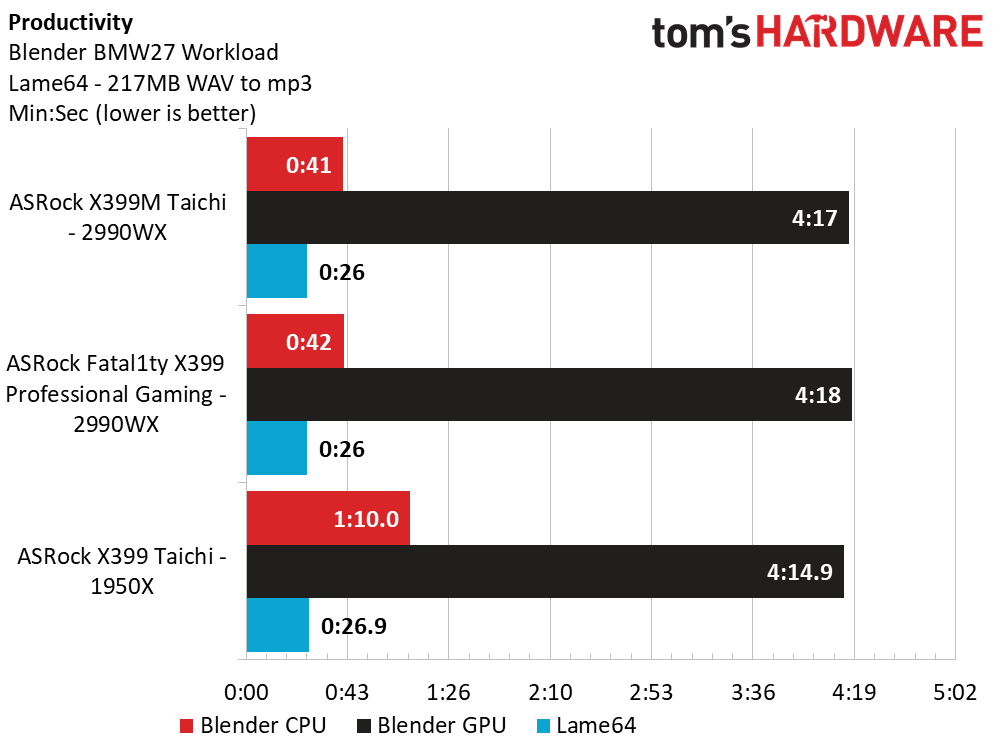
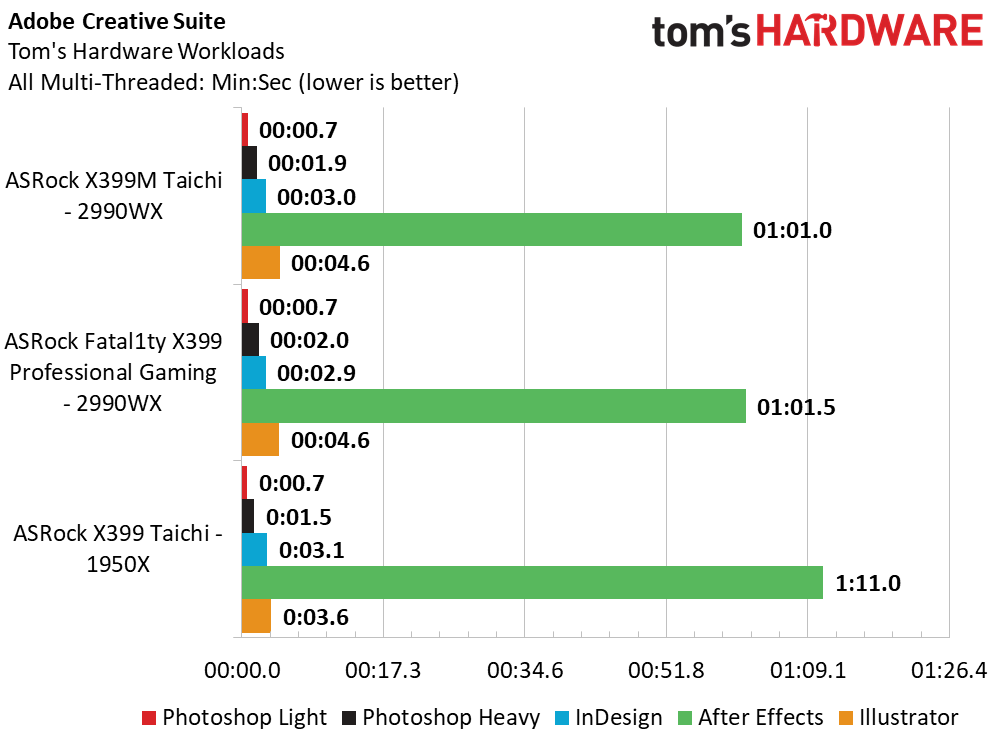
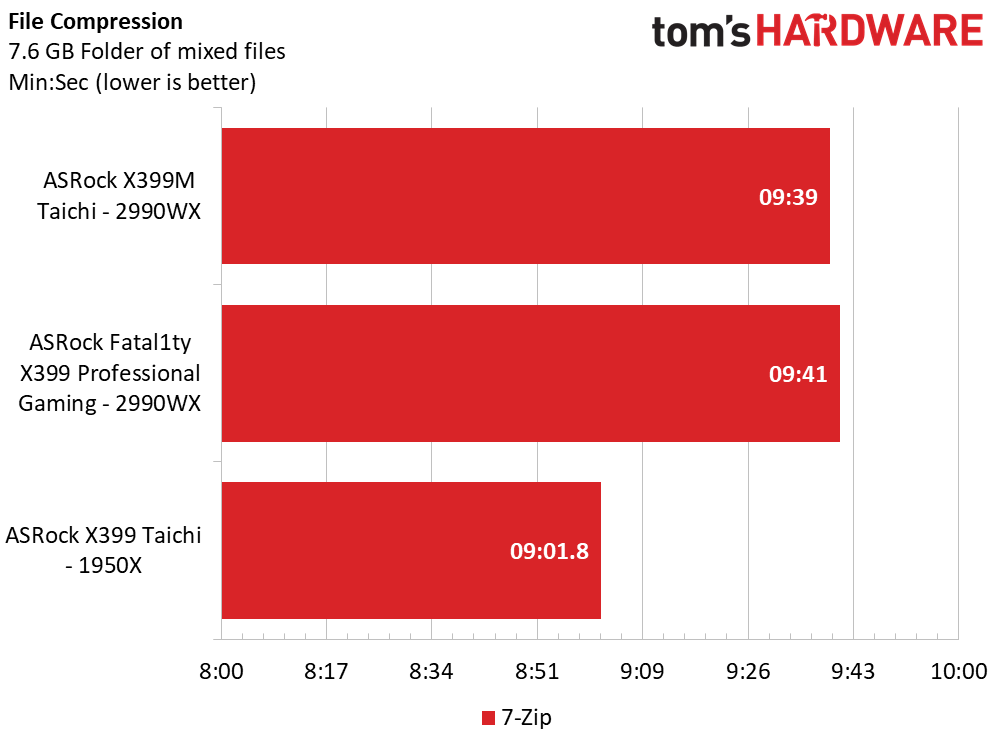
Application data shows similar behavior to the Crypto and Memory bandwidth, where many of our applications just don’t care that we have an abundance of cores. The shining stars though are PCMark’s Adobe After Effects workload and our Blender CPU benchmark. Otherwise, more frequency helps the remaining tests.
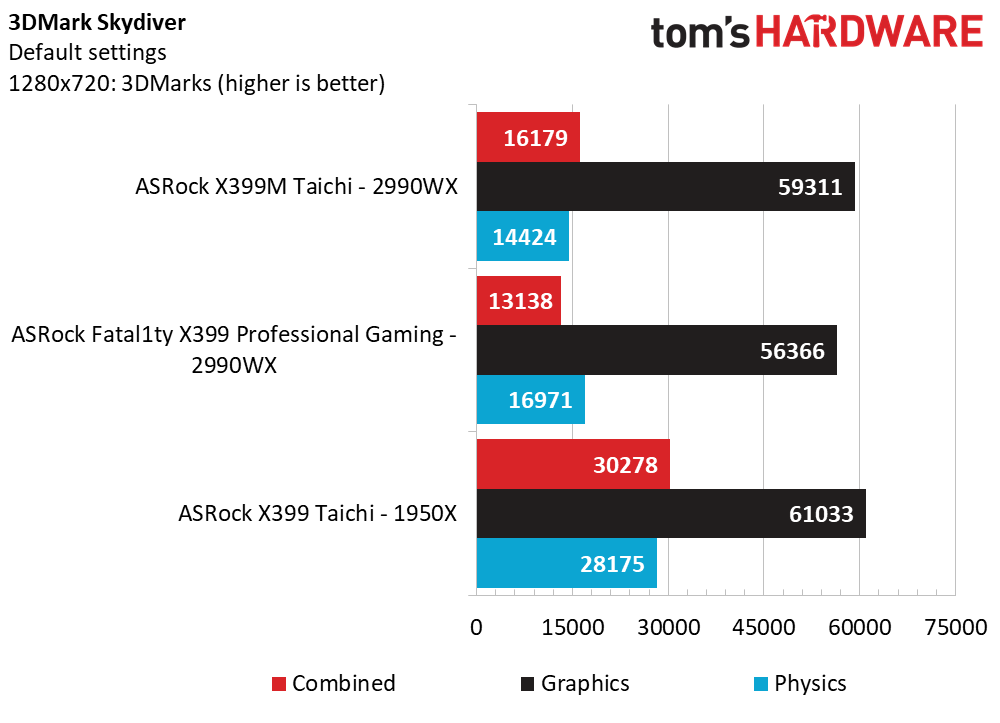
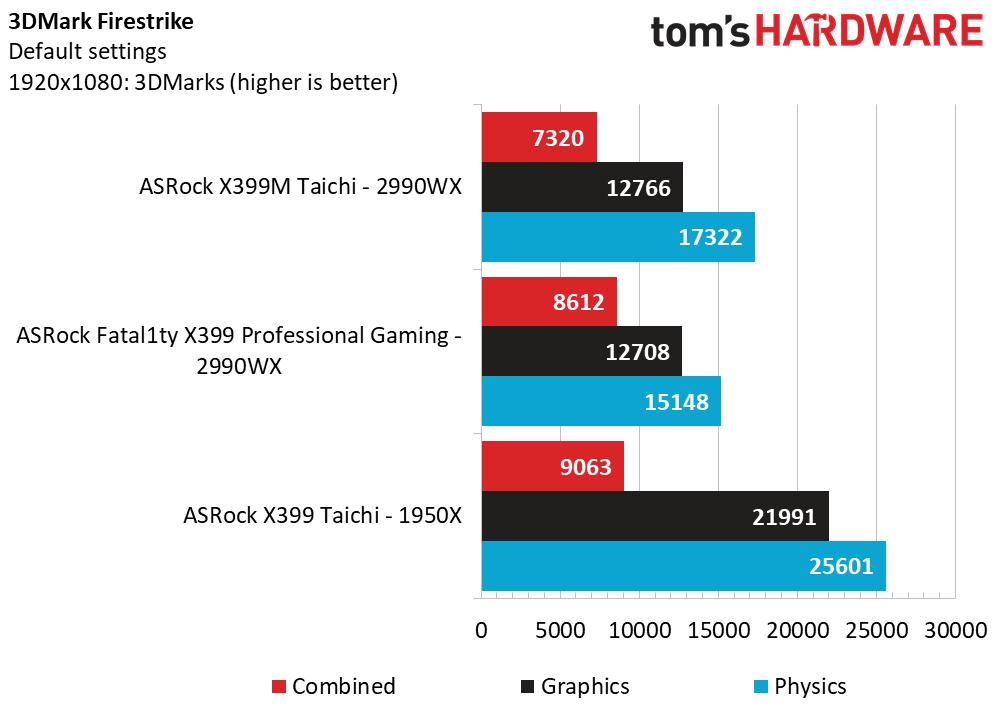
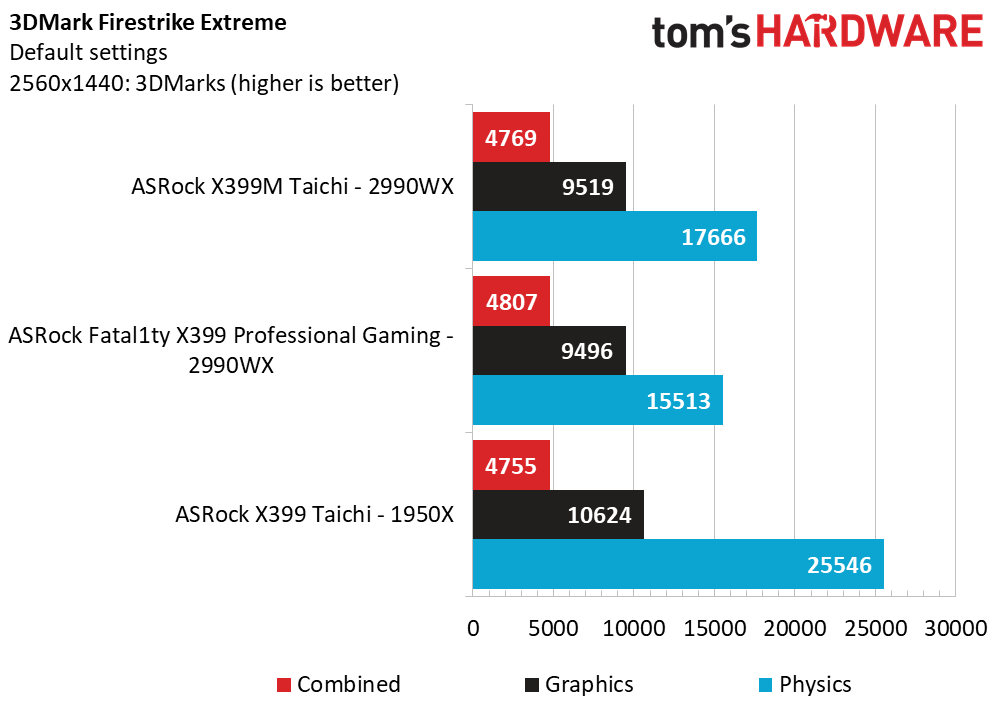
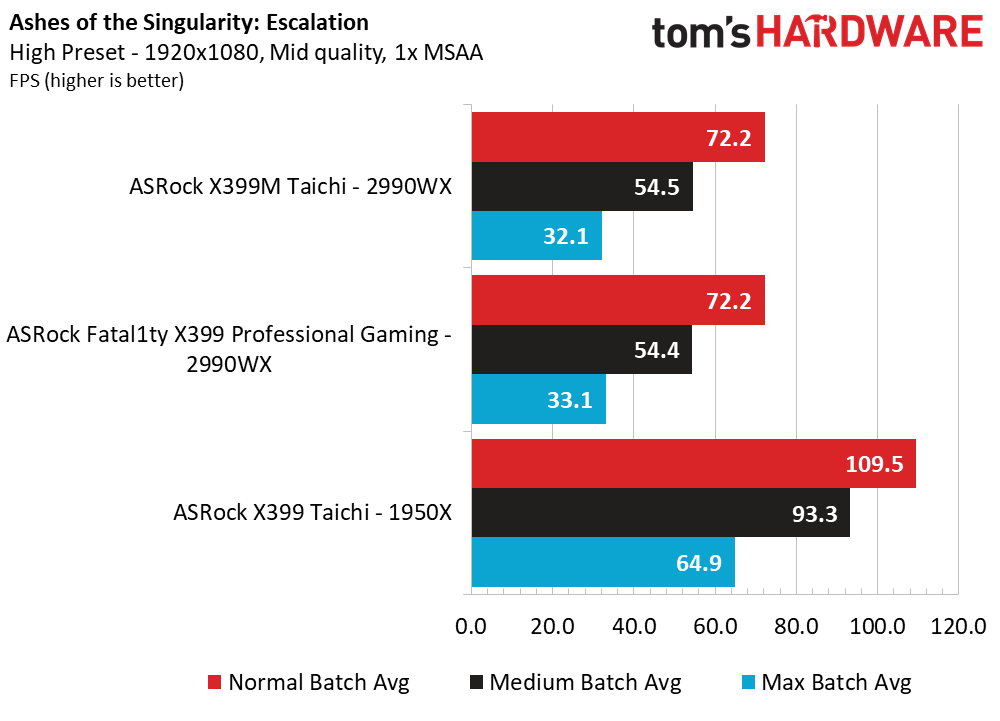
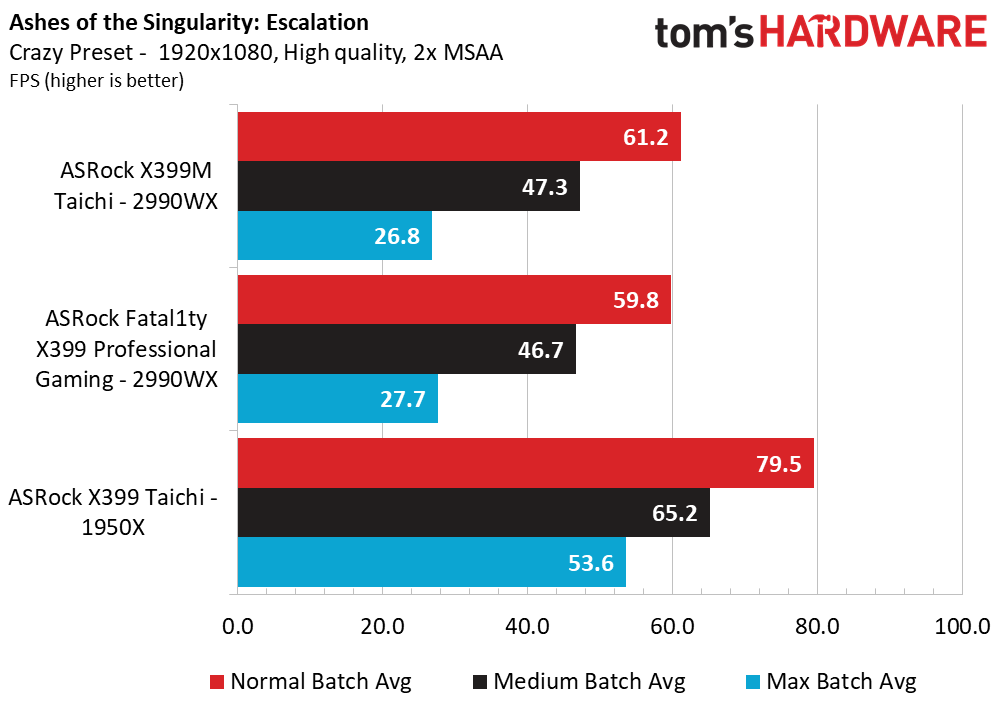
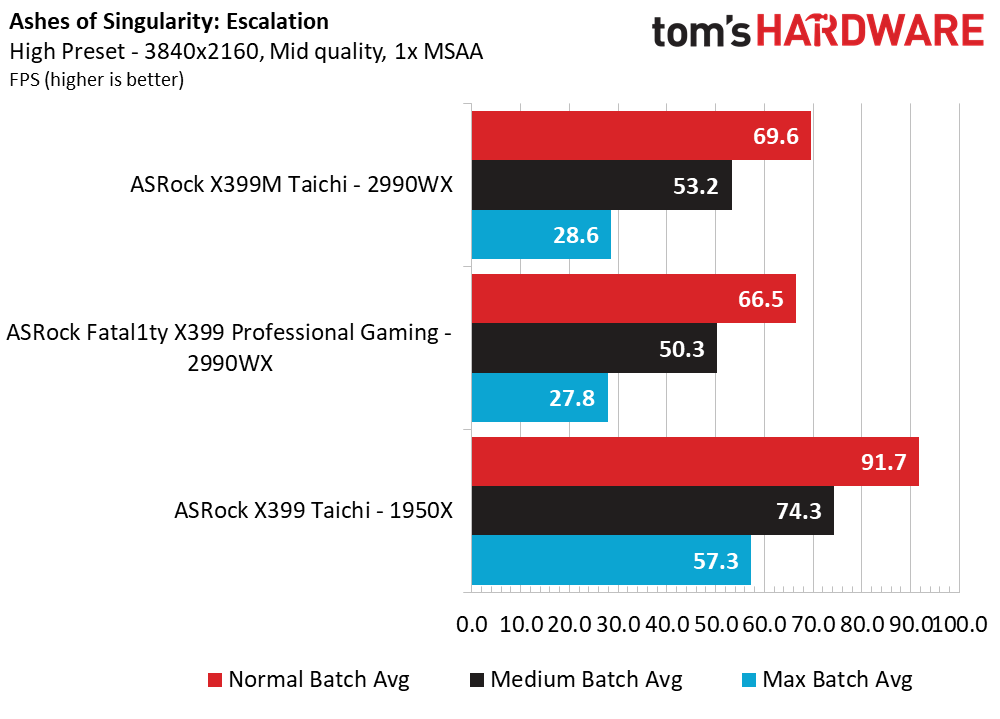
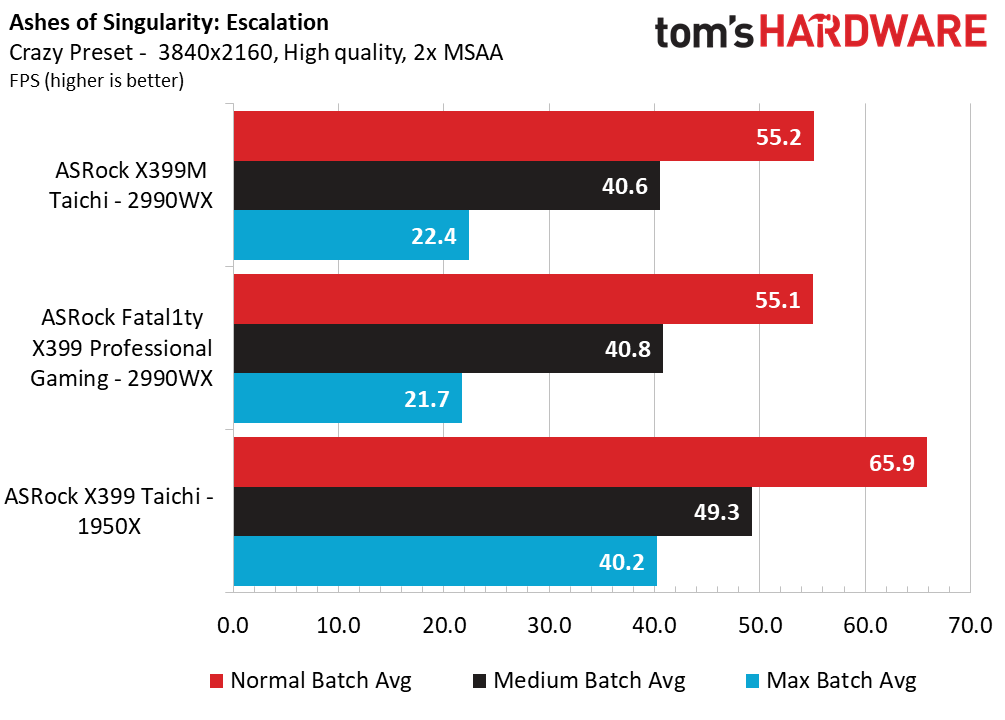
We've said it before and we'll no-doubt say it again: You shouldn't be spending $1,800 USD on a 2990WX just to play games on it. Don’t get us wrong, gaming is still viable and highly enjoyable on the platform. But not many of the games in our suite (or current existence) utilize all of the extra cores, and are effectively bottlenecking our GTX 1080. Ashes generates around 40 percent less performance at 1080p here, and we do observe performance tighten a bit as the graphical load increases.
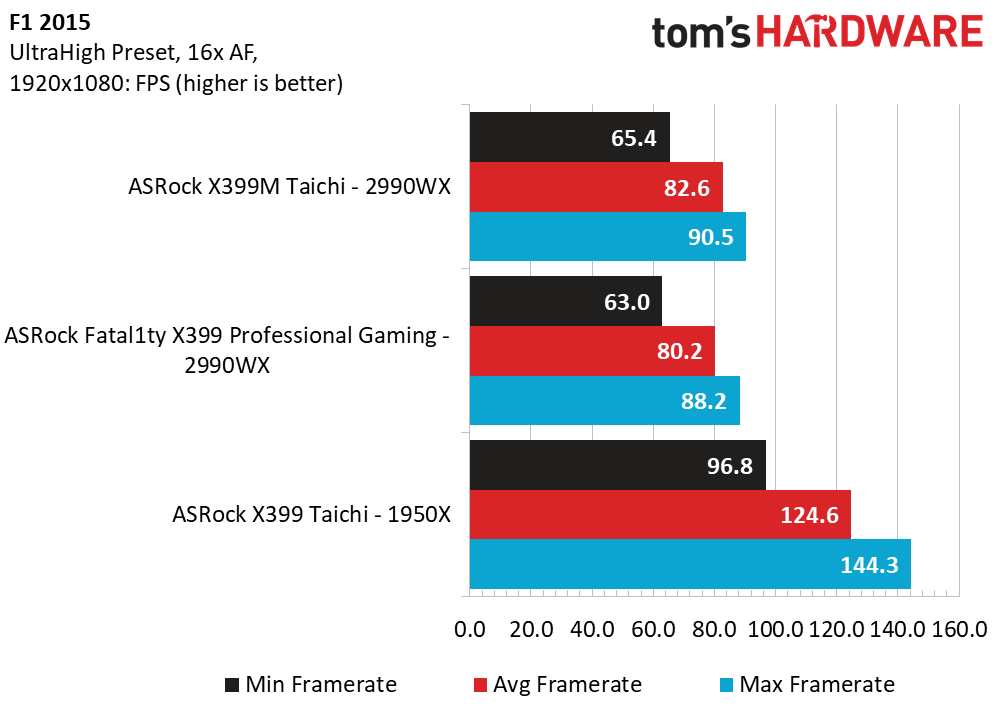
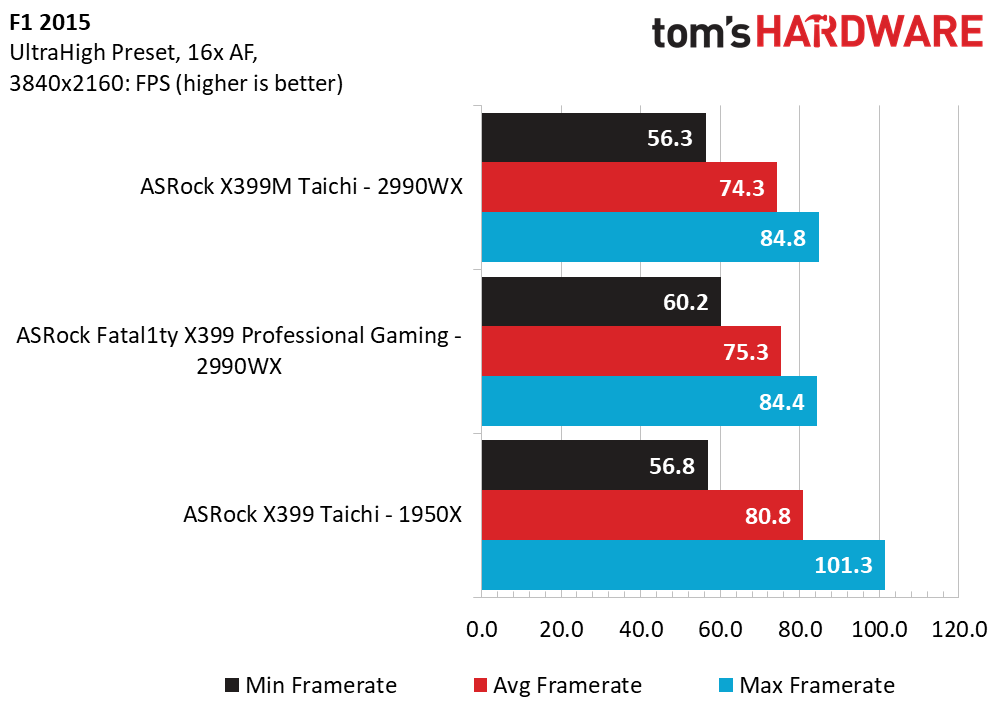
F1 at 1080p also sees roughly 30 percent lower frame rates at the Ultra-High preset, but 4K leans more heavily on the GPU and the delta shrinks to 8 percent. But, the X399M struggles compared to the Fatal1ty board at 4K.
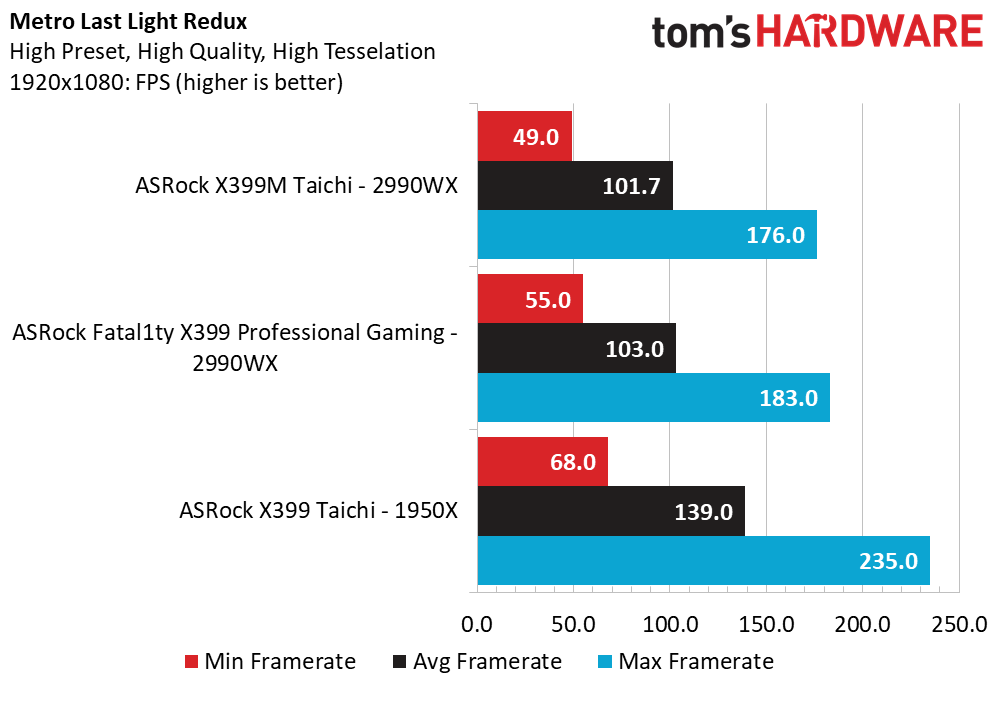
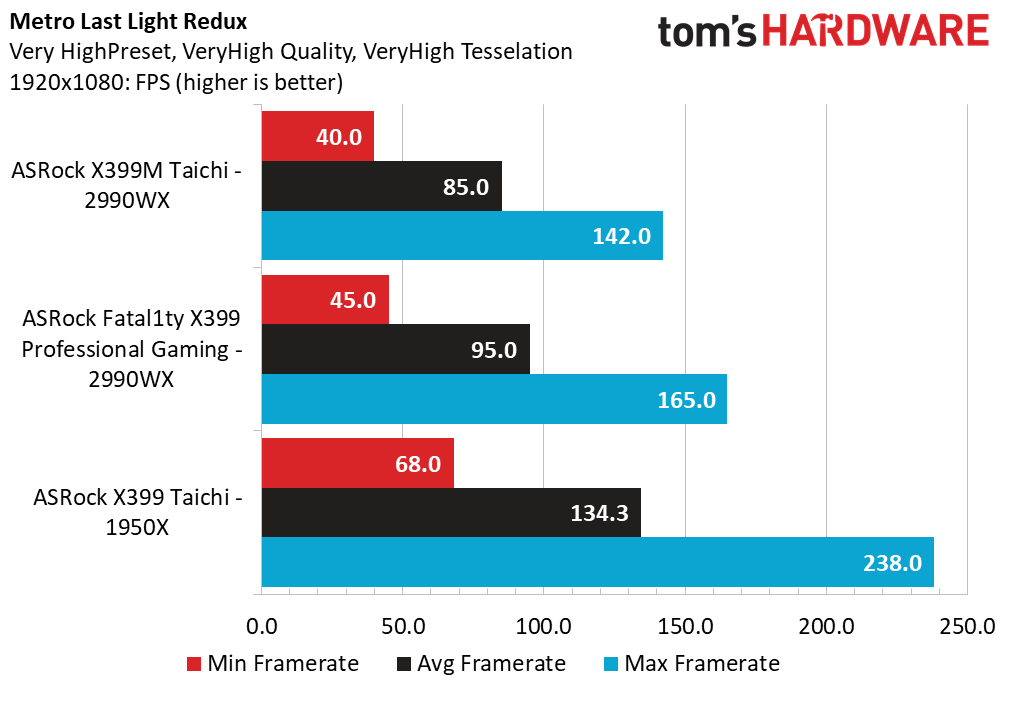
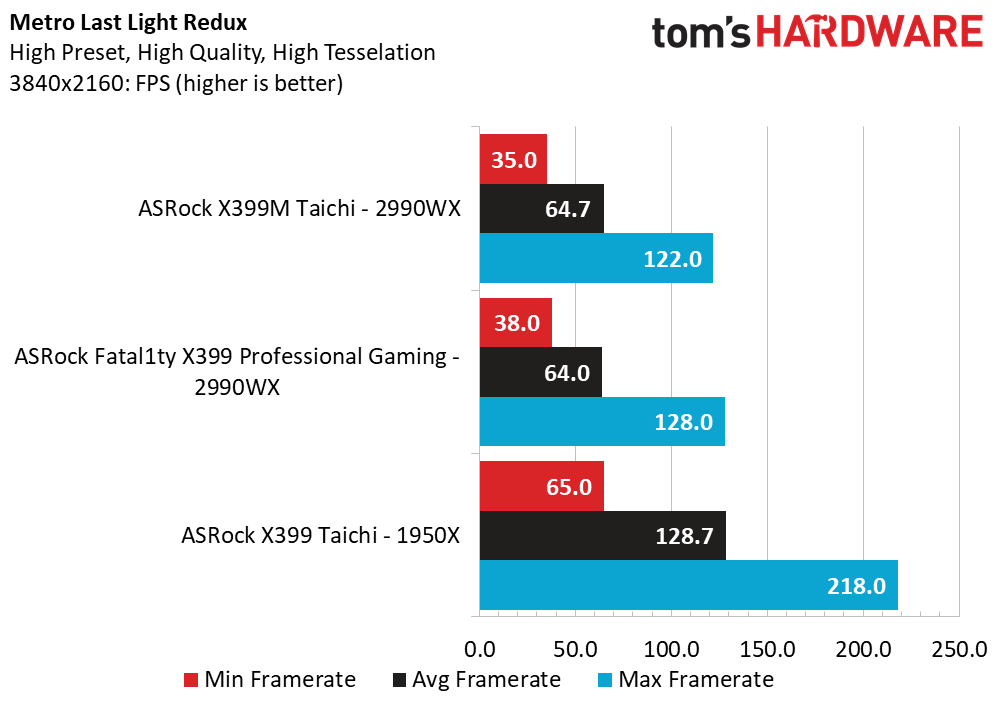
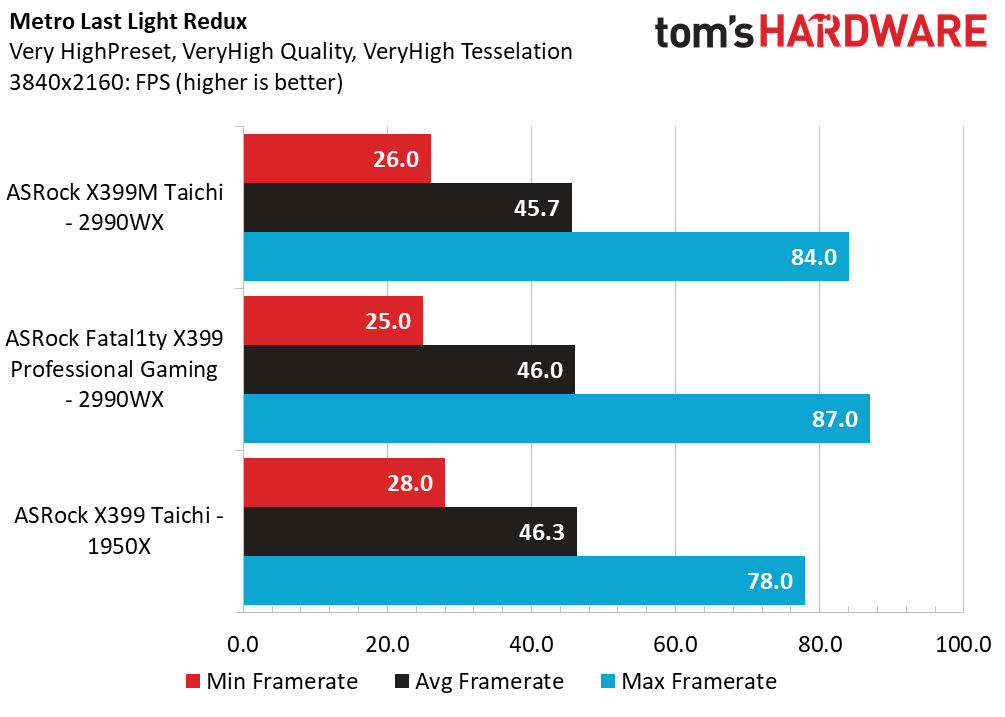
Metro shares the same 1080p fate as the other games in our suite, where framerates lag between 25 and 35 percent, though the Fatal1ty does appear to manage higher average framerates (we do not factor in mins or maxes in this test). The only saving grace for the 2990WX in this suite is the 4K Very High detail setting, where all results are gated by the GTX 1080’s horsepower.
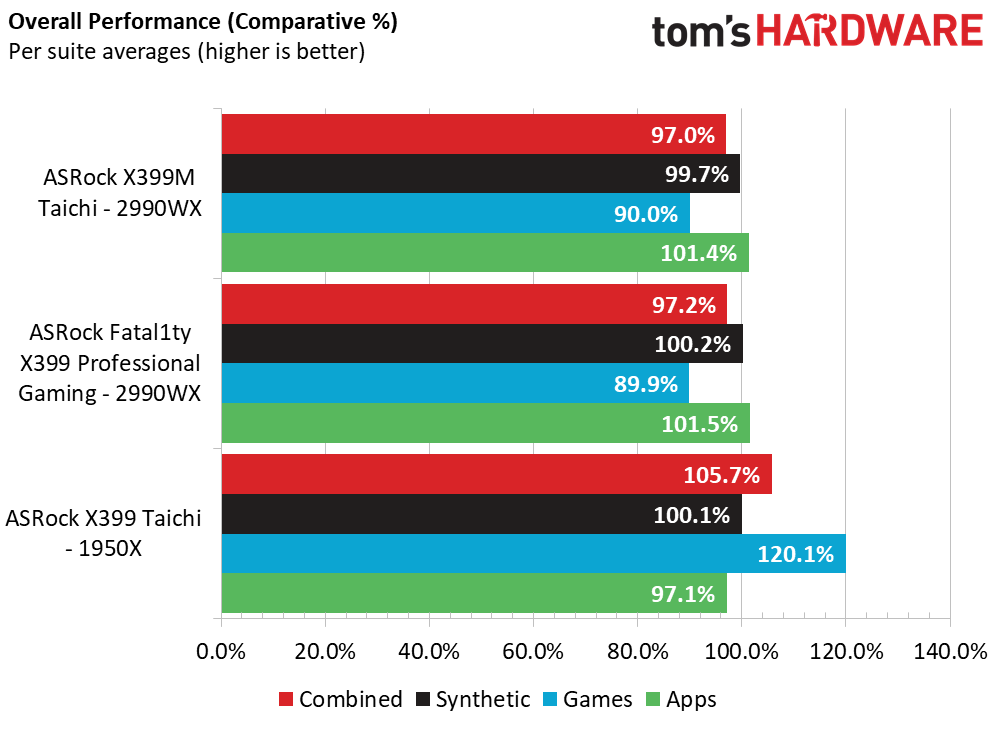
So, as hyped as we are that this X399M can drive and boost this processor accordingly, the 2990WX just isn’t well suited for our motherboard test suite. Even with the monstrous synthetic wins and modest application wins, gaming performance drags this build down.
MORE: Best Motherboards
MORE: How To Choose A Motherboard
MORE: All Motherboard Content
Current page: Synthetics, Applications and Gaming Performance
Prev Page Test Configuration and Article Specifics Next Page Overclocking: Two Stories, Similar Results