Asustor AS5108T NAS Review
The Asustor AS5108T provides high network traffic performance with existing gigabit networks. This model's four Ethernet ports can aggregate for 10GbE-like transfers.
Why you can trust Tom's Hardware
SMB, iSCSI & Standard Server Workloads
SMB/CIFS Workloads
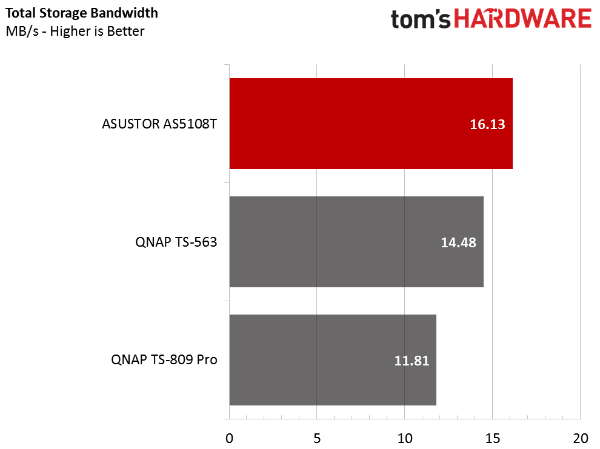
From the synthetics we move to real-world benchmarks using traces from previous workloads. SMB/CIFS is how you transfer data across the network in a Windows environment when you move files to folders or navigate to the NAS. Our results are in MB/s, higher numbers obviously being better.
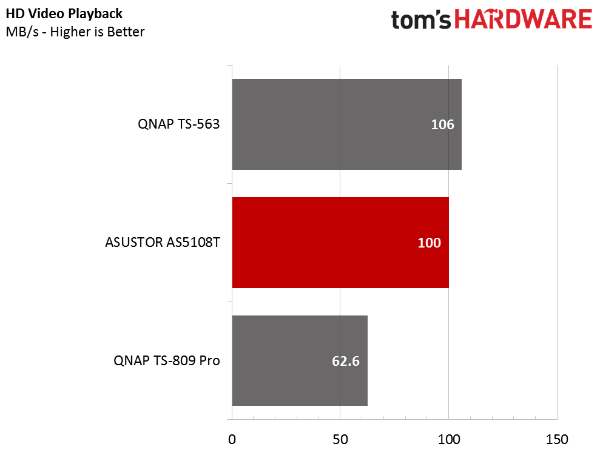
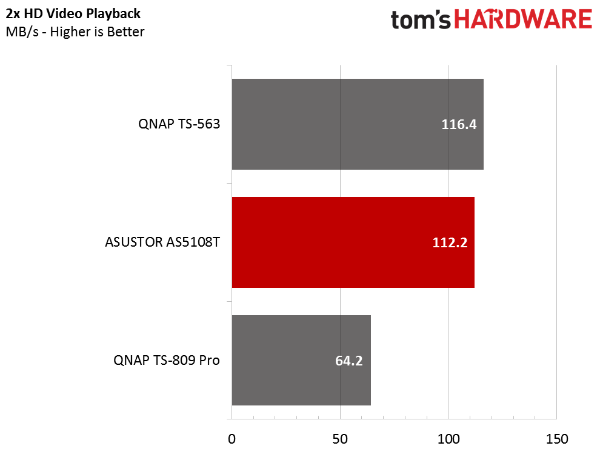
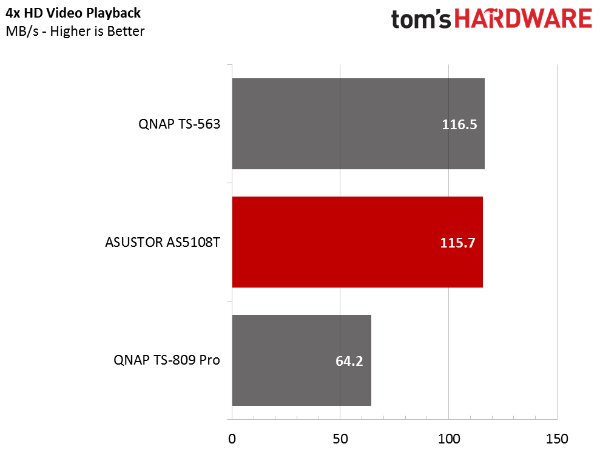
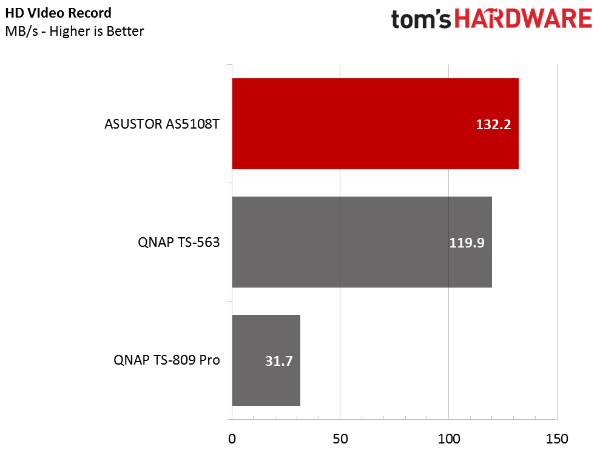
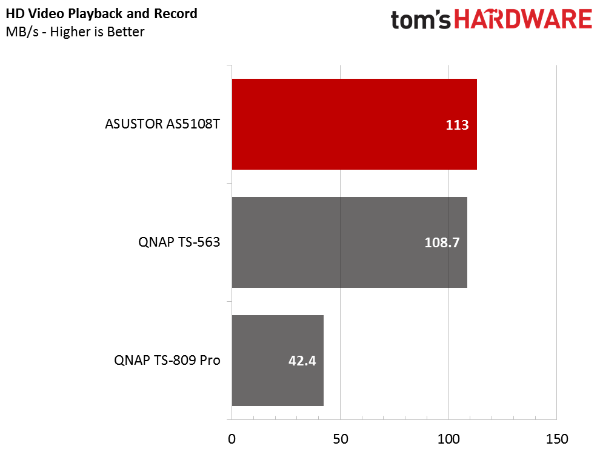
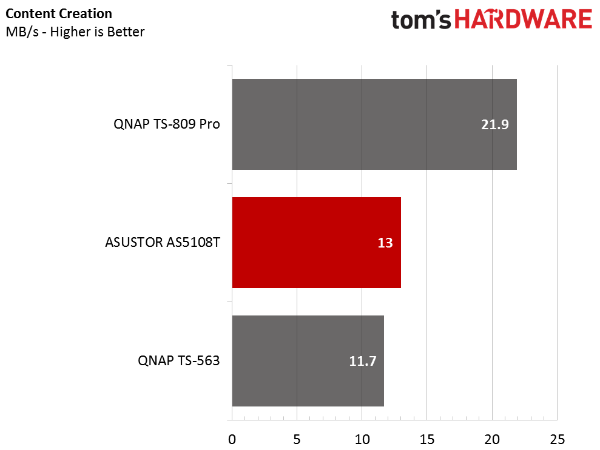
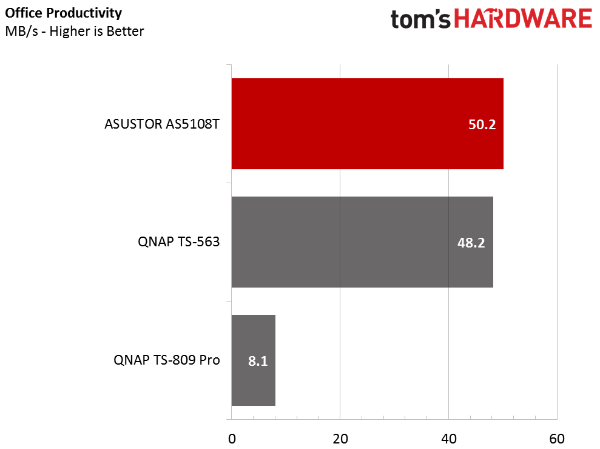
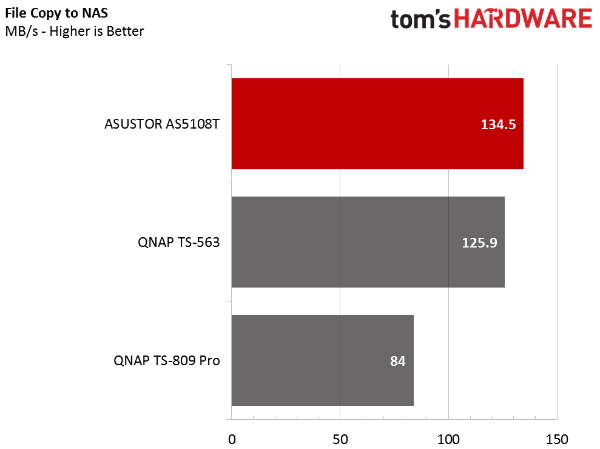
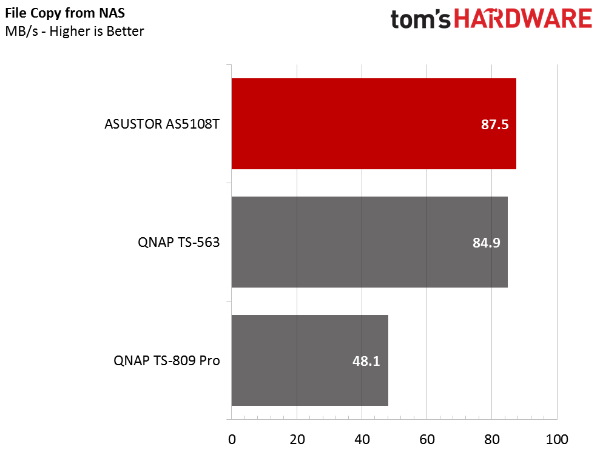
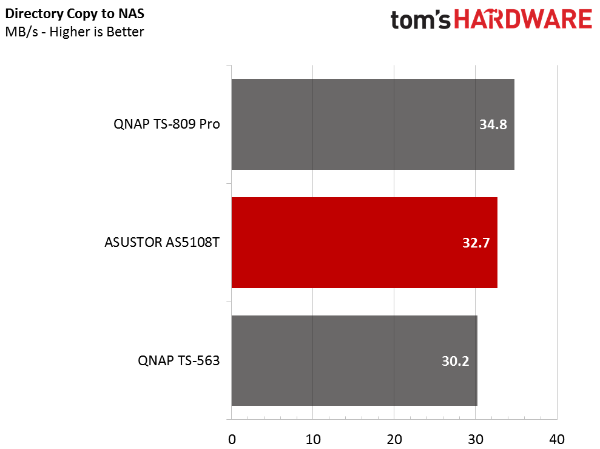
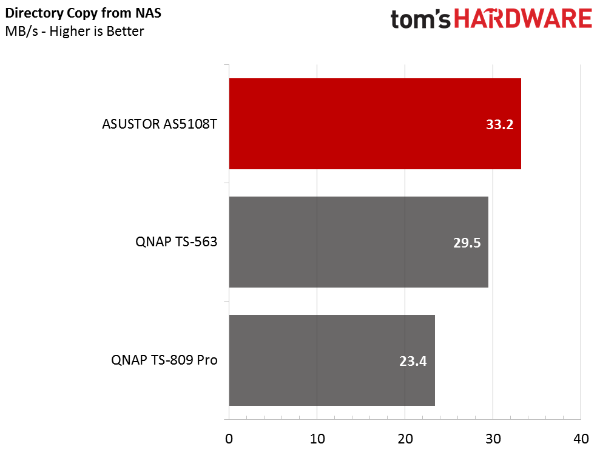
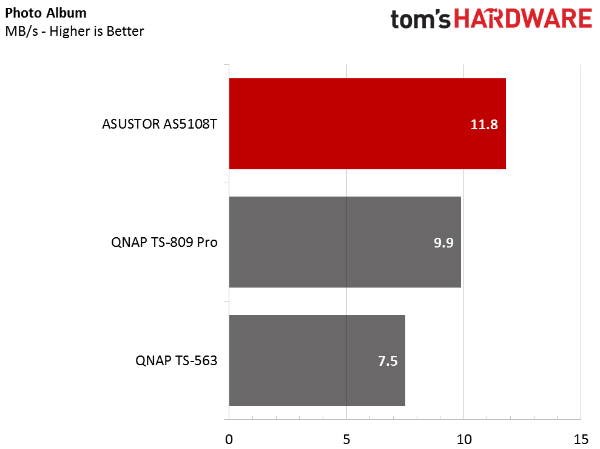
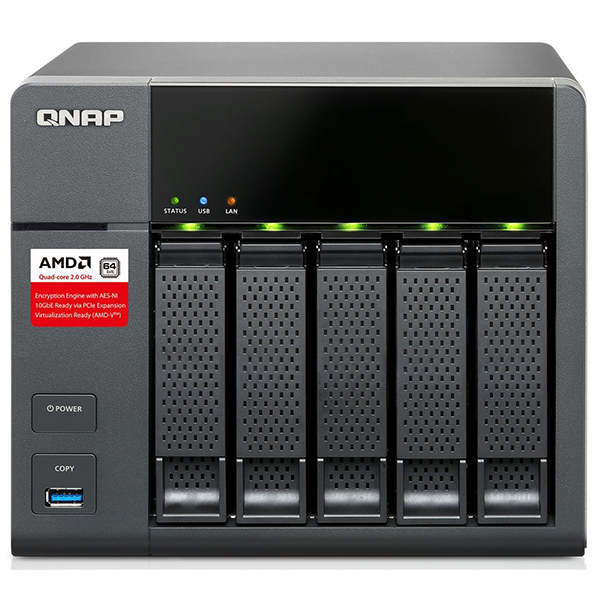
All three of our comparison systems are considered high-performance models. You don't need Xeon-class processing here. The QNAP TS-563 we tested even uses an AMD SoC, which performs well enough for most basic NAS applications. The same SoC works even better paired with a 10-gigabit Ethernet adapter.
Because the systems are powerful enough, and limited by their network interfaces, there isn't much separation in many of our daily use workloads.
iSCSI Desktop Workloads
iSCSI has yet to really catch on in the home and small business environments. Once it's deployed, though, most administrators never turn back to SMB. Mapping network drives is great and all, but dedicating resources through iSCSI delivers local storage functionality to your PC. It's like having a 64TB hard drive in your system. Configuring iSCSI is easy, and it's a secure connection so your data is safe.
These tests measure performance in time to completion. The results are in seconds, with lower being better.
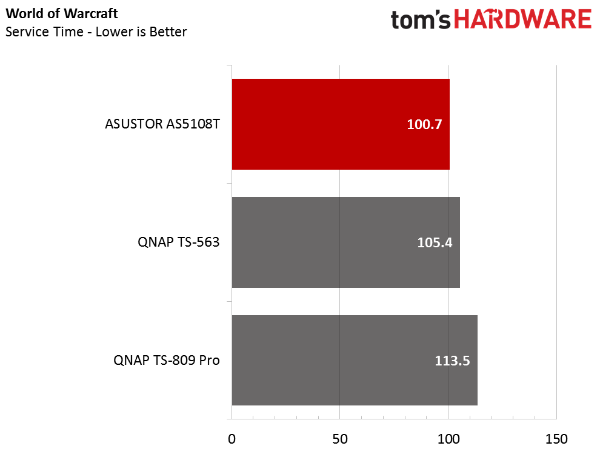
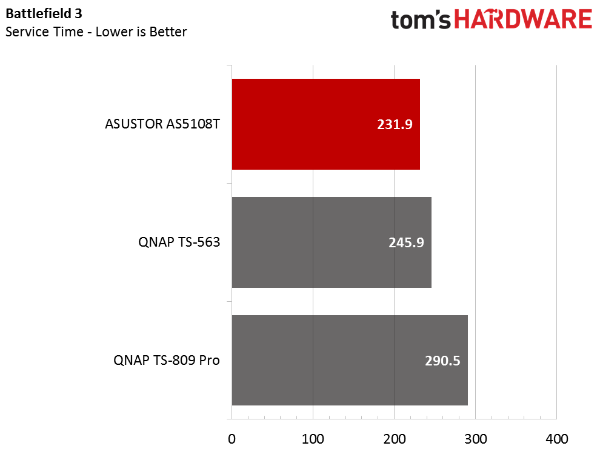
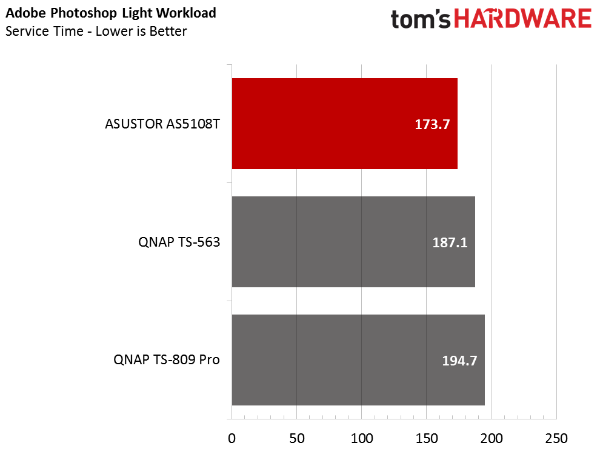
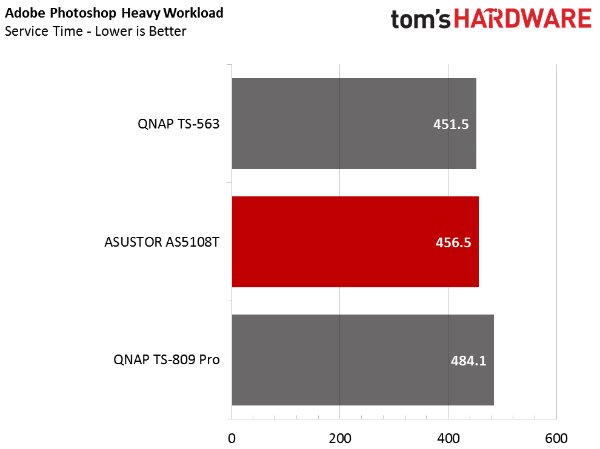
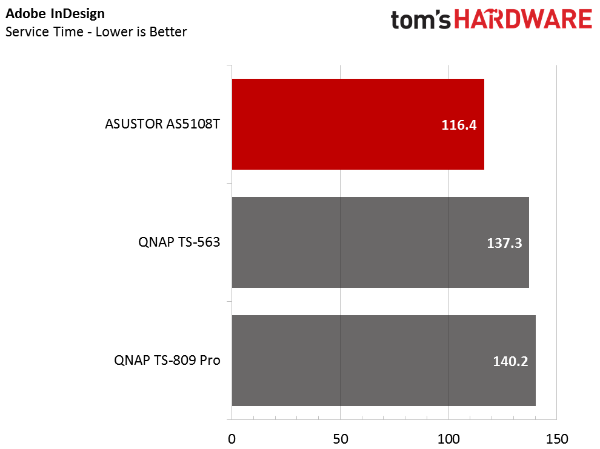
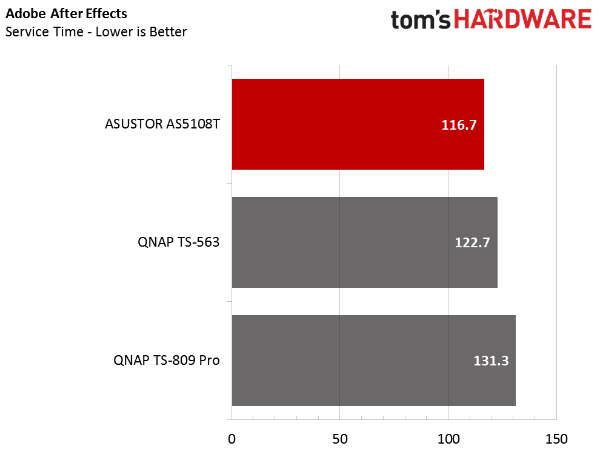
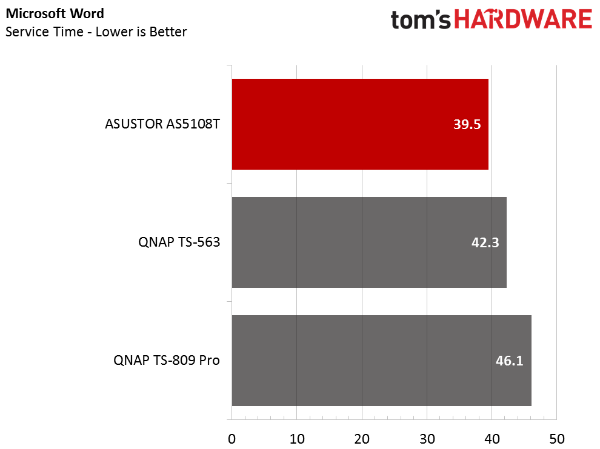
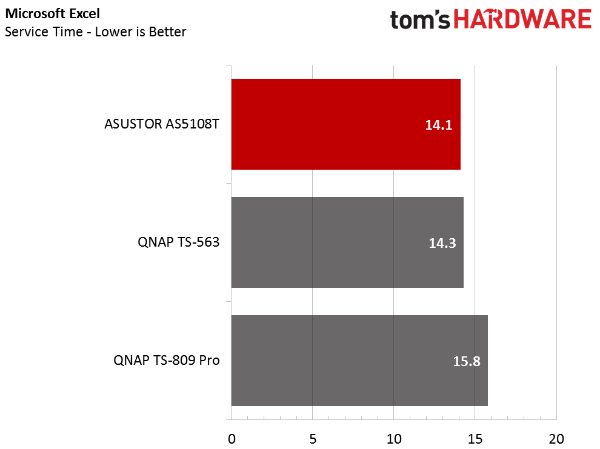
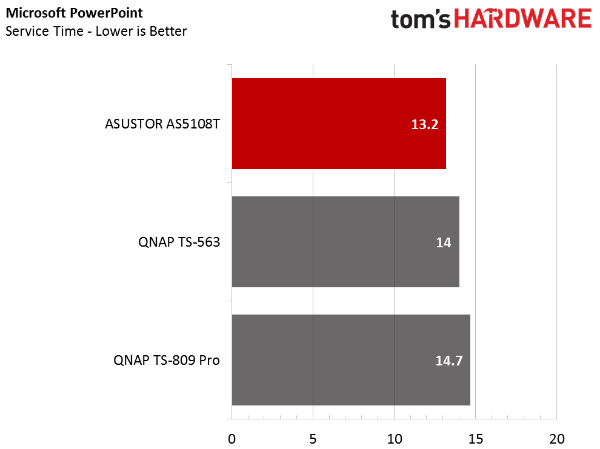
The AS5108T outperforms the other systems in nearly all of our iSCSI tests.
This chart takes the average throughput from each test and compares it in MB/s. A single Seagate NAS 4TB drive installed in a PC delivers 9.94 MB/s. Using iSCSI, all three appliances we're testing surpass this figure.
Get Tom's Hardware's best news and in-depth reviews, straight to your inbox.
Multi-Client SMB Testing
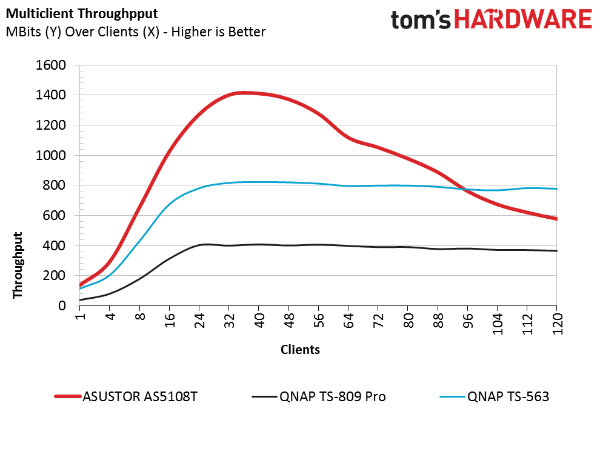
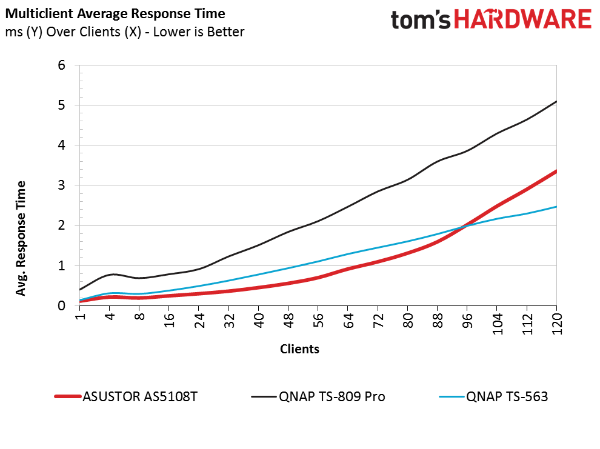
The multi-client test results come from 120 virtualized installations of Windows 7 running across 10 dual Xeon servers. Each server is armed with two six-port Hot Lava network interface cards. The ports are all one-gigabit. But when they're combined, they stress the NAS device under test. The workload is derived from traces in Microsoft Office applications like Word, Excel and Power Point. This is a custom benchmark that took over two years to piece together.
The results are reported two ways. Above, we see the throughput results measured in Mb/s. Since every user in an office will work at a different pace, presenting the server with a unique workload, you can't really use this test to pinpoint the number of employees a NAS will comfortably support. You can, however, see if a system reaches its peak performance before another to make an educated purchasing decision.
The average latency chart holds more weight since it directly relates to user experience. For a majority of the test, Asustor's AS5108T outperforms its competition. At 88 users, the small 2GB memory module becomes overwhelmed and the latency quickly rises.
Traditional Server Workloads
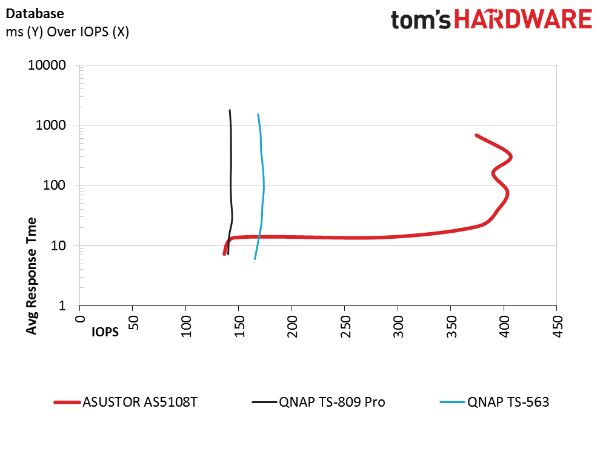
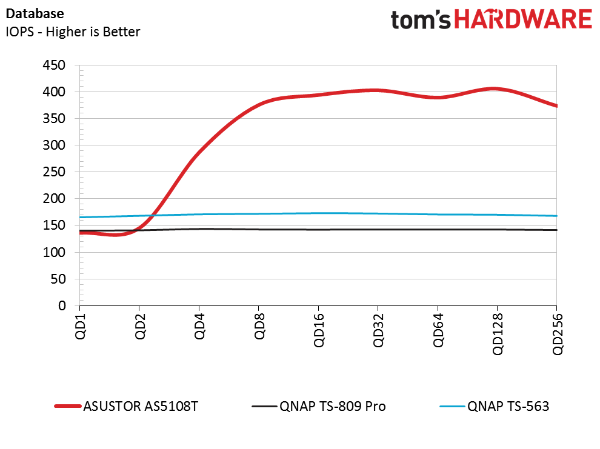
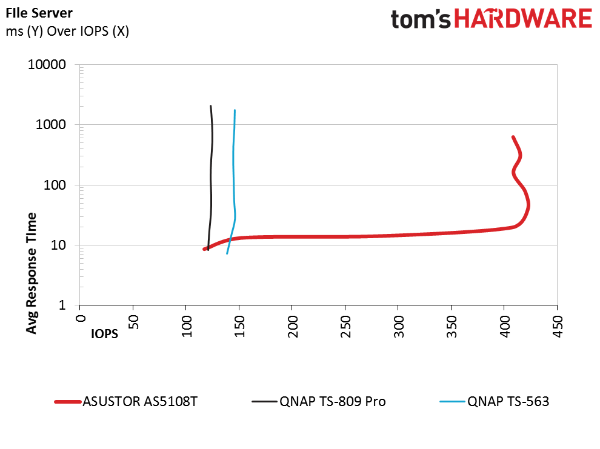
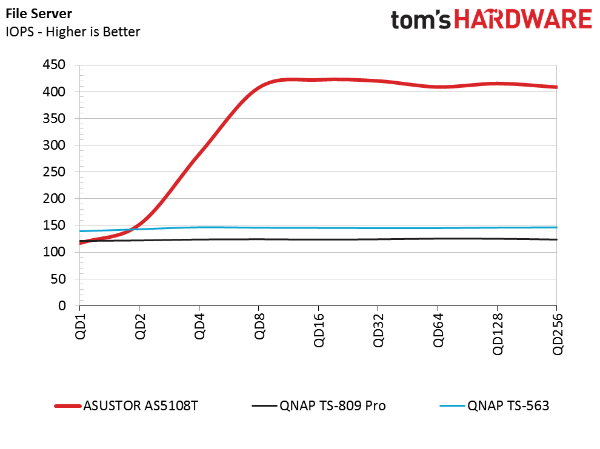
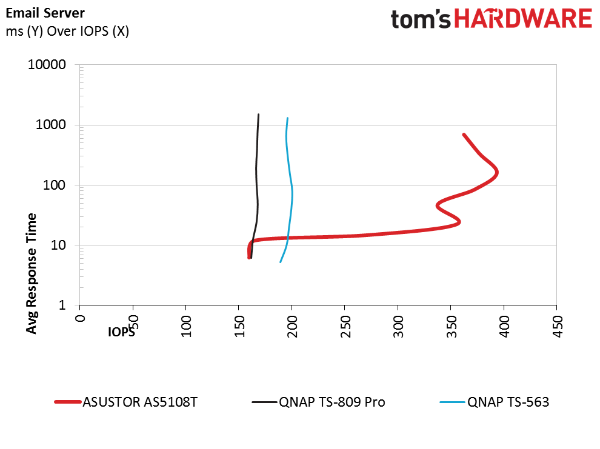
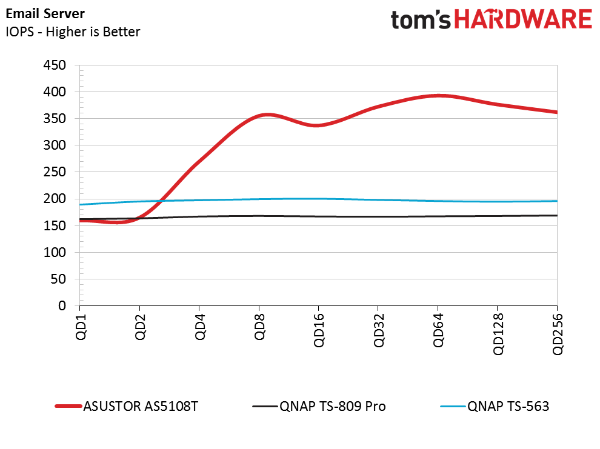
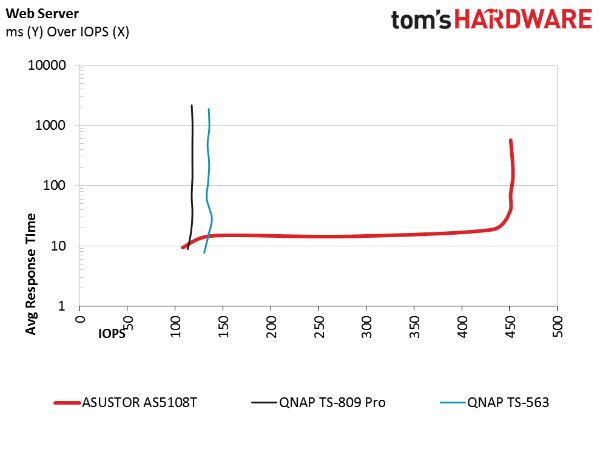
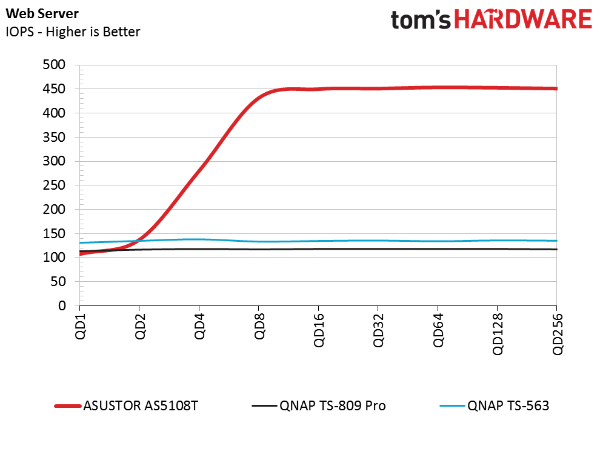
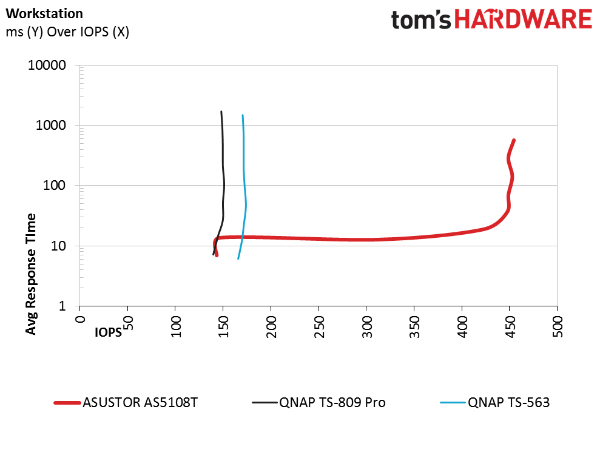
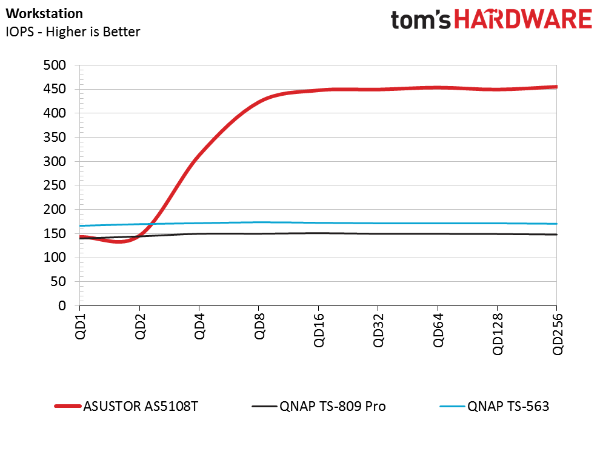
The AS5108T demonstrates great performance in our standard benchmark tests. The system's cache algorithm accelerates all of the workloads. It also delivers the type of Y over X charts that we see from large servers. As the workload intensifies, Asustor's AS5108T increases its IOPS to work through the load without an unreasonable latency increase. The hook portion of the graph where the IOPS stop rising is where latency starts to climb. You'll want to tune your workload ahead of that curve. Anything else will penalize you with increased response time.
Current page: SMB, iSCSI & Standard Server Workloads
Prev Page Four-Corner Testing Next Page Conclusion
Chris Ramseyer was a senior contributing editor for Tom's Hardware. He tested and reviewed consumer storage.
-
SirGCal I didn't see where they mentioned WHO made the NICs.. are they Intel, Realtech, Maxwell, etc? Or some of each? Only that they could be bundled...Reply
Also, was it ECC memory? -
jimmysmitty Reply16843464 said:I didn't see where they mentioned WHO made the NICs.. are they Intel, Realtech, Maxwell, etc? Or some of each? Only that they could be bundled...
Also, was it ECC memory?
I can't find anything stating what NICs they use. I would prefer Intel though.
And it is not ECC RAM. Celerons do not support ECC. Only Xeons do. -
expunged ReplyI didn't see where they mentioned WHO made the NICs.. are they Intel, Realtech, Maxwell, etc? Or some of each? Only that they could be bundled...
Also, was it ECC memory?
non ecc memory "SO-DIMM DDR3"
does not say on nic
more info here
http://www.asustor.com/product?p_id=36&lan=en#tab3 -
DongleKin Reply16843464 said:I didn't see where they mentioned WHO made the NICs.. are they Intel, Realtech, Maxwell, etc? Or some of each? Only that they could be bundled...
Also, was it ECC memory?
I can't find anything stating what NICs they use. I would prefer Intel though.
And it is not ECC RAM. Celerons do not support ECC. Only Xeons do.
There are plenty of non-Xeons that support ECC in Intel's product line. Core i3s, Pentiums, Celeron, Atoms. However, the Celeron J1900 (which is probably in this NAS) does not. -
Aris_Mp In the AS5102T model the pair of NICs is controlled by a couple of Broadcom ICs (BCM5778). This model has 4x Ethernet ports so for the second couple it might use different controllers.Reply
