Be Quiet! Dark Power Pro 11 1200W PSU Review
be quiet! says it's committed to building silent products, including the company's top PSU line, the Dark Power Pro 11. In this review, we will put the 1200 W Dark Power Pro 11 model to the test, which promises good performance and silent operation.
Why you can trust Tom's Hardware
Cross-Load Tests And Infrared Images
Our cross-load tests are described in detail here.
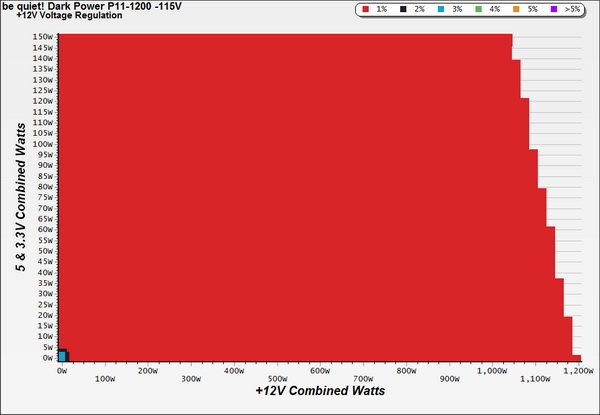
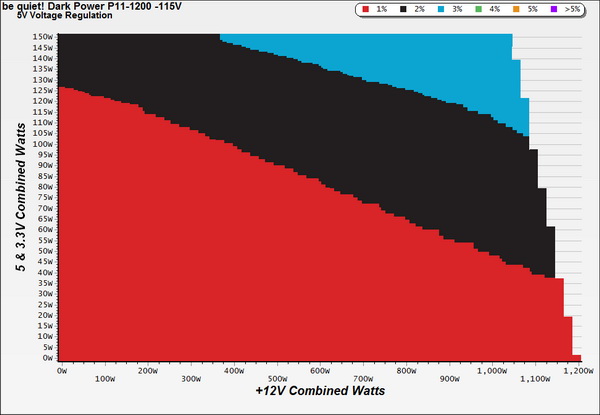
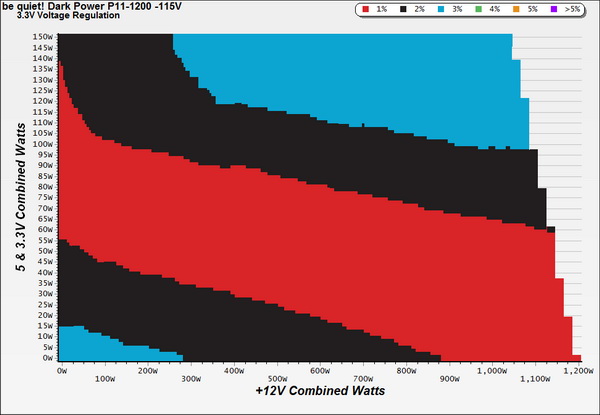
To generate the following charts, we set our loaders to auto mode through our custom-made software before trying more than 1,500 possible load combinations with the +12V, 5V and 3.3V rails. The load-regulation deviations in each of the charts below were calculated by taking the nominal values of the rails (12V, 5V and 3.3V) as point zero.
Load Regulation Charts
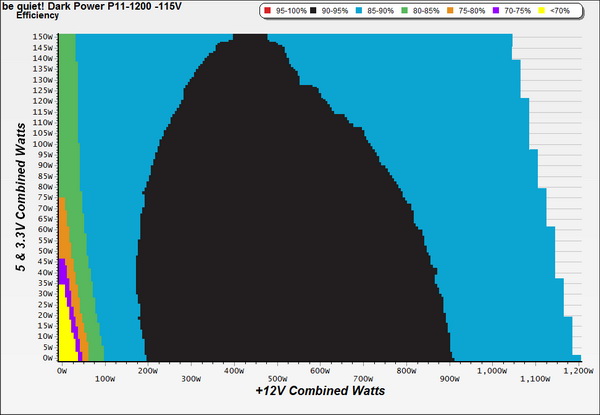
Efficiency Chart
As you can see from the efficiency graph above, for a large part of its operational range, the PSU's efficiency is above 90 percent. This is why you pay extra to get a Platinum PSU — to have increased efficiency for a wider operational range.
Ripple Charts
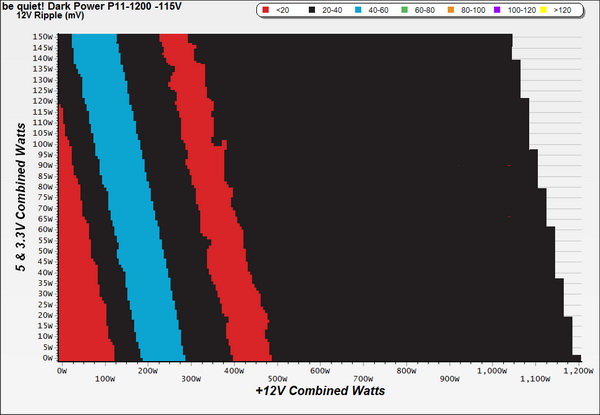
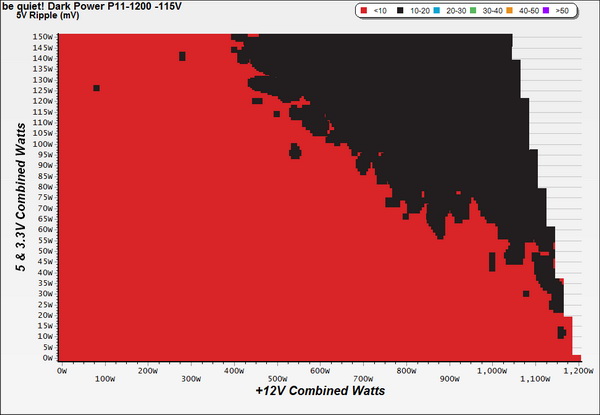
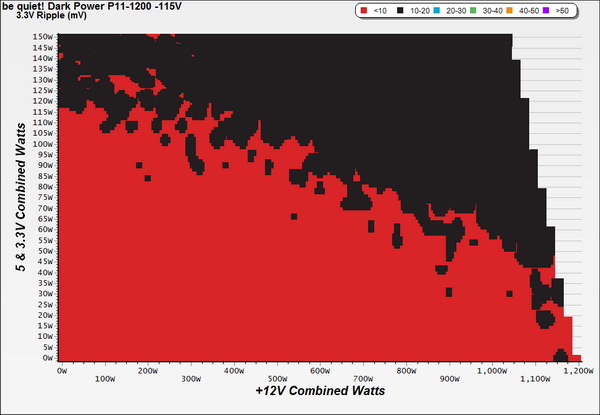
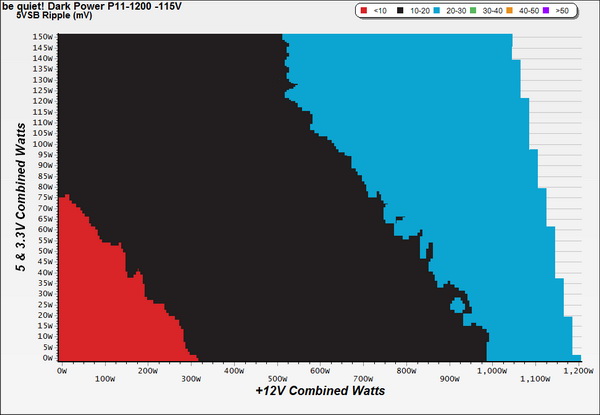
Did you notice the blue waterfall in the +12V rail's ripple chart? This depicts an increased ripple region. This is most likely caused by the operation of the LLC resonant controller, which forces the main switching FETs to operate in PWM mode at lower loads, while at normal loads it uses FM mode.
Infrared Images
Toward the end of the cross-load tests, we took some photos of the PSU with our modified FLIR E4 camera, which delivers 320x240 IR resolution (76,800 pixels).
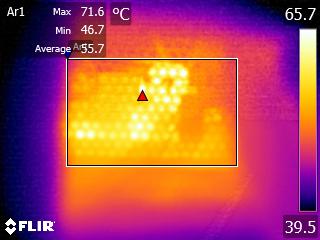
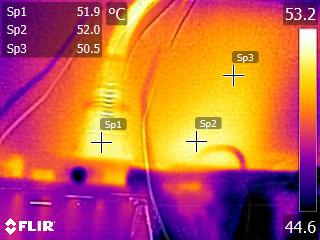
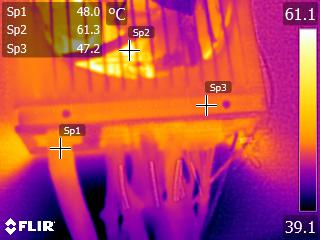
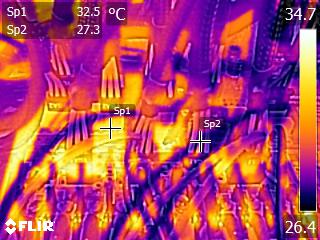
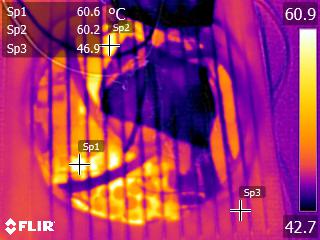
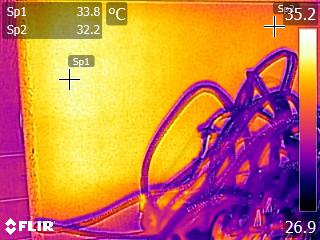
During the full-load and overload tests, with a close to 49 C ambient temperature, the temperatures inside the PSU were at very high levels naturally.
Get Tom's Hardware's best news and in-depth reviews, straight to your inbox.
Current page: Cross-Load Tests And Infrared Images
Prev Page Efficiency, Temperature And Noise Next Page Transient Response Tests
Aris Mpitziopoulos is a contributing editor at Tom's Hardware, covering PSUs.
-
Blueberries -12V Rail is very cool. These are really well built PSUs. I'd rather have a SeaSonic SS-1200 at this price range. I was expecting a better transient response change on the 5V rail, oh well.Reply -
chalabam Interesting, but way too much focus on PSUs over the kW, when the system builder marathons had peak overclocked power at 750w (and mostly 500w) for years now.Reply
And those computers spend most of the time running at 50/100 w, where even this unit efficiency is poor.
Good review, anyway, but I think that Tomshardware should focus on units that readers are more probable to buy. That info is more useful. -
chalabam Reply16727117 said:-12V Rail is very cool. These are really well built PSUs. I'd rather have a SeaSonic SS-1200 at this price range. I was expecting a better transient response change on the 5V rail, oh well.
Why you need 1200 W? What are you running? -
Blueberries Reply16727128 said:16727117 said:-12V Rail is very cool. These are really well built PSUs. I'd rather have a SeaSonic SS-1200 at this price range. I was expecting a better transient response change on the 5V rail, oh well.
Why you need 1200 W? What are you running?
Just because it's rated for 1200W doesn't mean you're drawing 1200W from the wall. The PSU in the article is a 1200W PSU so it makes sense to compare the two.
16727124 said:Interesting, but way too much focus on PSUs over the kW, when the system builder marathons had peak overclocked power at 750w (and mostly 500w) for years now.
And those computers spend most of the time running at 50/100 w, where even this unit efficiency is poor.
Good review, anyway, but I think that Tomshardware should focus on units that readers are more probable to buy. That info is more useful.
Power supplies are more efficient and put off less heat when they're not near their maximum load. If your system draws 500W you don't want to use a 550W PSU, you would be straining the PSU. SLI/CrossFire builds with multiple graphic processors can achieve a power draw of over 750W on the PCI Express rails alone!
I don't have a use for 1200W, but that wouldn't stop me from paying extra for better components, efficiency, and reduced noise. -
Aris_Mp indeed a PSU's peak efficiency is with typical loads (40-50% of its max rated capacity). However you should also take into account how long your system operates at full load. For example if your system is mostly working at idle or at low utilization then you will probably have more gain with a lower capacity PSU rather than with a high capacity one. On the other hand at high loads the stronger PSU will be closer to its sweet spot, having higher efficiency.Reply -
Blueberries Replyindeed a PSU's peak efficiency is with typical loads (40-50% of its max rated capacity). However you should also take into account how long your system operates at full load. For example if your system is mostly working at idle or at low utilization then you will probably have more gain with a lower capacity PSU rather than with a high capacity one. On the other hand at high loads the stronger PSU will be closer to its sweet spot, having higher efficiency.
It is absolutely true that power supplies are usually at their best efficiency around 50% of their maximum load, but that doesn't necessarily mean a smaller PSU is better. An AX1500 can peak at ~94% 12V efficiency, which is really good, but even at 300W it's still producing 91% efficiency, and over 90% at 150W. -
Blueberries Reply16732572 said:The AX1500i is a very special case :)
Be that as it may it's important to look at all of the factors. Amperage, Ripple, Efficiency, Hold-up, etc. Most important of all of course is build integrity and architecture. The best PSUs do have high loads, because well, they can handle it. They'll also last longer at any load.
An average load for an i7 user with a single high-powered video card is ~350W (gaming), a 980ti under maximum stress can be a 300-350W draw alone, bringing that up to a potential ~550W. In this scenario an RM750X is gold rated and will perform better than a Supernova P2 650W which is platinum rated. Both are extraordinary power supplies and I'd use either one. My point is, maximum load shouldn't matter. If a power supply meets more than your demands consider that a good thing. Most people aren't going to buy these PSUs unless they have a use for them because there's other options available.
The Dark Power Pro 11 in this article retains >90% efficiency from 200W-800W, which is a wide range, and your system load would want to fall between that range to be in the "sweet spot." A smaller PSU has a much smaller "sweet spot," but it could prove to be better. -
mctylr Replyindeed a PSU's peak efficiency is with typical loads (40-50% of its max rated capacity). However you should also take into account how long your system operates at full load.
It is absolutely true that power supplies are usually at their best efficiency around 50% of their maximum load, but that doesn't necessarily mean a smaller PSU is better.
All switching power supplies decrease their efficiencies as their load decreases, typically starting at or near 50% load and often rapidly decreasing efficiencies as their load falls below 20%.
For desktop systems, unless you run a distributed computation project in the background, 80-95% of the time the system is powered on, the system is idle or near-idle. In my limited testing a desktop system likely draws 50-100W at idle, so with a 1000W power supply it's operating at 5-10% load, and thus at its worst efficiencies.
With Haswell and newer consumer Intel's CPUs maxing out at 145W (I believe) at stock frequencies, and most video cards needing under 200-250 W maximum (980Ti 250W), a system with a single GPU rarely needs more then 600W.
Specifying the PS for 50% load (for maximum efficiency) to match the maximum load the system is actually capable of drawing is a poor efficiency trade-off, as the system will spend the majority of time time at under 20% utilization, at its worst efficiency, that the few percentage points of increased efficiency (at 50% load versus moderately higher loads) will result in a net lost.
Edited: Clarify first paragraph -
Blueberries Reply16734708 said:indeed a PSU's peak efficiency is with typical loads (40-50% of its max rated capacity). However you should also take into account how long your system operates at full load.
It is absolutely true that power supplies are usually at their best efficiency around 50% of their maximum load, but that doesn't necessarily mean a smaller PSU is better.
All switching power supplies decrease their efficiencies as their load decreases, typically starting at or near 50% load and often rapidly decreasing efficiencies as their load falls below 20%.
For desktop systems, unless you run a distributed computation project in the background, 80-95% of the time the system is powered on, the system is idle or near-idle. In my limited testing a desktop system likely draws 50-100W at idle, so with a 1000W power supply it's operating at 5-10% load, and thus at its worst efficiencies.
With Haswell and newer consumer Intel's CPUs maxing out at 145W (I believe) at stock frequencies, and most video cards needing under 200-250 W maximum (980Ti 250W), a system with a single GPU rarely needs more then 600W.
Specifying the PS for 50% load (for maximum efficiency) to match the maximum load the system is actually capable of drawing is a poor efficiency trade-off, as the system will spend the majority of time time at under 20% utilization, at its worst efficiency, that the few percentage points of increased efficiency (at 50% load versus moderately higher loads) will result in a net lost.
Edited: Clarify first paragraph
Yes but titanium efficiency PSUs retain 90% efficiency at a 10% load and platinum achieve at least 90% efficiency at 20% load. See: https://en.wikipedia.org/wiki/80_Plus
If the components are good they'll be able to handle a large load. There's no such thing as a good PSU that can't handle a large load. Most platinum PSUs can handle well over what they're rated for.
