Why you can trust Tom's Hardware
We measure real-world power consumption using Powenetics testing hardware and software. We capture in-line GPU power consumption by collecting data while looping Metro Exodus and while running the FurMark stress test. Our test PC remains the same old Core i9-9900K as we've used previously, to keep results consistent.
Besides Powenetics, we also have power results reported via FrameView. These are software values, which in testing tend to be a few percent lower than the actual power values, but they're at least relatively close on Nvidia hardware. We'll be switching to PCAT going forward, on our newer 13900K and 7950X test PCs.
For the RTX 4090 cards, we've upped the quality setting in Metro Exodus to 4K extreme in order to tax the GPU as much as possible, and we run at 2560 x 1440 with FurMark. That's slightly different from the other GPUs we've tested in the past, but these charts are intended to represent something close to worst-case power consumption, temps, etc., so we check other settings to ensure we're pushing the GPUs as much as reasonably possible.
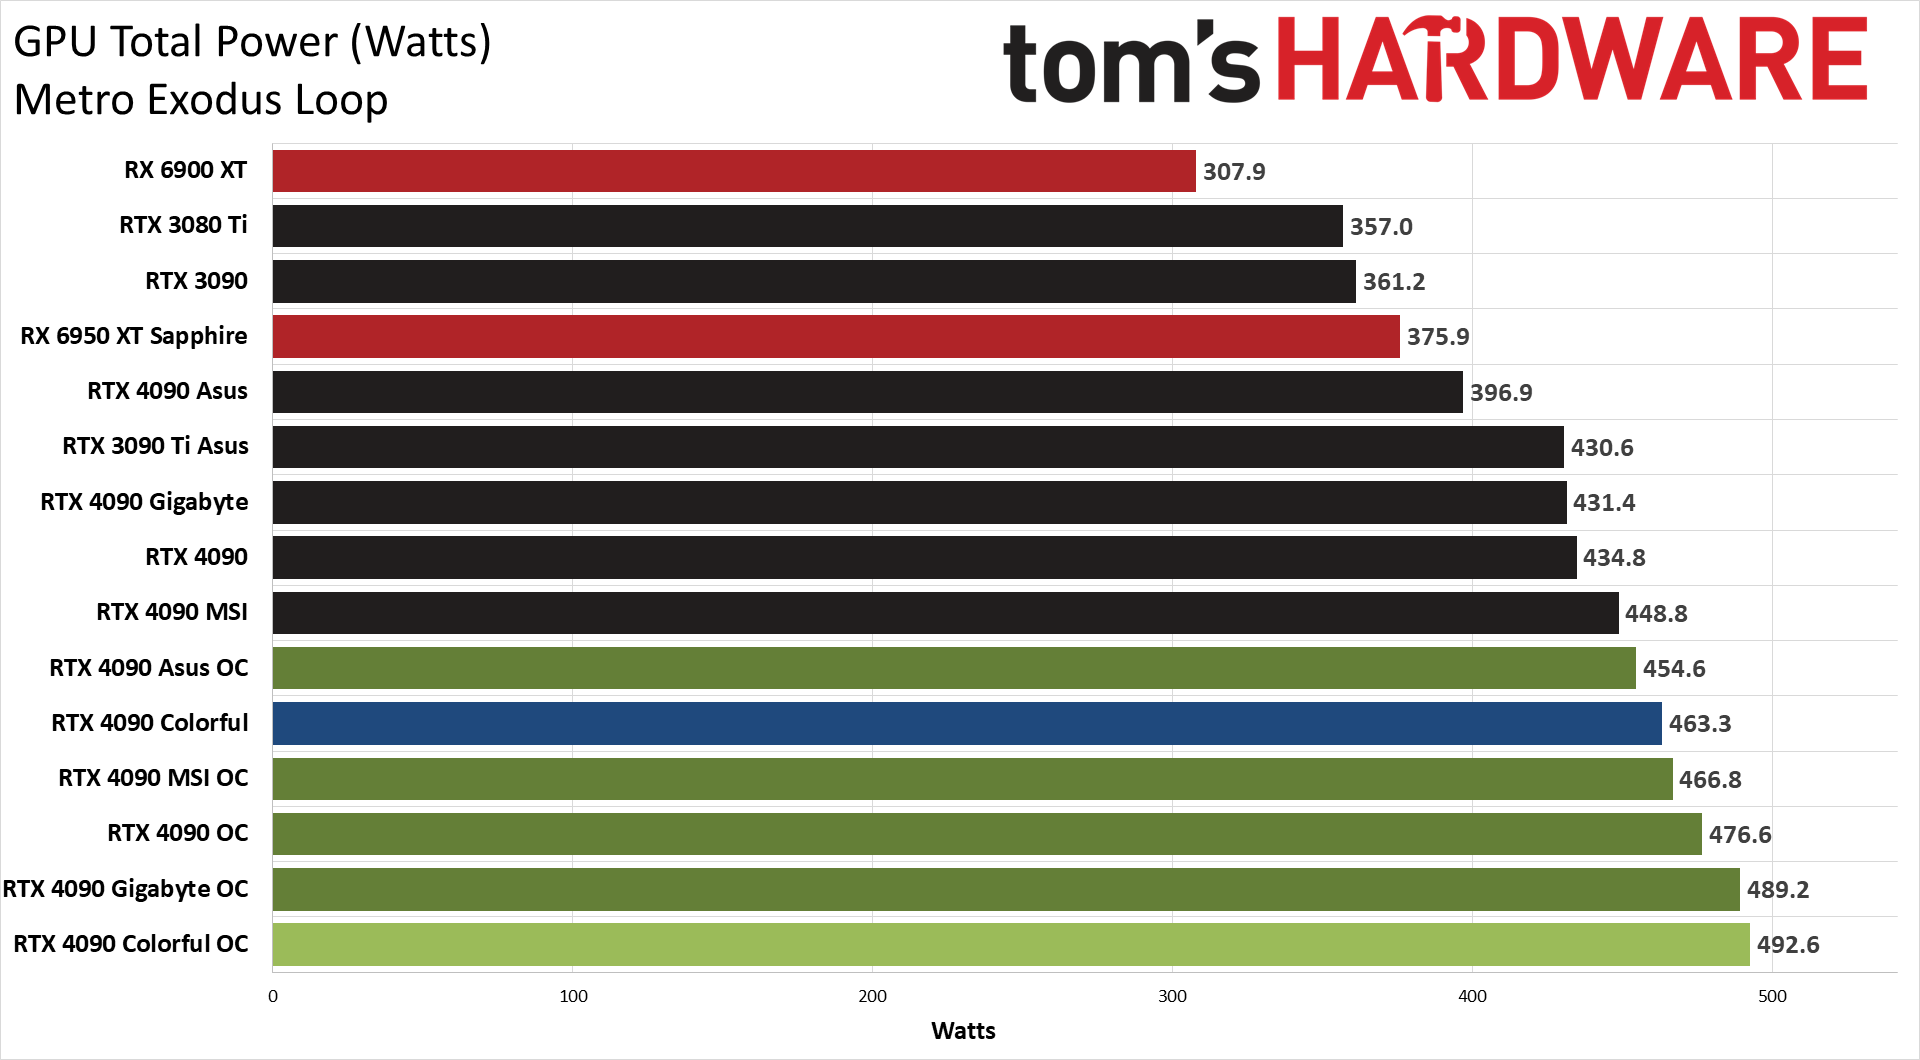
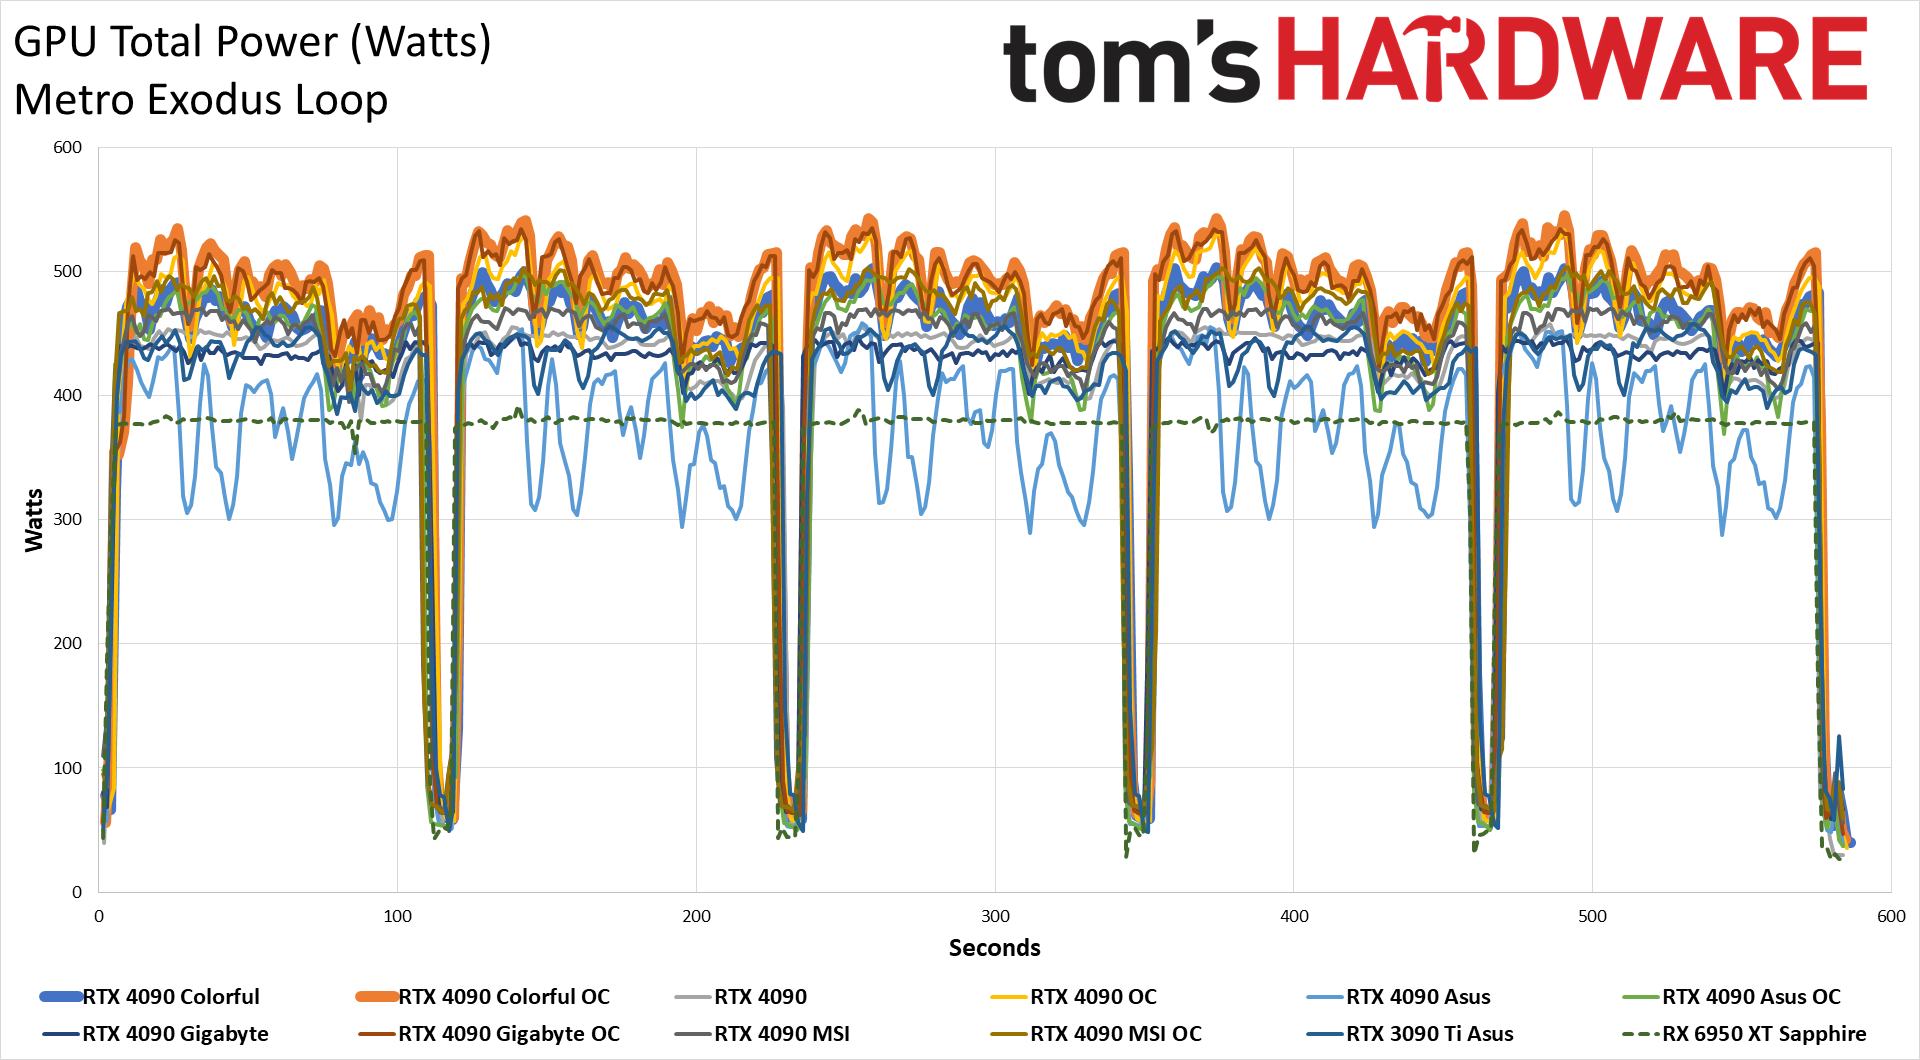
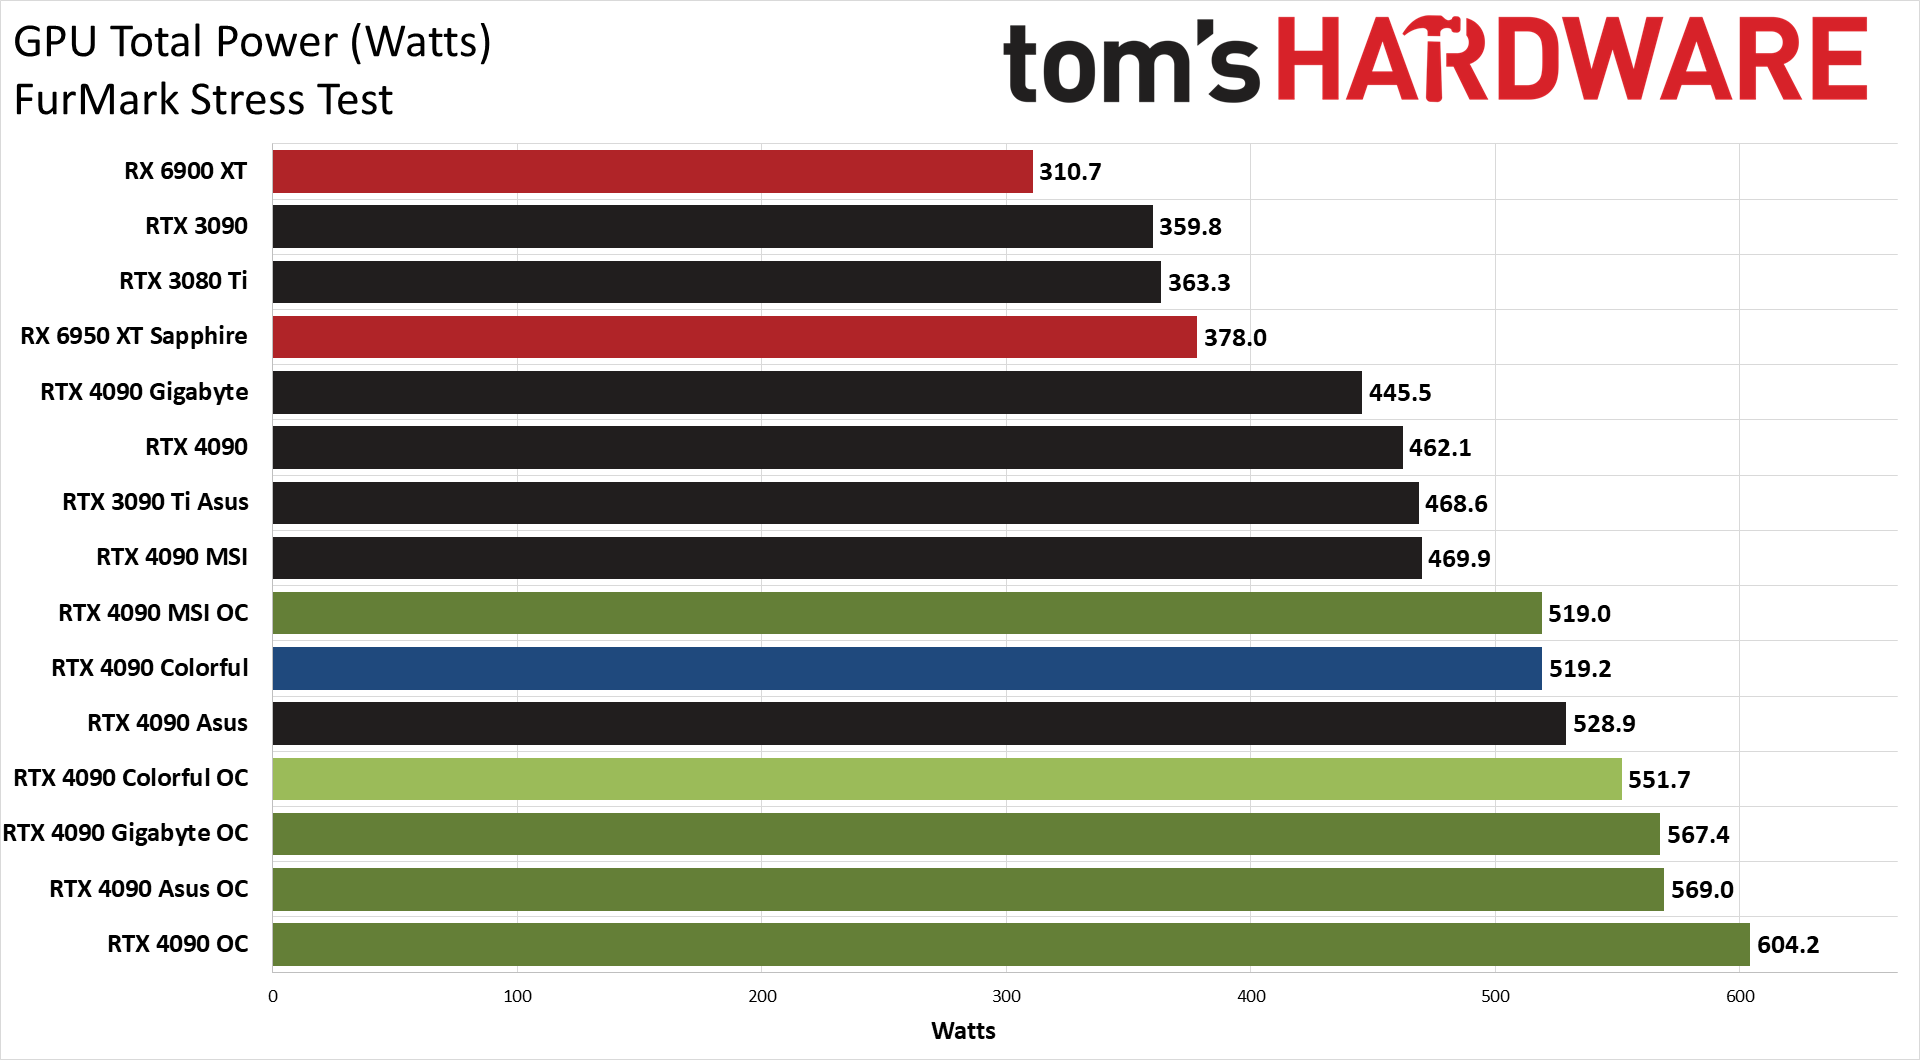
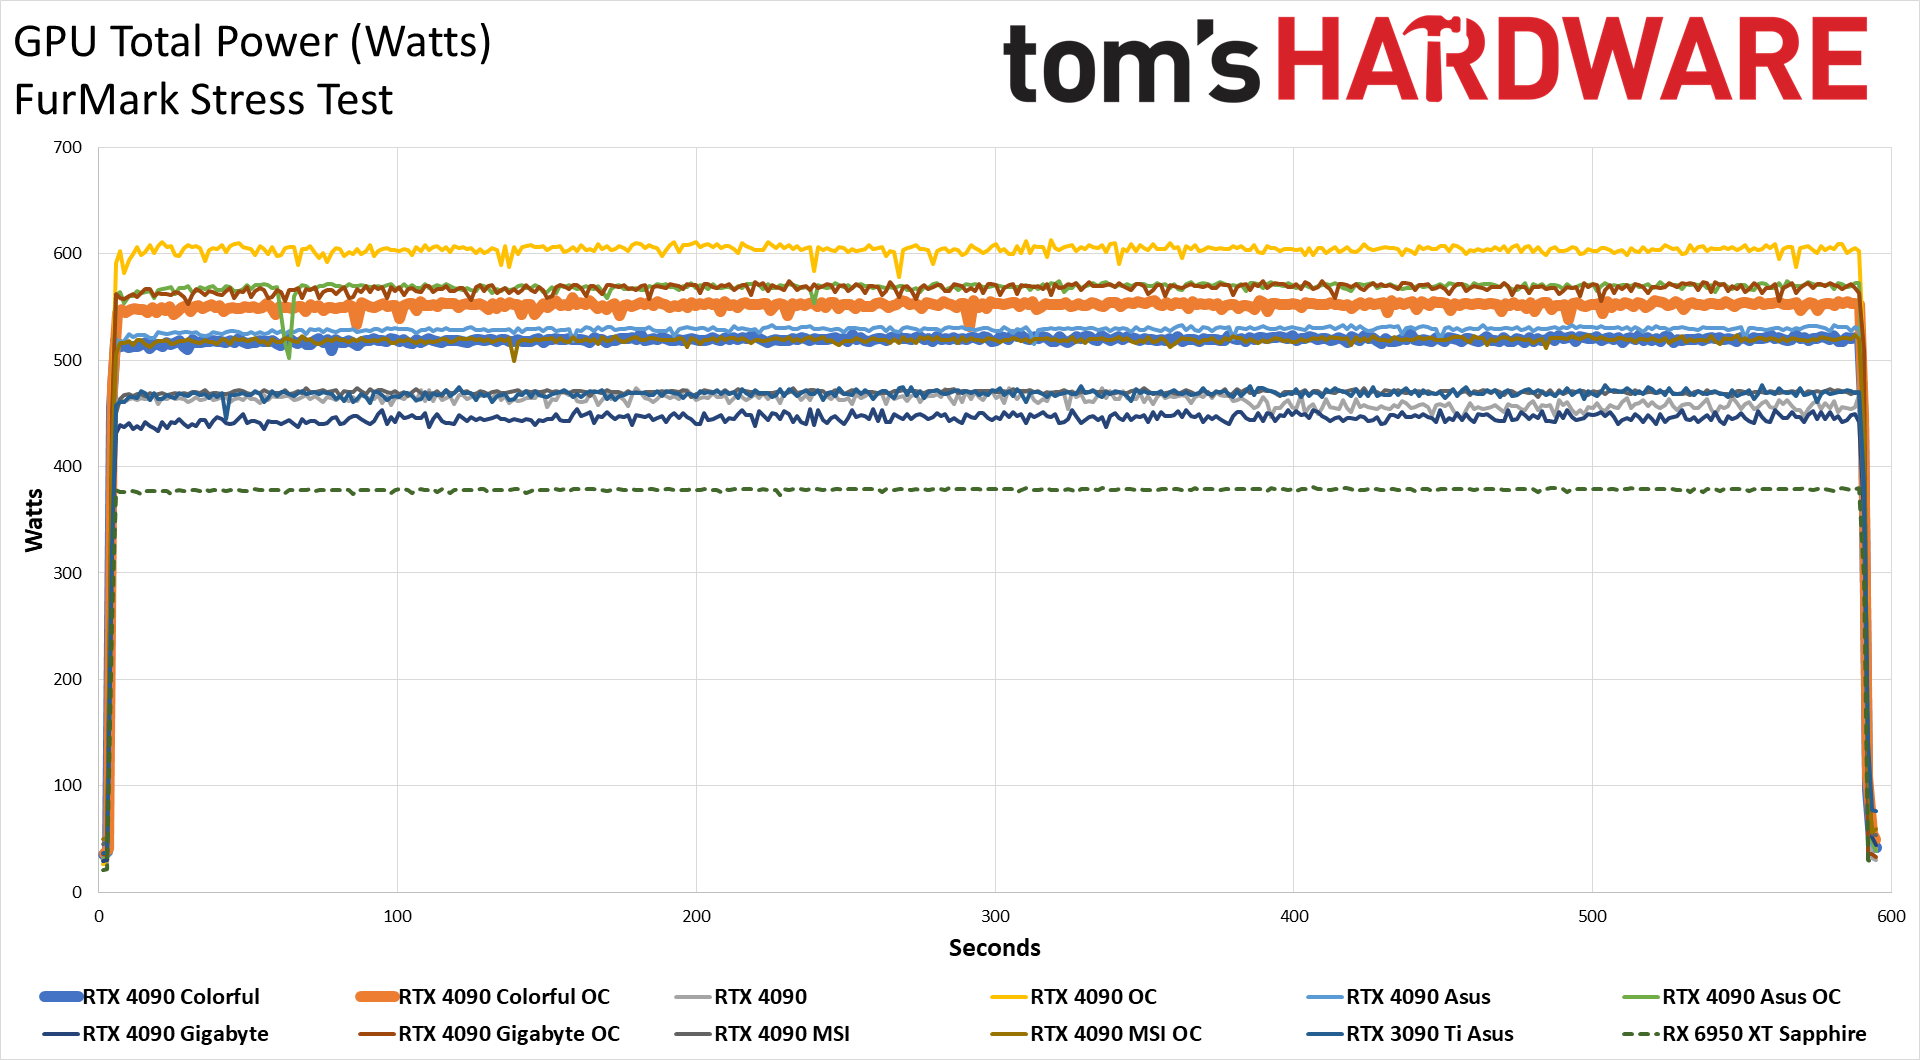
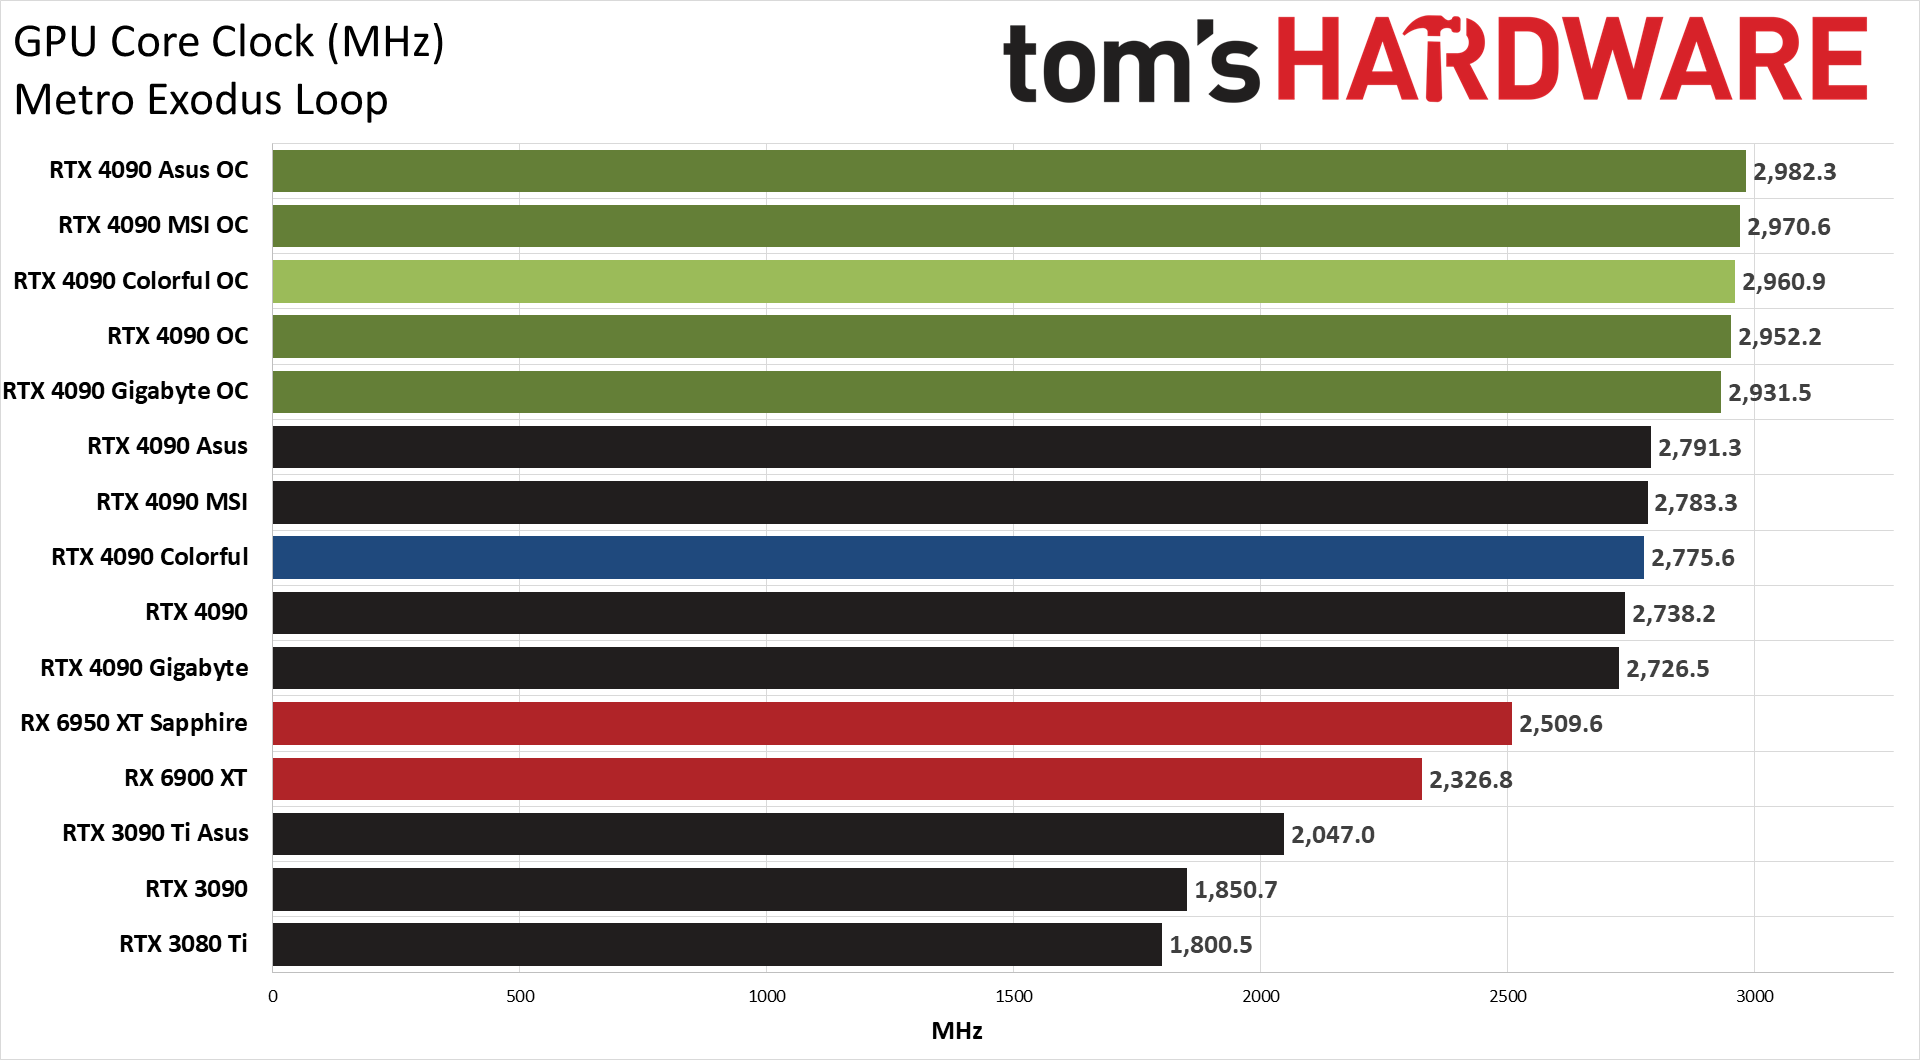
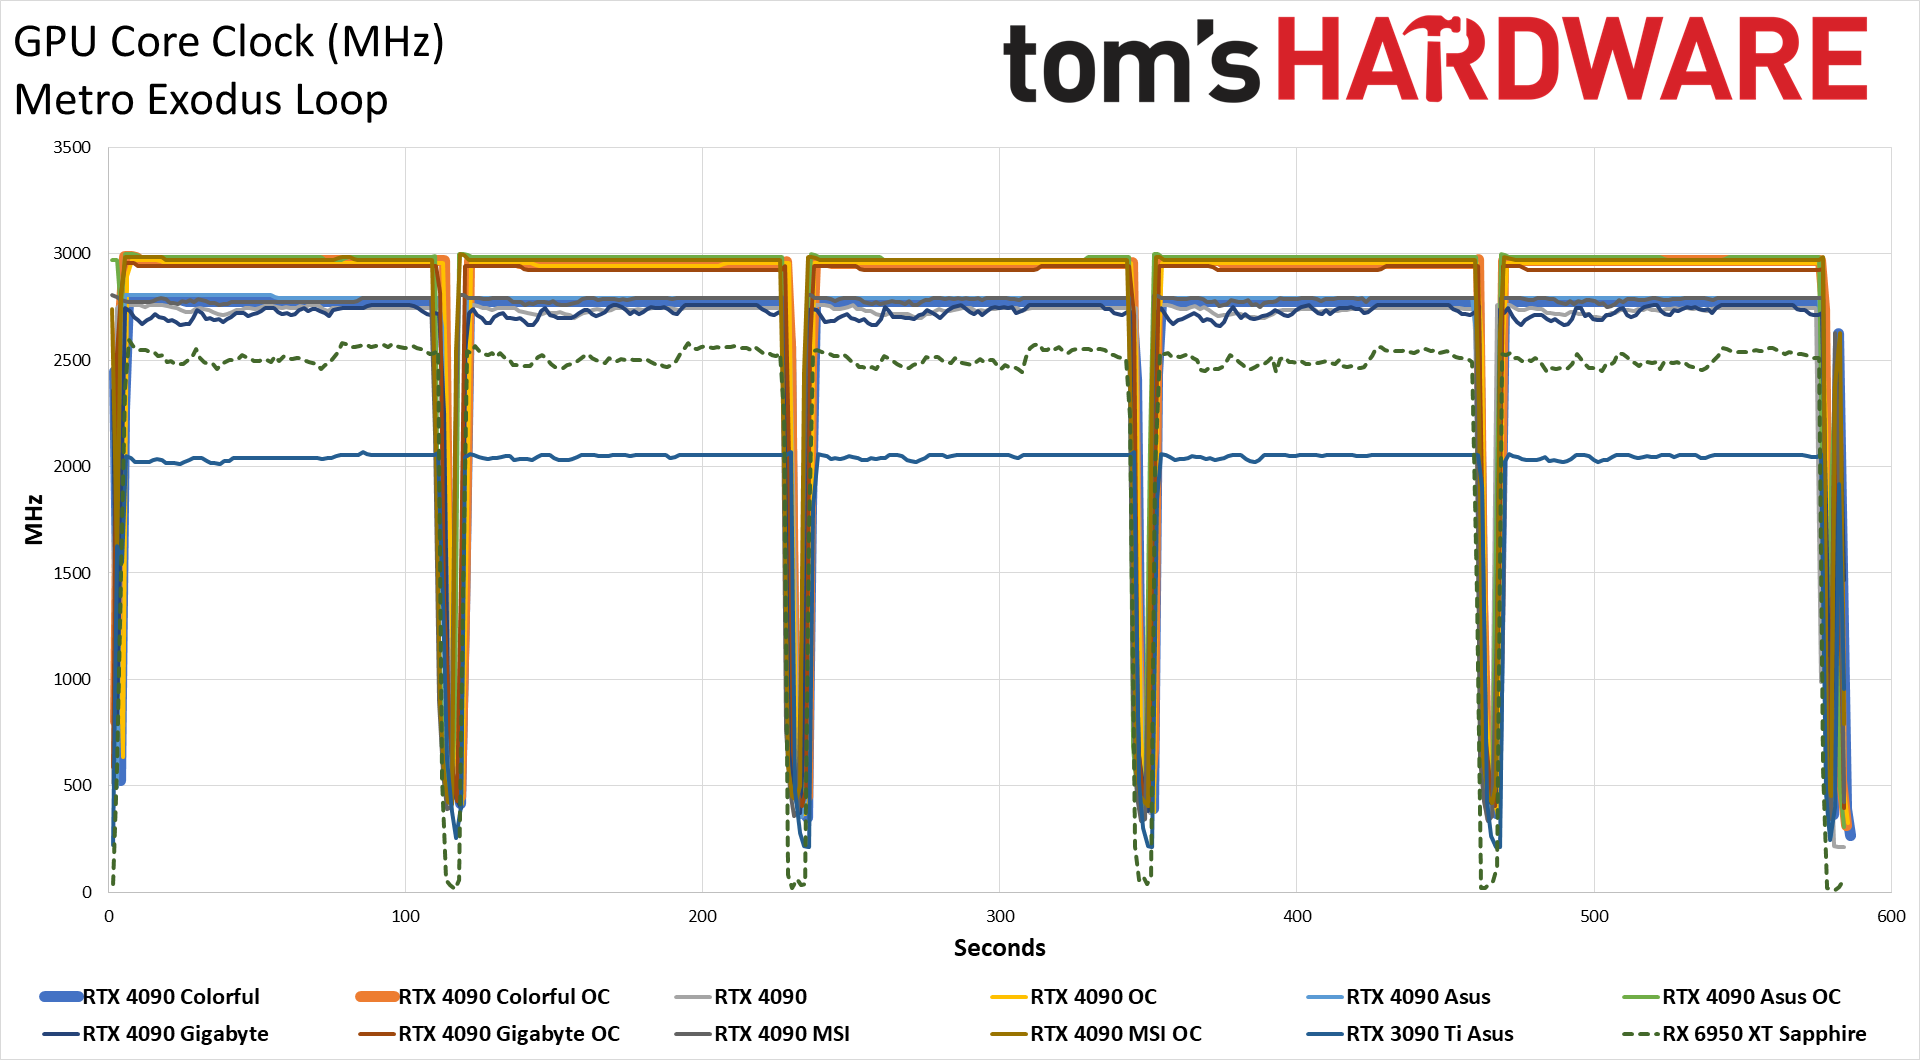
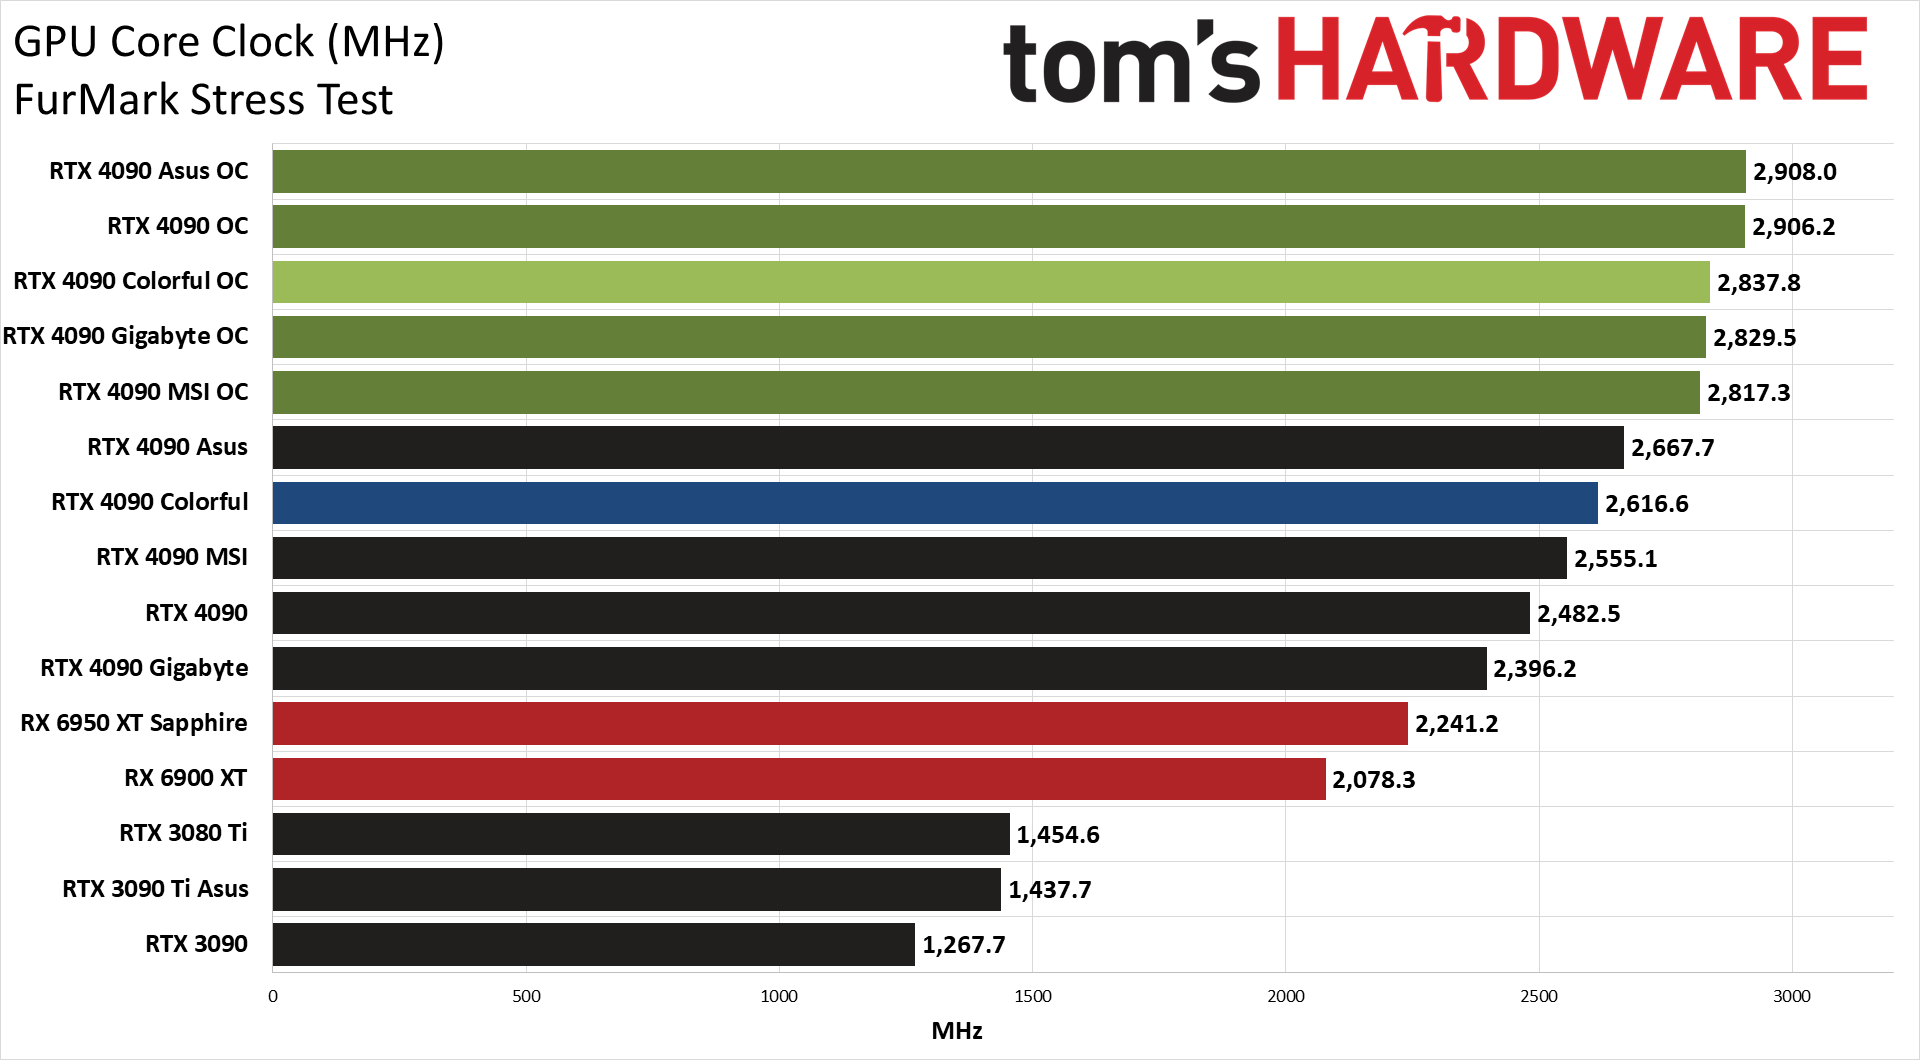
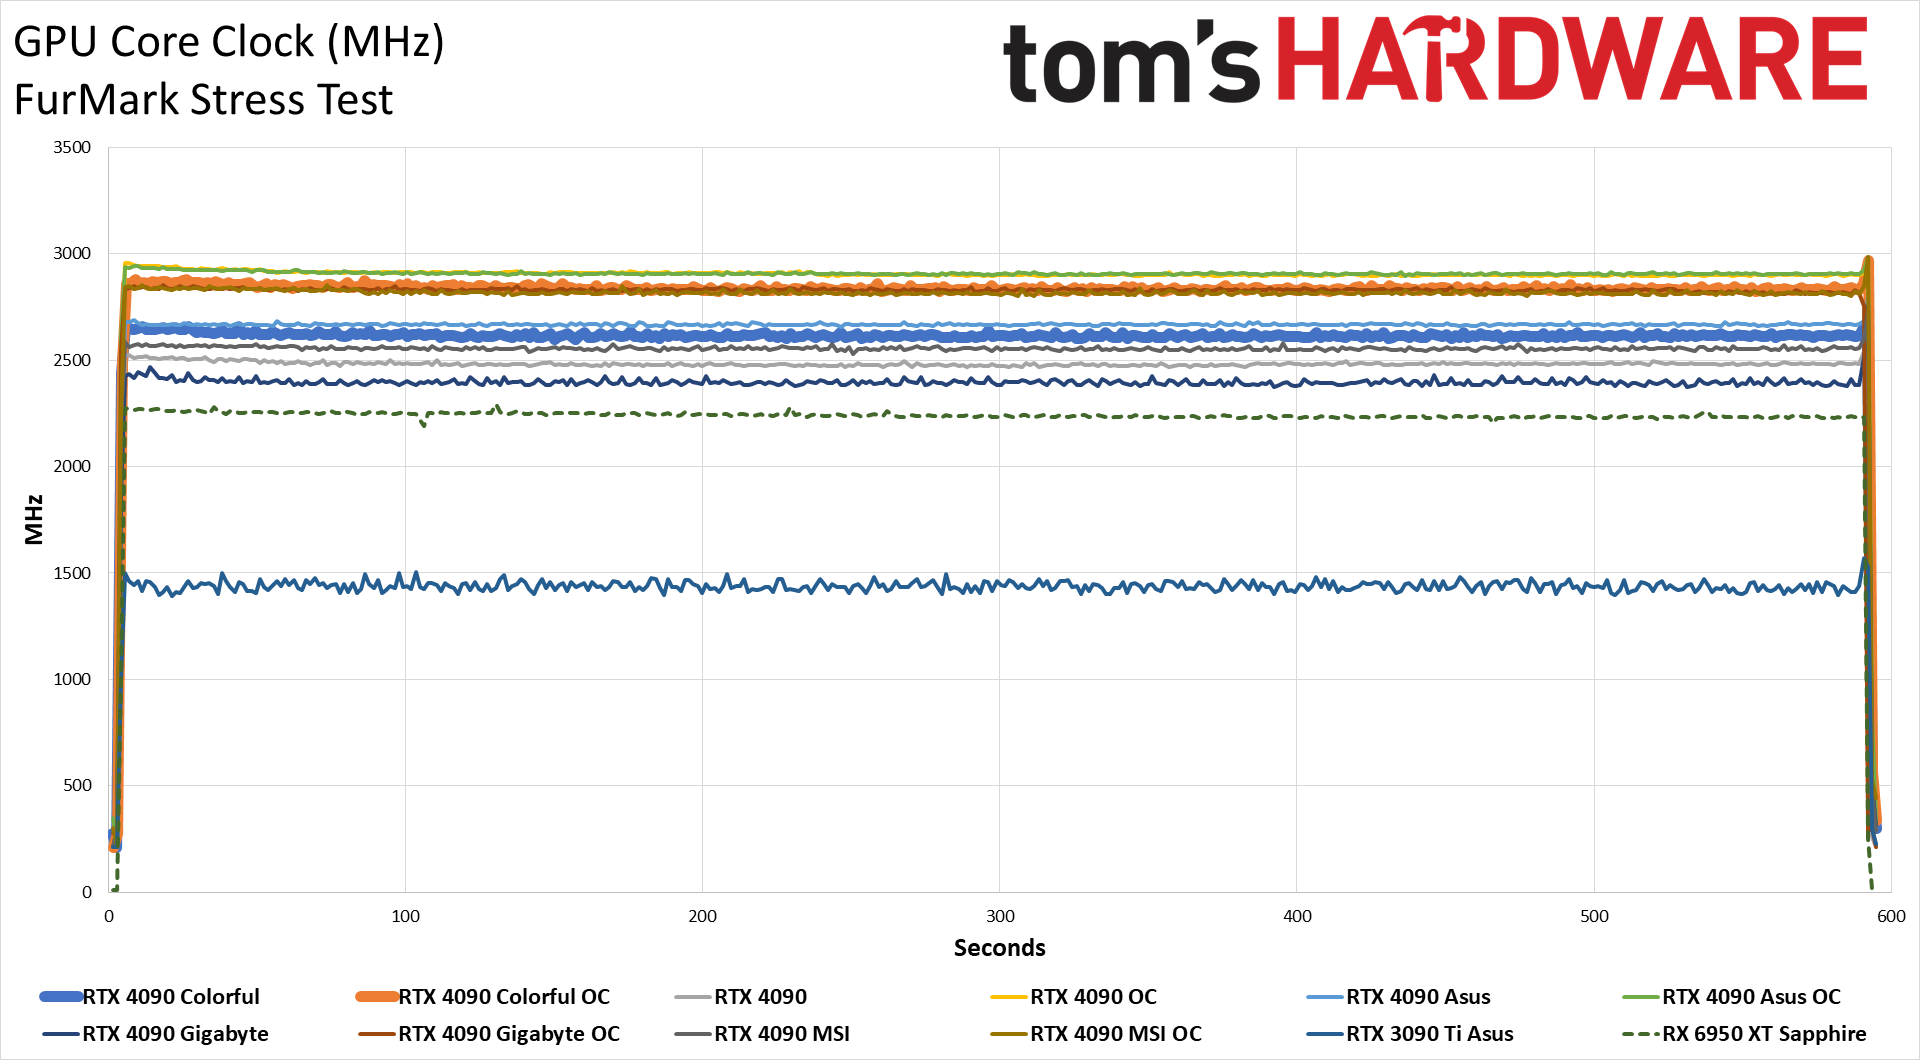
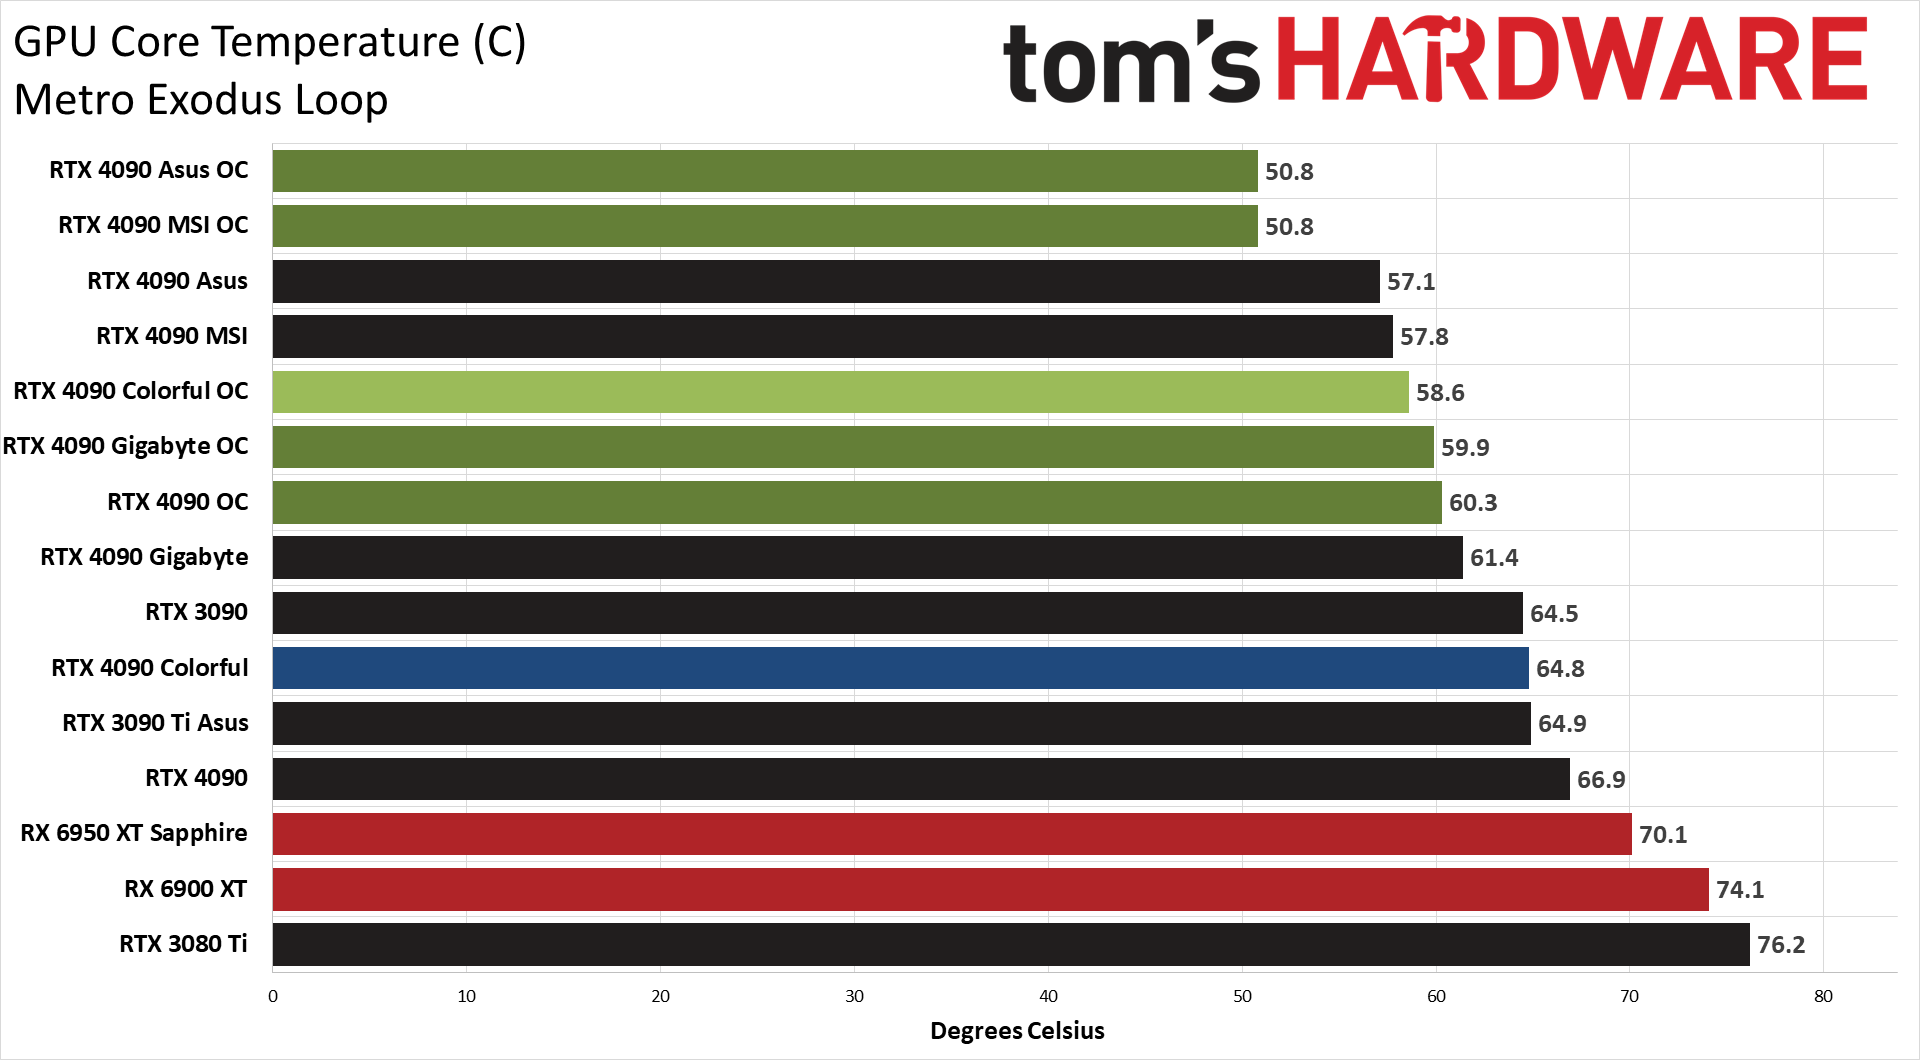
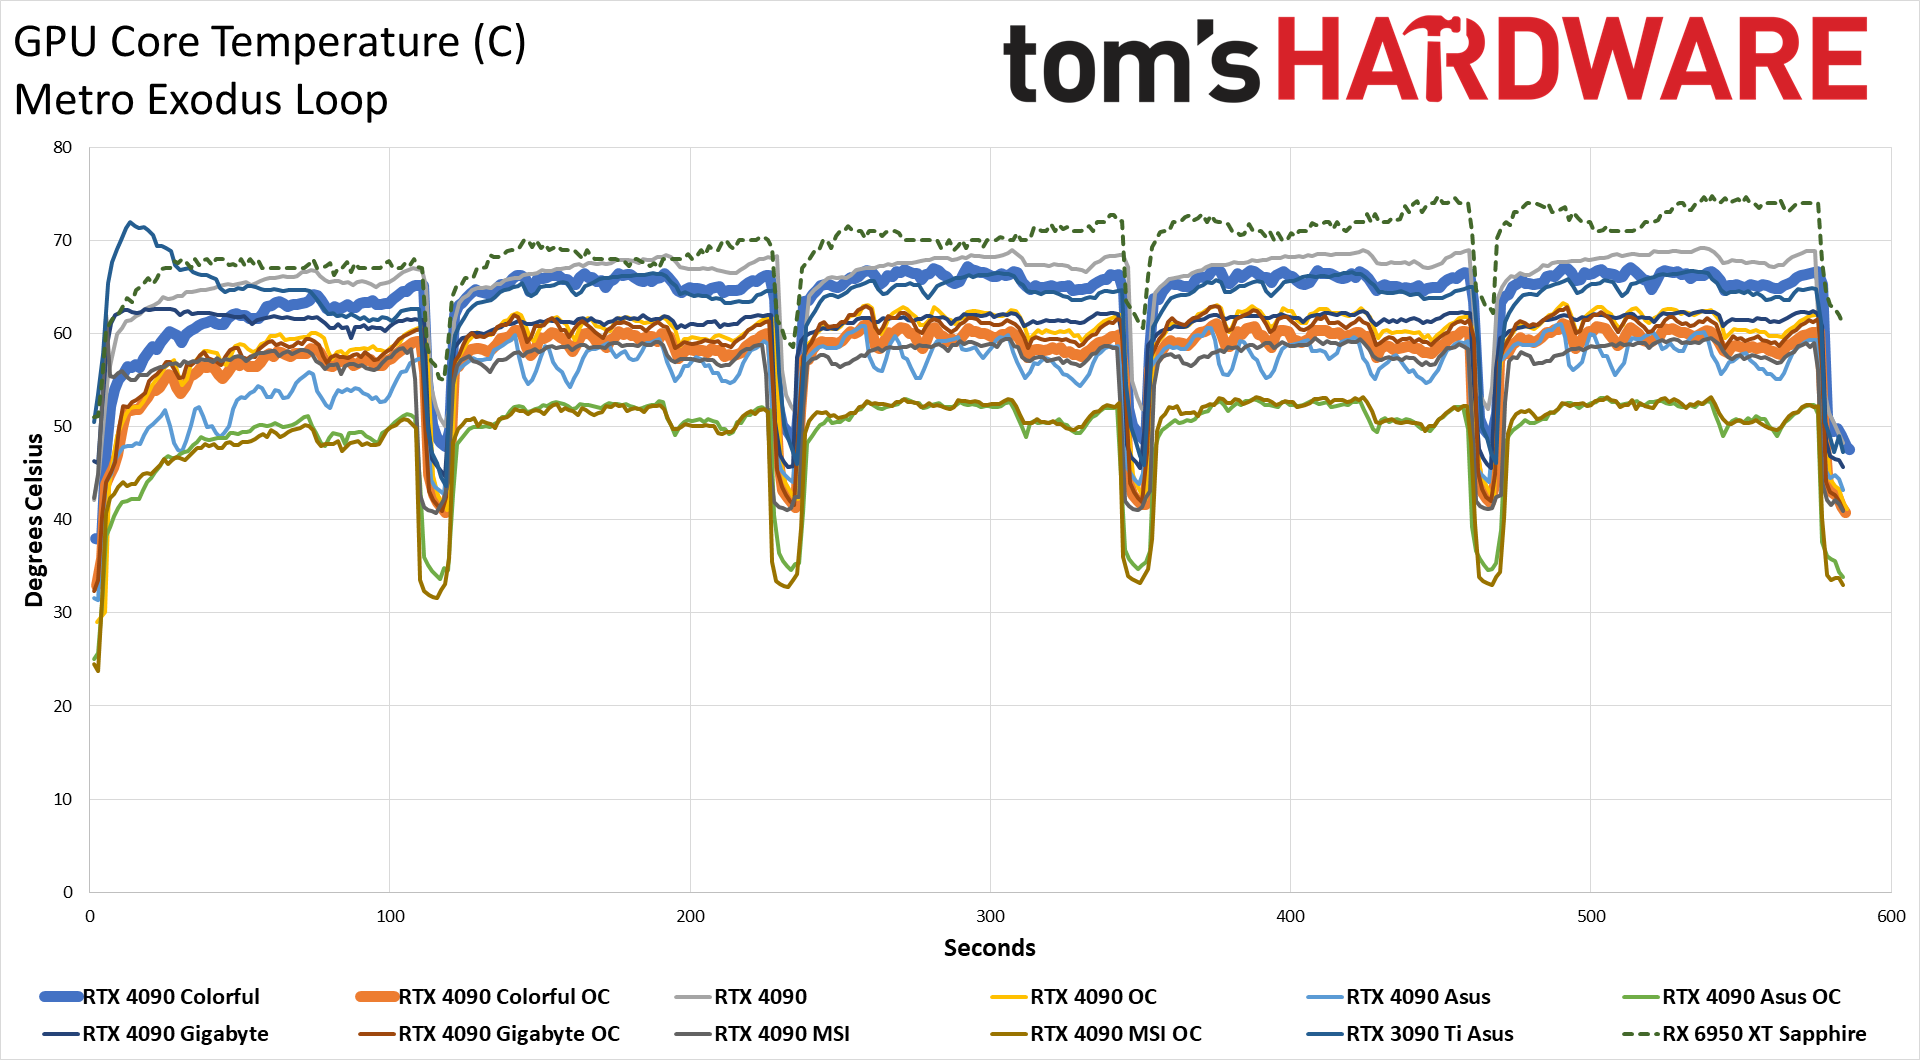
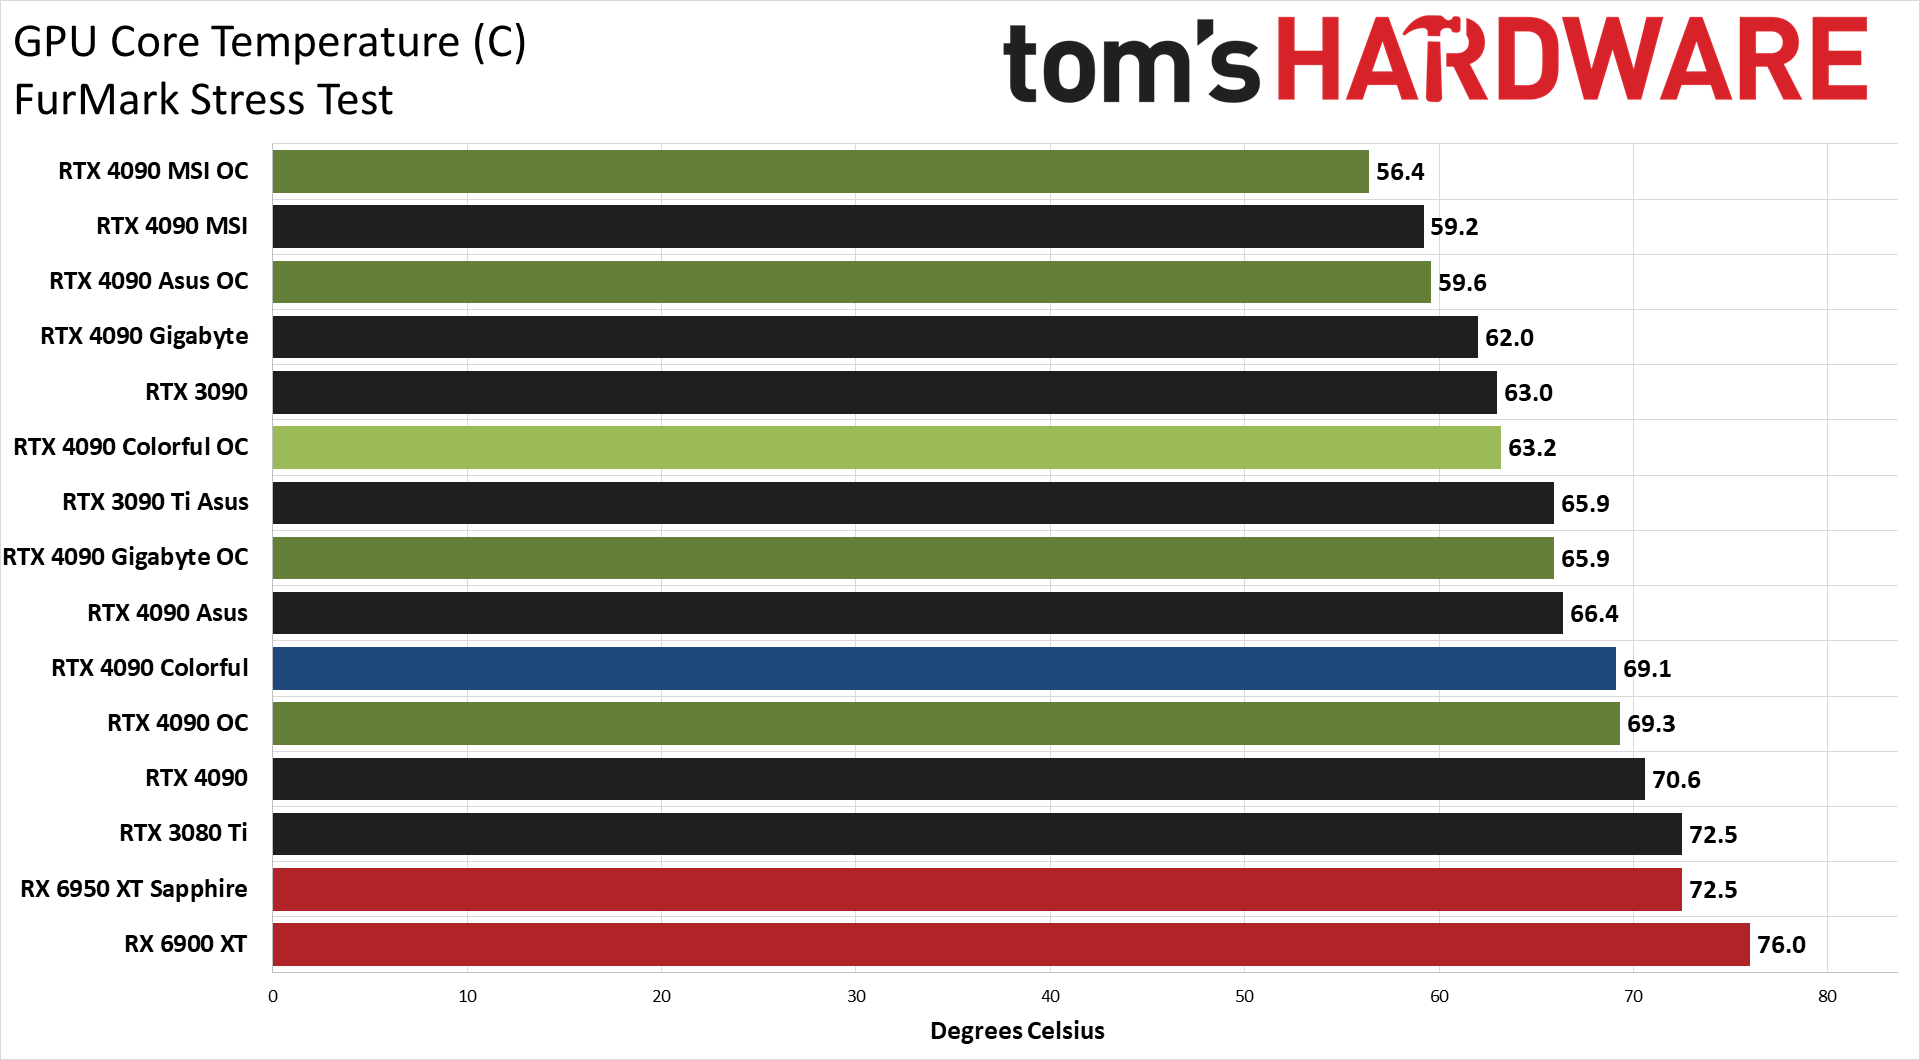
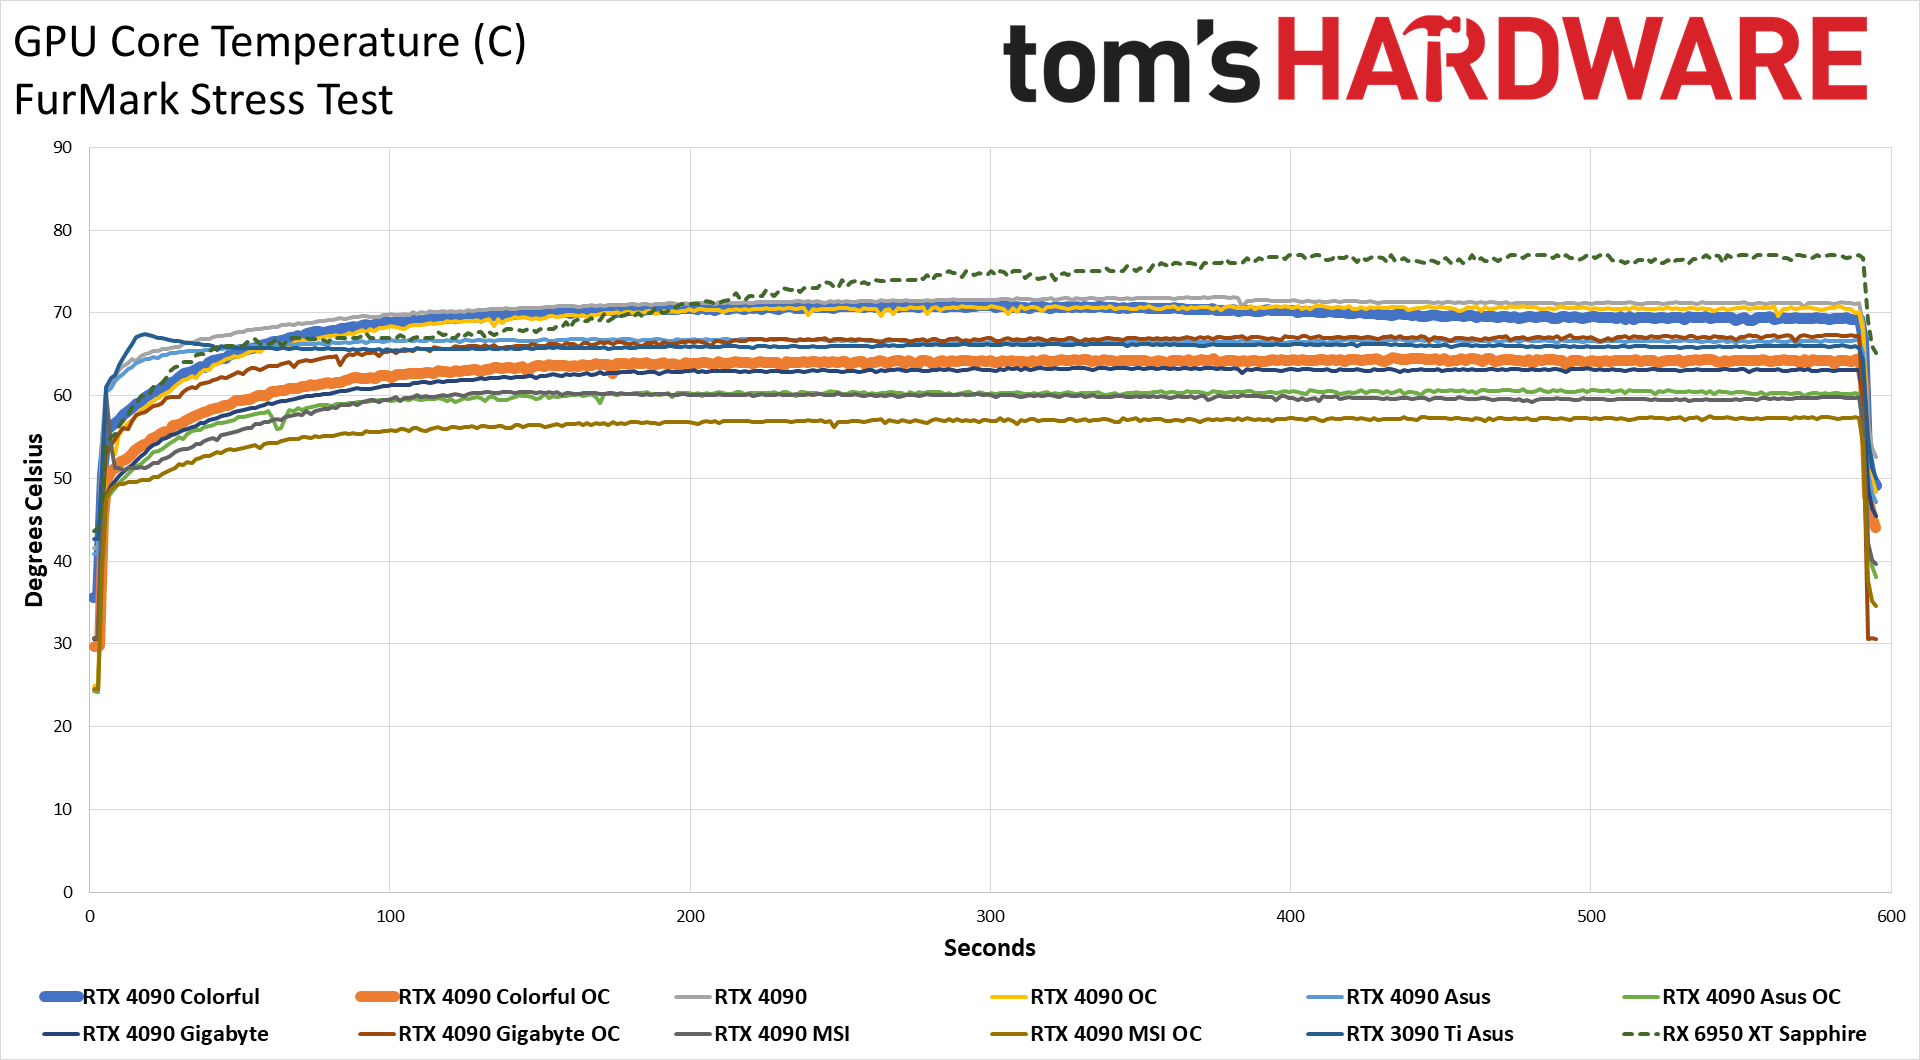
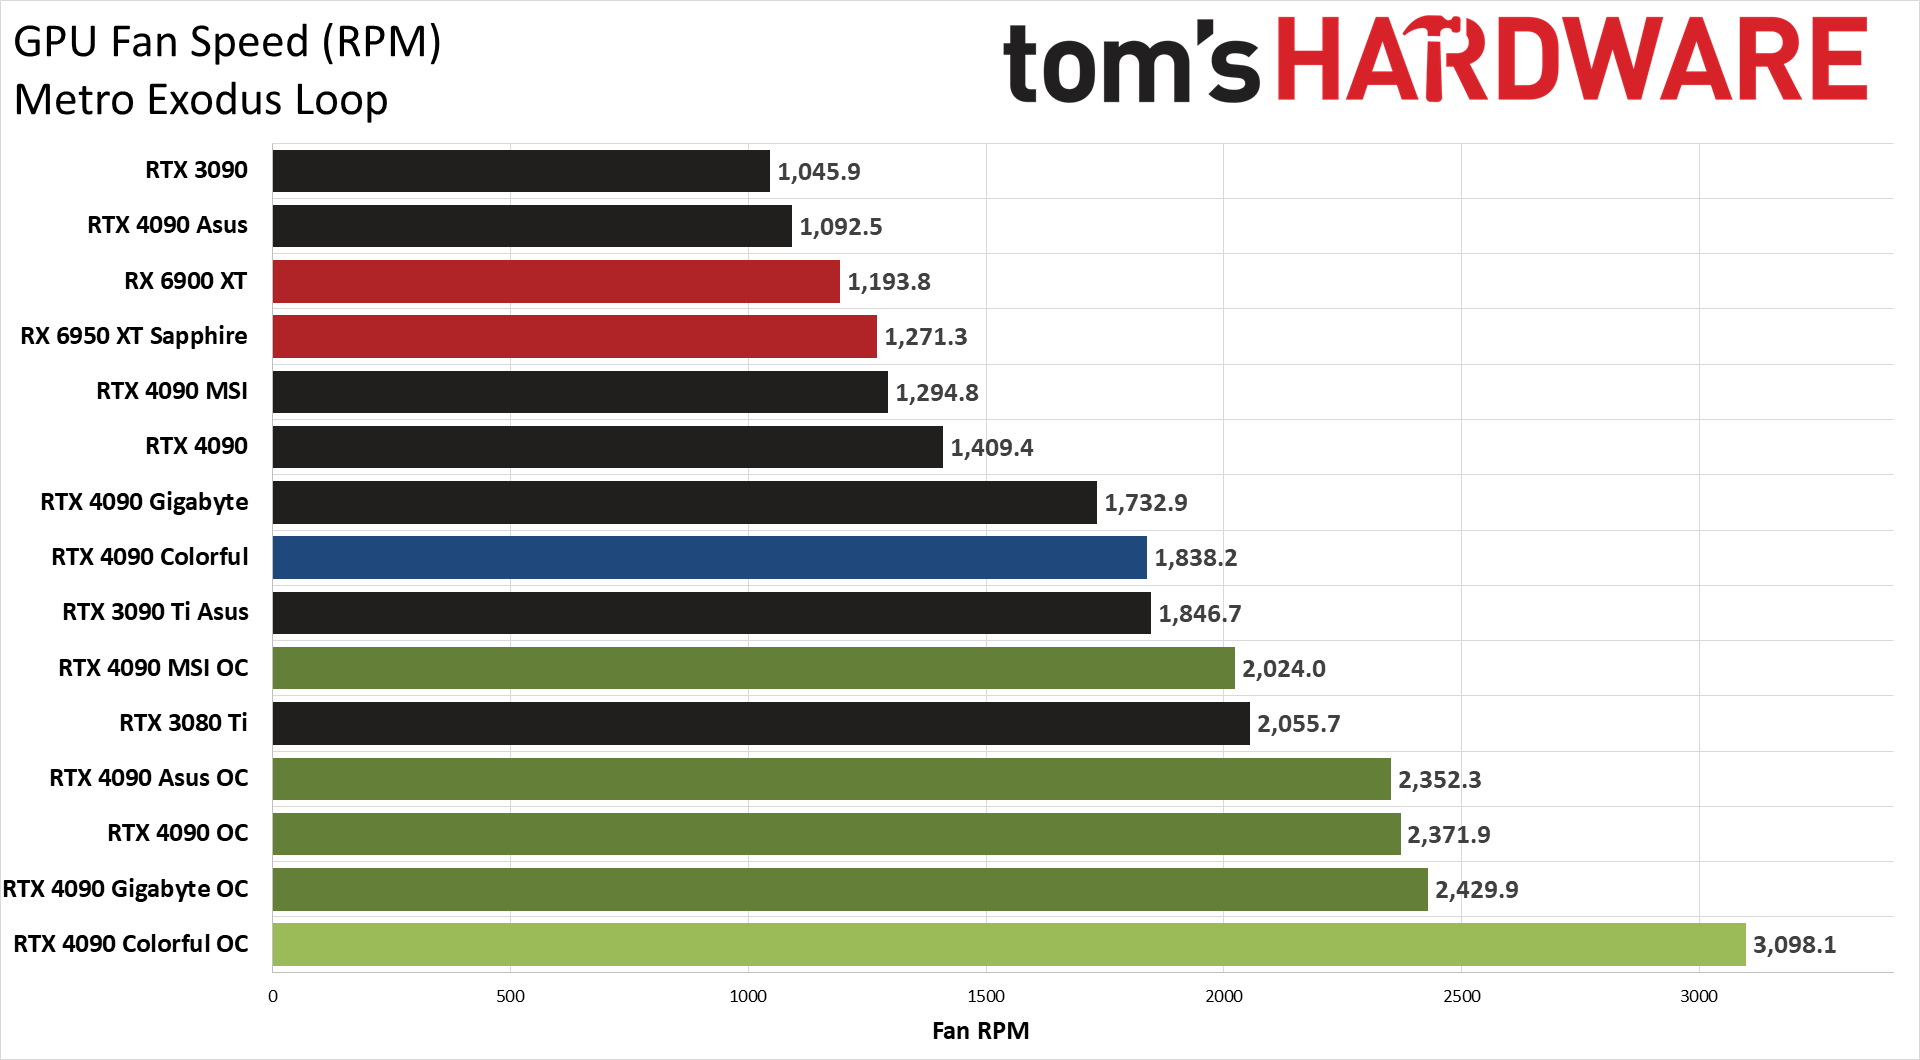
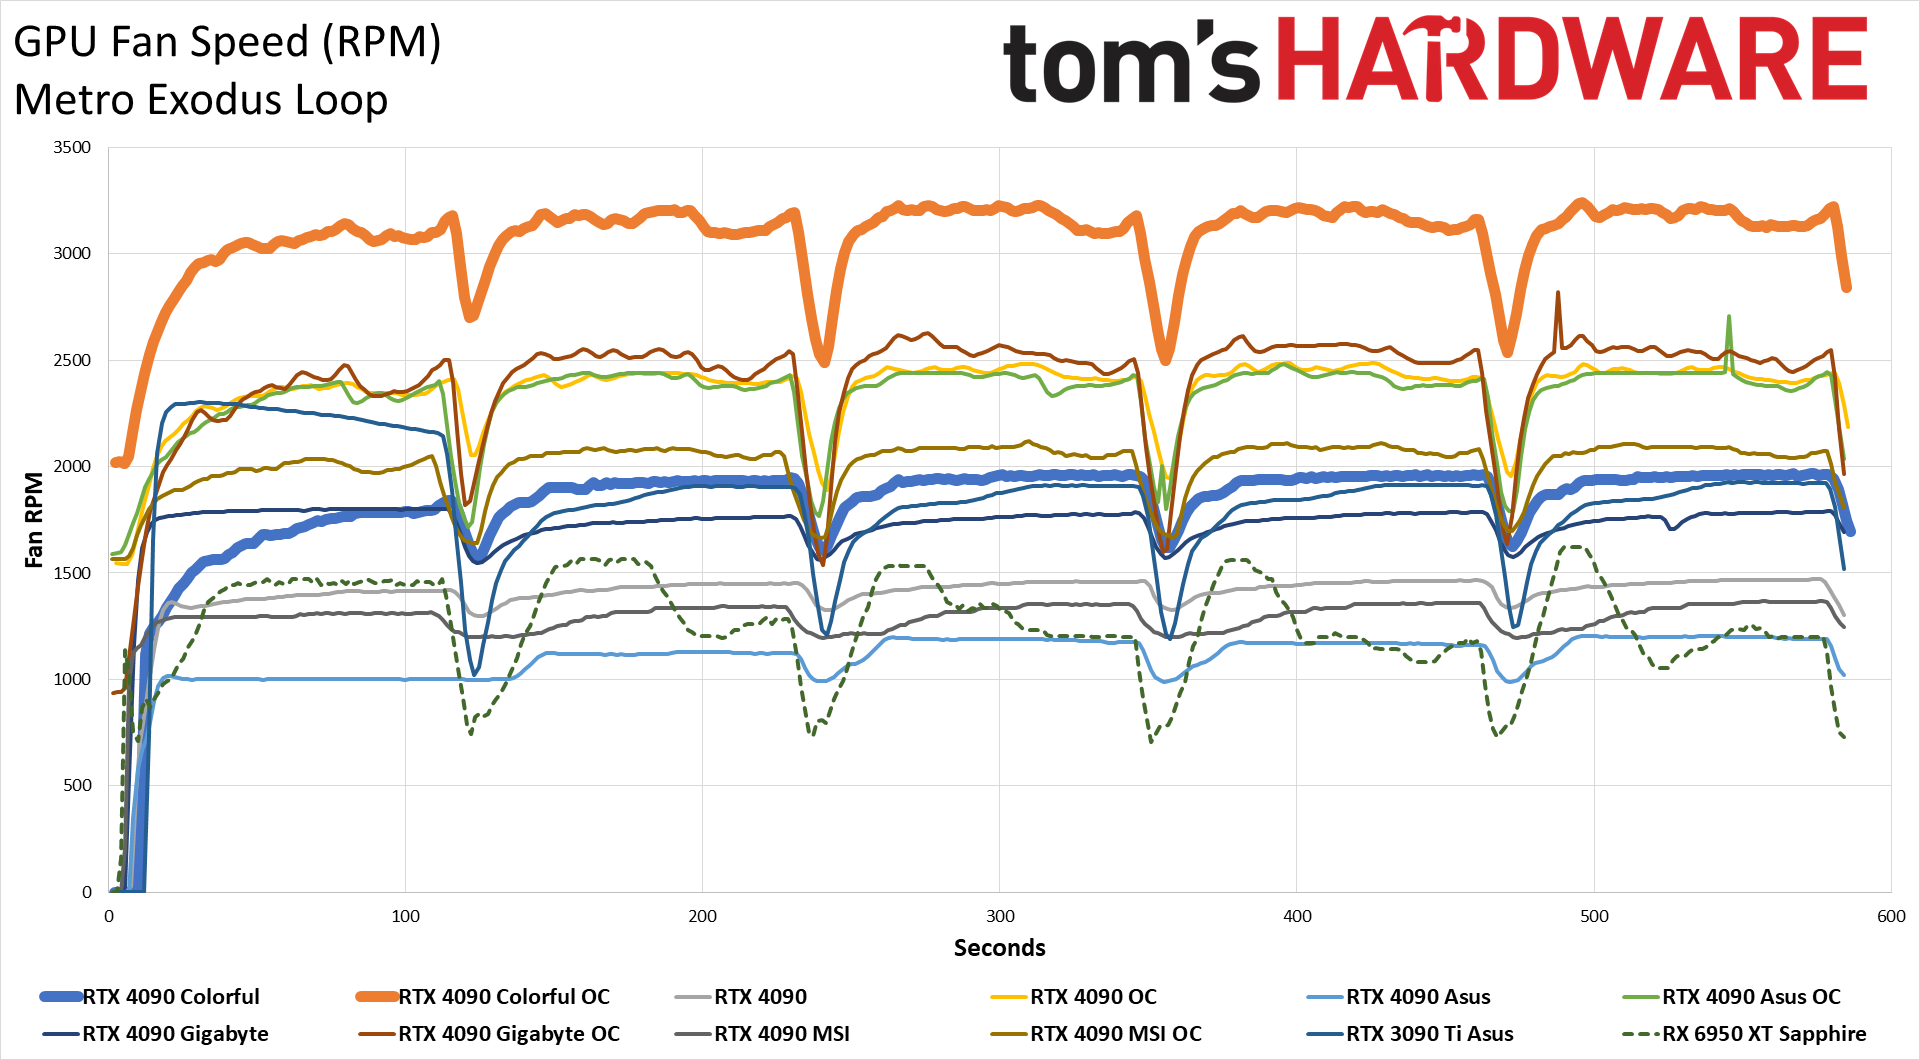
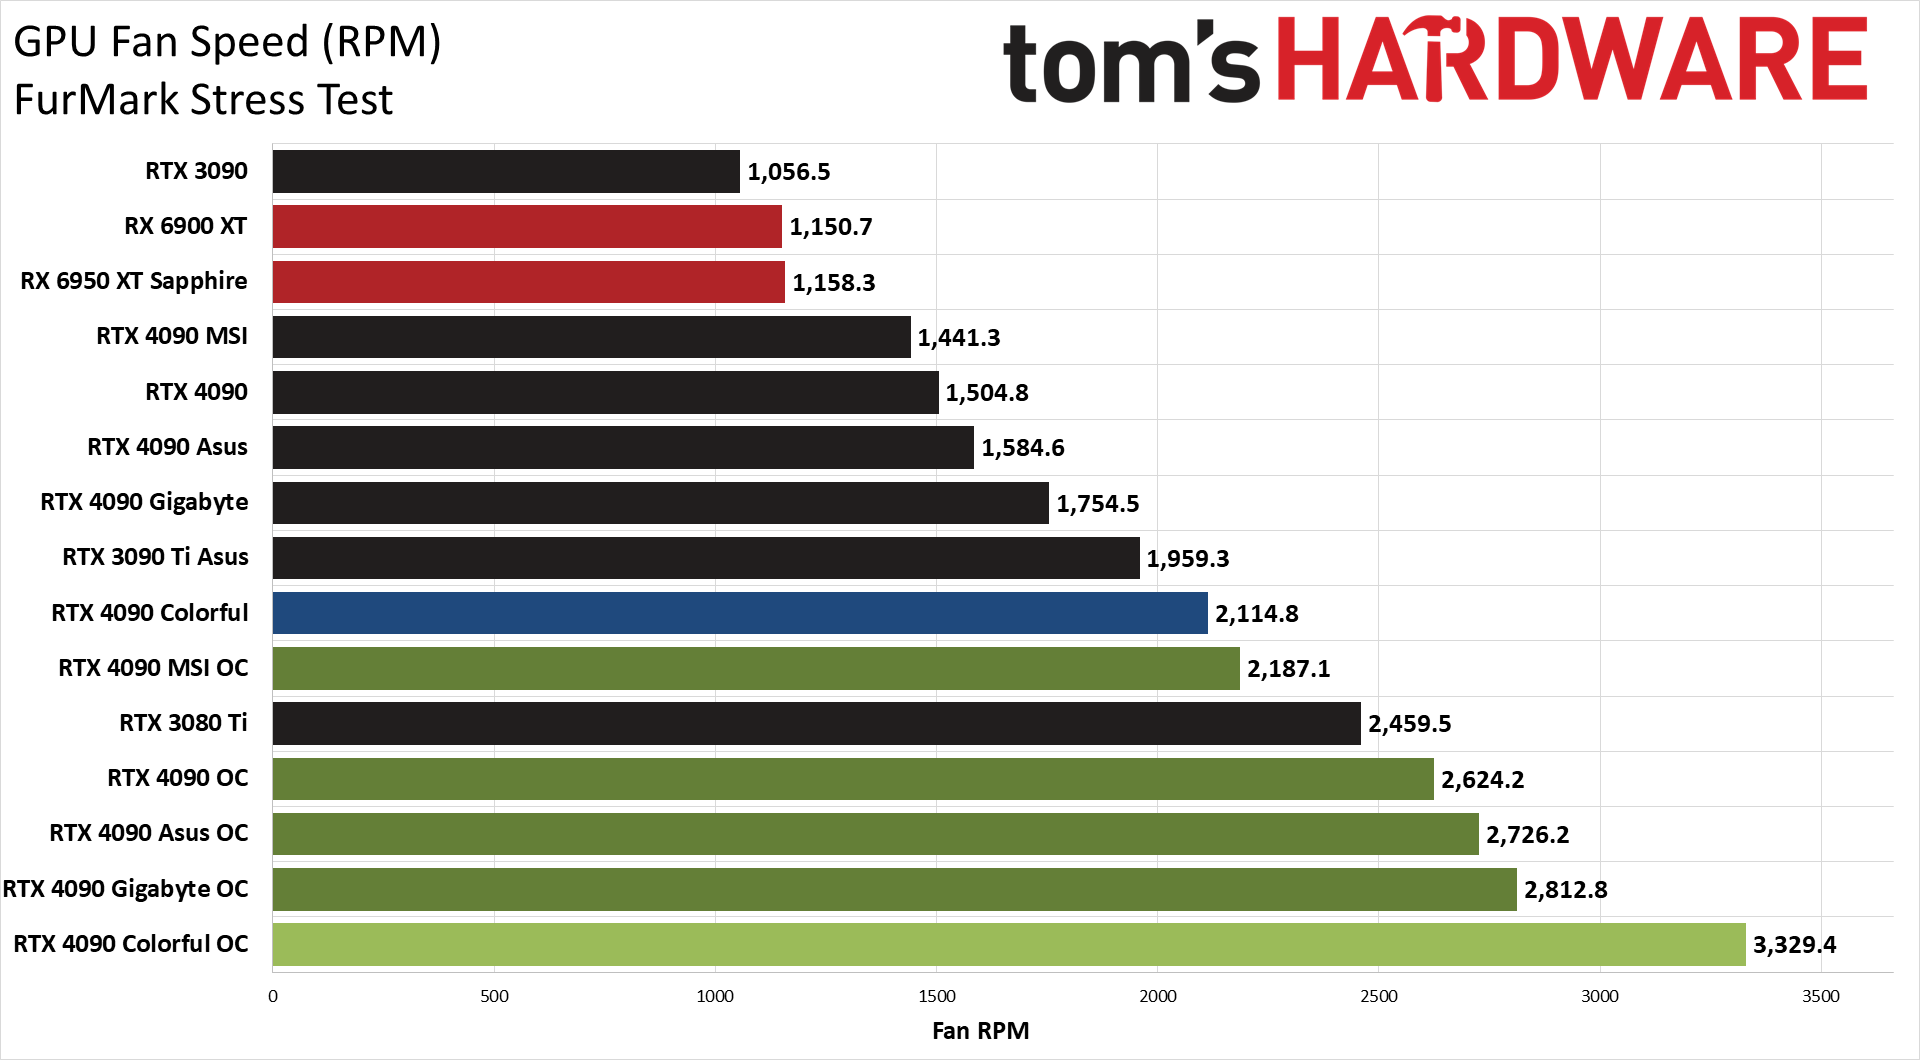
The Colorful RTX 4090 uses more power than any of the other 4090 cards, thanks to its higher 515W power limit (according to Colorful's specs sheet). We measured 463W in Metro Exodus, and 519W in FurMark, running with the card's OC button engaged.
Manual overclocking pushes the power use even higher, up to 552W in FurMark and 493W in Metro, the latter of which is the highest power draw of any of the GPUs so far in our gaming tests. You can of course disengage the OC mode (after a restart) and run at reference clocks and power limits, though we suspect most people buying an RTX 4090 factory overclocked model prefer the additional performance.
Clock speeds as usual end up tightly clustered, with the 4090 cards at stock ranging from 2727 MHz to 2791 MHz in Metro — a 2.3% spread. The spread is much wider in FurMark at 11%, where VBIOS tweaks can cause higher amounts of throttling in what is more of a worst-case scenario than a realistic graphics workload. The higher power limit on the Colorful card comes into play, allowing it to still run at 2617 MHz. Manual overclocking pushes all the cards into the 2.82–2.91 GHz range for FurMark, and 2.93–2.98 GHz for Metro.
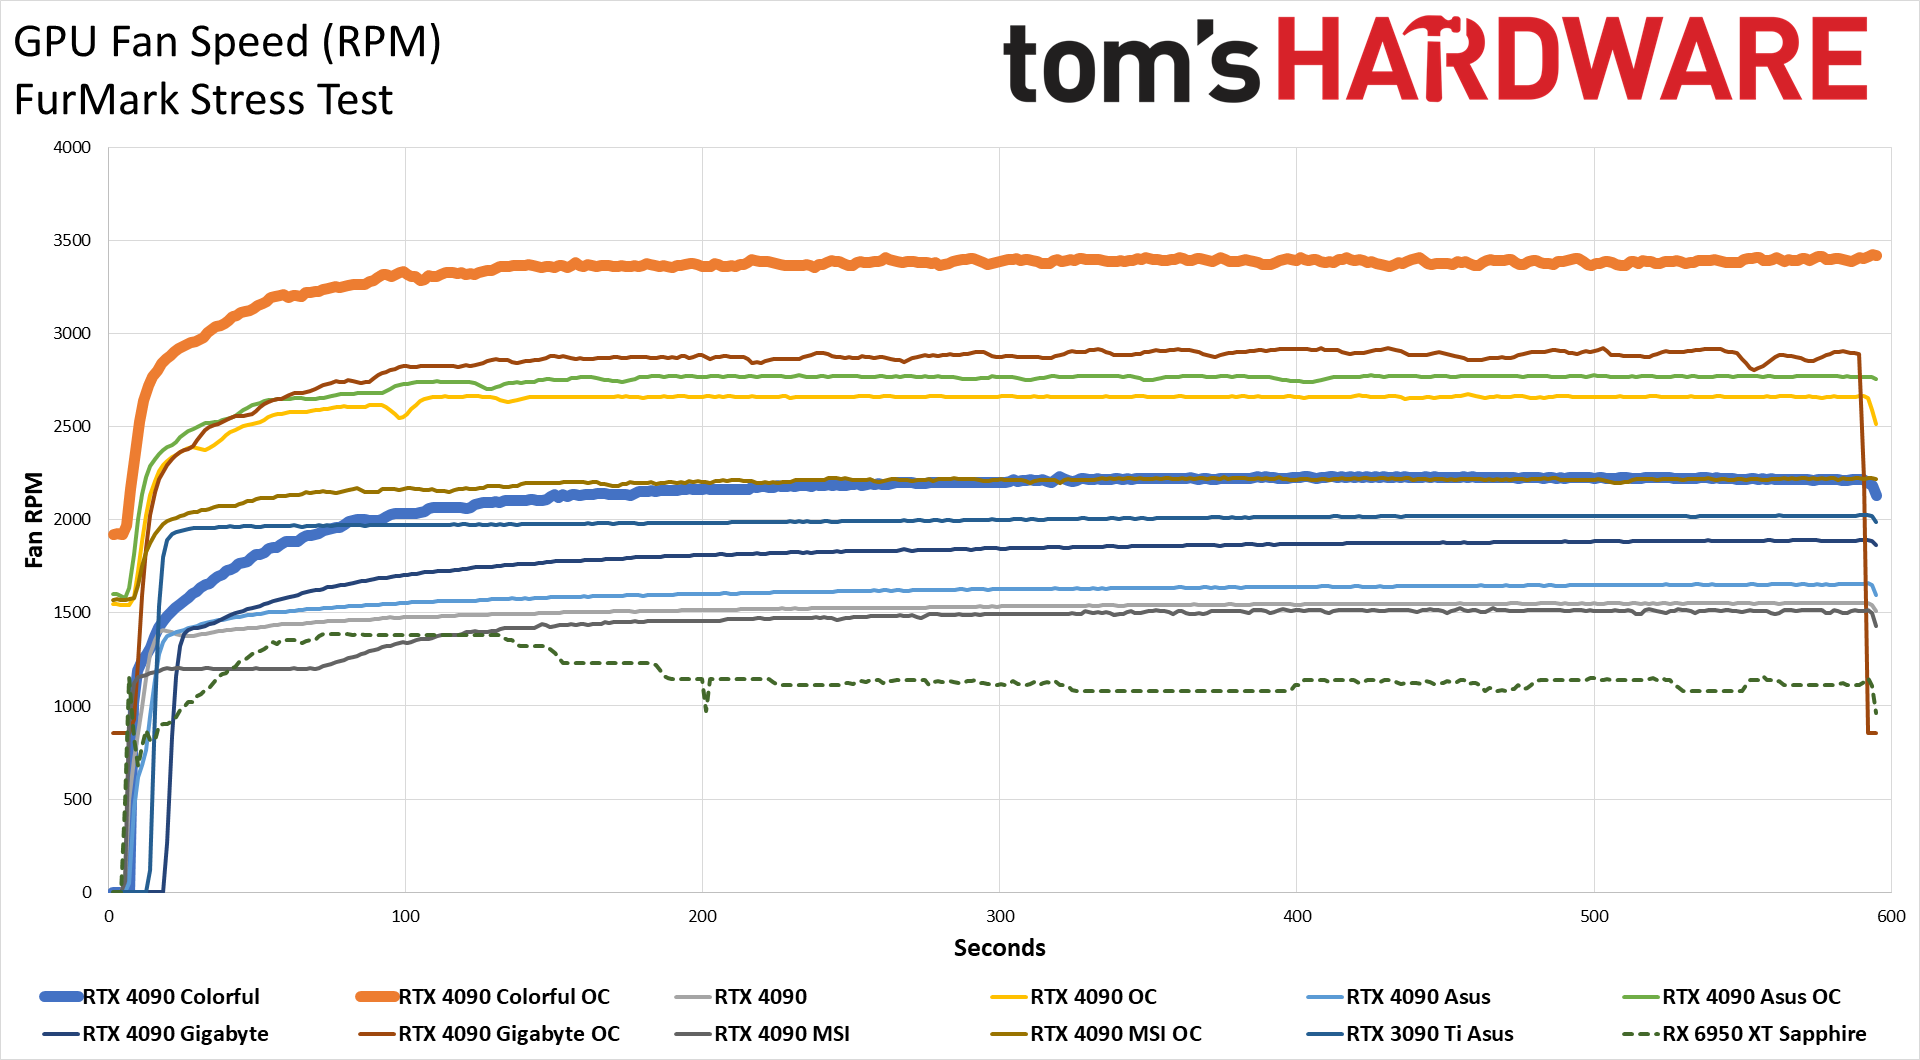
Temperatures and fan speeds generally have a direct correlation, with power use also factoring into things. The Colorful card at stock runs a bit warmer than some of the other models and only comes in slightly below the 4090 Founders Edition, but 65C while gaming and 69C in FurMark are decent results. Overclocked temperatures are actually lower than the stock temperatures, as we use a far more aggressive fan speed curve to try and keep things stable.
Speaking of fan speeds, at stock the Colorful 4090 runs the fans at over 1800 rpm in gaming, and 2100 rpm in FurMark. Those are the highest speeds of any of the tested 4090 GPUs, and manual overclocking kicks things into high gear with over 3000 rpms (though you could certainly tune the fans to run at lower speeds and likely still maintain a similar overclock). As you'd expect, that results in higher noise levels.
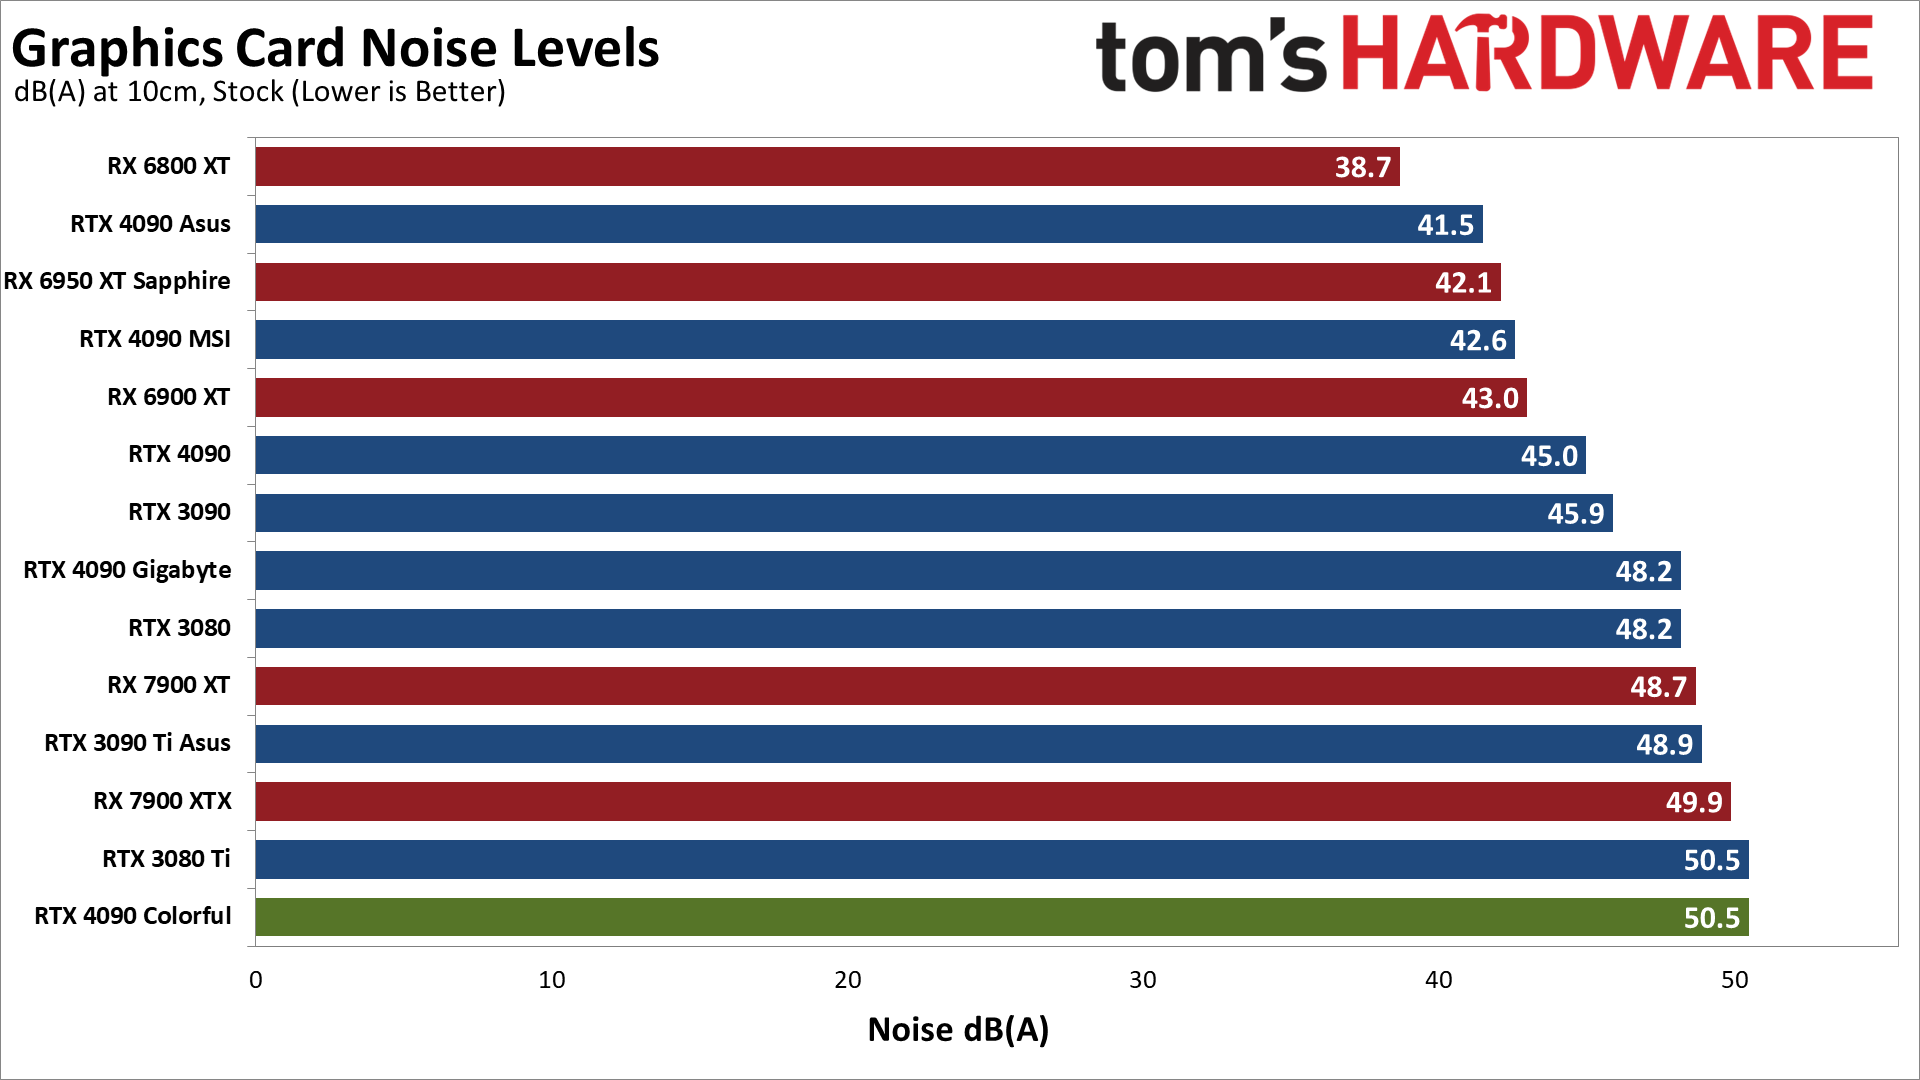
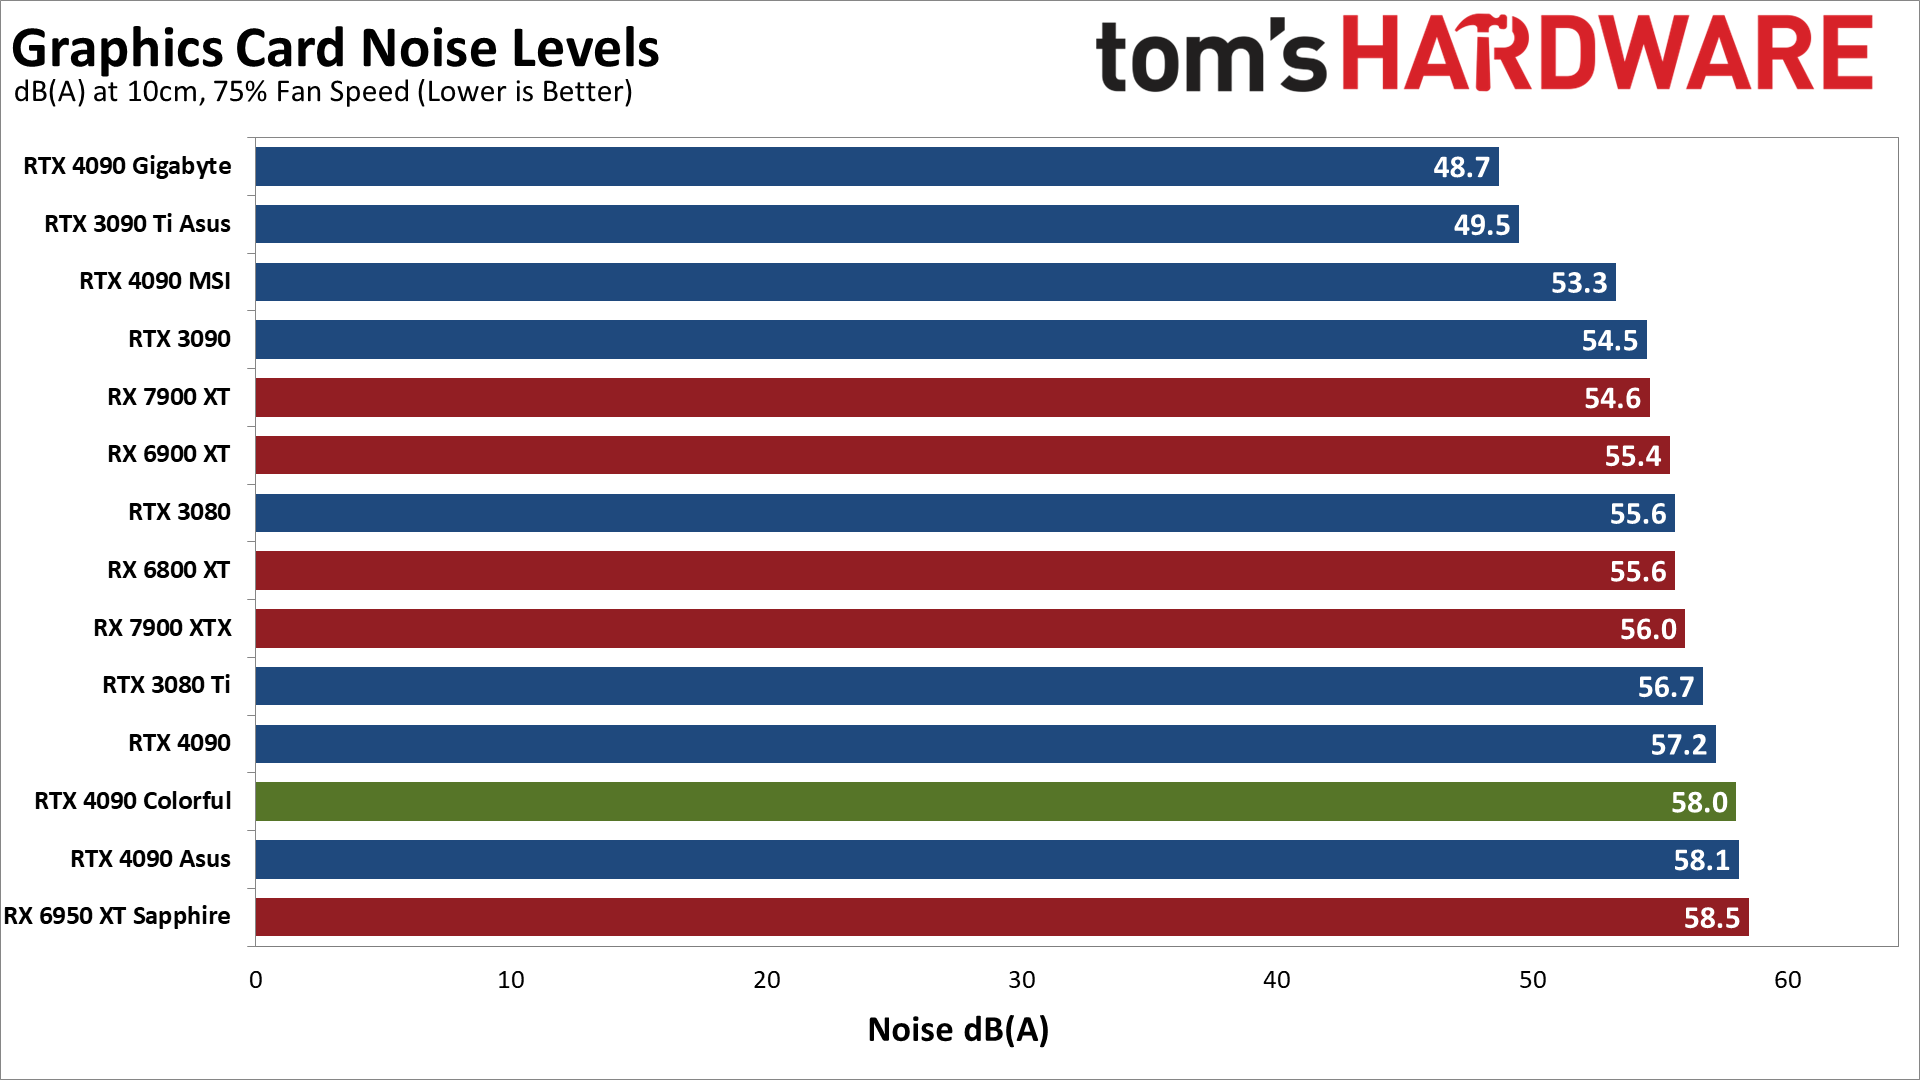
We also use an SPL (sound pressure level) meter for noise testing, positioned about 10cm away from the GPU fans. This is done to focus measurements on the graphics card fans and avoid the influence of other noise sources. Idle noise measured less than 32 dB(A) for all of the cards, which is more or less the limit of our noise floor. We run Metro Exodus for over 15 minutes to let fan speeds stabilize before taking our readings.
The Colorful 4090 card ended up at 50.5 dB(A), matching the reference RTX 3080 Ti and rating as one of the noisier cards in our charts. That's… not a great showing. Everything about the card seems like it should do better than this, though perhaps part of the problem is the higher power draw in our tested OC mode. The fans ran at 55%, so there's still some room in the tank for even higher speeds, more cooling … and higher noise levels.
We also set a static fan speed of 75%, but that on its own isn't super meaningful. Some cards have fans that can reach higher speeds and thus create more noise. The Colorful card at 75% hit 58 dB(A), basically matching the Asus 4090 — but the Asus card only needed to run its fans at 41% at stock.
| Game | Setting | Avg FPS | Avg Clock | Avg Power | Avg Temp | Avg Utilization |
|---|---|---|---|---|---|---|
| 13-Game Geomean | 1440p 'Ultra' | 126.9 | 2757 | 345 | 56.9 | 83% |
| 13-Game Geomean | 4k 'Ultra' | 83.7 | 2738 | 399 | 59.6 | 93% |
| 6-Game DXR Geomean | 1440p 'Ultra' | 104.3 | 2752 | 401 | 59.8 | 90% |
| 6-Game DXR Geomean | 4k 'Ultra' | 55.5 | 2715 | 431 | 62 | 95% |
| 6-Game DXR Geomean OC | 4k 'Ultra' | 59.4 | 2934 | 496 | 61.7 | 94% |
| Borderlands 3 | 1440p Badass | 217.4 | 2760 | 413 | 61.5 | 93% |
| Borderlands 3 | 4k Badass | 126.3 | 2741 | 442 | 63.4 | 99% |
| Bright Memory Infinite | 1440p Very High | 85.9 | 2759 | 422 | 62.3 | 99% |
| Bright Memory Infinite | 4k Very High | 40.4 | 2730 | 436 | 63.5 | 99% |
| Bright Memory Infinite OC | 4k Very High | 43.6 | 2940 | 496 | 61.8 | 99% |
| Control | 1440p High | 135.9 | 2759 | 437 | 58.4 | 99% |
| Control | 4k High | 67.6 | 2718 | 445 | 61.3 | 99% |
| Control OC | 4k High | 73 | 2940 | 507 | 58 | 99% |
| Cyberpunk 2077 | 1440p RT-Ultra | 85.2 | 2759 | 408 | 59.2 | 96% |
| Cyberpunk 2077 | 4k RT-Ultra | 43.9 | 2707 | 436 | 60.9 | 97% |
| Cyberpunk 2077 OC | 4k RT-Ultra | 46 | 2940 | 505 | 61.9 | 97% |
| Far Cry 6 | 1440p Ultra | 151.7 | 2760 | 233 | 51.1 | 66% |
| Far Cry 6 | 4k Ultra | 132.4 | 2760 | 335 | 54.2 | 94% |
| Flight Simulator | 1440p Ultra | 76.9 | 2760 | 354 | 57.2 | 71% |
| Flight Simulator | 4k Ultra | 76.3 | 2760 | 347 | 55.2 | 71% |
| Fortnite | 1440p Epic | 104 | 2745 | 385 | 60.9 | 94% |
| Fortnite | 4k Epic | 53 | 2735 | 415 | 62.2 | 96% |
| Fortnite OC | 4k Epic | 57.5 | 2925 | 481 | 63.8 | 95% |
| Forza Horizon 5 | 1440p Extreme | 172.6 | 2770 | 251 | 50.2 | 83% |
| Forza Horizon 5 | 4k Extreme | 148.7 | 2760 | 315 | 55.5 | 93% |
| Horizon Zero Dawn | 1440p Ultimate | 179.1 | 2761 | 257 | 51.9 | 66% |
| Horizon Zero Dawn | 4k Ultimate | 153.9 | 2758 | 382 | 58.5 | 95% |
| Metro Exodus Enhanced | 1440p Extreme | 116 | 2729 | 419 | 61.4 | 93% |
| Metro Exodus Enhanced | 4k Extreme | 74.1 | 2652 | 445 | 63 | 99% |
| Metro Exodus Enhanced OC | 4k Extreme | 79.7 | 2922 | 543 | 65.7 | 98% |
| Minecraft | 1440p RT 24-Blocks | 107.5 | 2760 | 343 | 56.8 | 66% |
| Minecraft | 4k RT 24-Blocks | 62.1 | 2749 | 414 | 61.2 | 80% |
| Minecraft OC | 4k RT 24-Blocks | 65.6 | 2940 | 451 | 59.1 | 79% |
| Total War Warhammer 3 | 1440p Ultra | 166.5 | 2760 | 396 | 59.8 | 94% |
| Total War Warhammer 3 | 4k Ultra | 103.7 | 2760 | 425 | 61.1 | 98% |
| Watch Dogs Legion | 1440p Ultra | 131.1 | 2763 | 275 | 50.8 | 72% |
| Watch Dogs Legion | 4k Ultra | 112.6 | 2760 | 389 | 55.4 | 97% |
As noted above, we also collected temperature, power, and clock speed data via Nvidia FrameView for most of our benchmarks — "most" because the older version of FrameView caused Red Dead Redemption 2 Vulkan to crash to desktop. These are the results from the test runs used in our charts.
For the full suite of 13 games, the Colorful 4090 card averaged about 2.76 GHz at 1440p and 2.74 GHz at 4K, with an average GPU of 83% at 1440p and 93% at 4K. Those results are nearly identical to the Gigabyte card, even though the Colorful ended up slightly faster and with a higher power draw.
The power data shows that an underutilized GPU typically results in lower power draw, and few of the games we tested come anywhere near the nominal 515W TBP limit of the Colorful 4090 card. Metro Exodus Enhanced ends up as the most demanding of the games we tested, with 445W using the factory OC mode and 543W when overclocked. That's nearly 100W more power (a 22% increase), for just 7.5% more performance.
- MORE: Best Graphics Cards
- MORE: GPU Benchmarks and Hierarchy
- MORE: All Graphics Content
Get Tom's Hardware's best news and in-depth reviews, straight to your inbox.
Current page: Colorful RTX 4090 Vulcan OC: Power, Temps, Noise, Etc.
Prev Page Colorful RTX 4090 Vulcan OC: Gaming Performance Next Page Colorful RTX 4090 Vulcan OC: Lots of Extras but a bit Noisy
Jarred Walton is a senior editor at Tom's Hardware focusing on everything GPU. He has been working as a tech journalist since 2004, writing for AnandTech, Maximum PC, and PC Gamer. From the first S3 Virge '3D decelerators' to today's GPUs, Jarred keeps up with all the latest graphics trends and is the one to ask about game performance.
-
OldWalter____IsMyDog You folks should do an article on how to buy Colorful products in the US - it seems super confusing and risky! Colorful makes some nice stuff, and the iGame Neptune OC 4090 is cool too, but for folks in the US (and Europe?) a review on a card like this is about as relevant as reading a review on a Chinese domestic market car when you're car shopping.Reply -
Vanderlindemedia In all the tests, none of the recent released 7900XTX / series of AMD are included, except for the noise test. There you'll see the 7900XTX in those graphs. Why is that? Now it looks like Nvidia is twice as fast as the whole AMD generation?Reply -
JarredWaltonGPU Reply
Page 3:Vanderlindemedia said:In all the tests, none of the recent released 7900XTX / series of AMD are included, except for the noise test. There you'll see the 7900XTX in those graphs. Why is that? Now it looks like Nvidia is twice as fast as the whole AMD generation?
"Please note that testing of the Colorful card was conducted on our standard test bed, a few weeks ago (around the time the RTX 4080 launch took over my free time). This is the same as the other 4090 cards, and not the new and improved test bed we used in the RX 7900 XTX / XT review. This was also before Fortnite broke our benchmarks and changed its settings, and the same for Forza Horizon 5 and Total War: Warhammer 3."
It's a third-party AIB card, and our standard is to mostly compare it to the reference card with the same GPU as well as any other AIB cards using the same GPU. The other cards are just there for reference.
So why does noise have the 7900 series? Well, first because I apparently forgot to not include them and used an updated spreadsheet that had those results. Oops. But also because the noise (and power) testing hasn't changed with drivers and such. I don't have truly "comparable" results from 12900K testing for the new AMD cards in a couple of games, or alternatively I don't have comparable data from all the other 4090 cards if I were to swap testbeds and retest.
But all of that misses the point that I'm really just evaluating the Colorful 4090 against the other 4090 cards. It's better in some cases (though the VRAM is likely just luck of the draw), but worse on noise levels. If you don't want a quieter 4090 card, and you can find it in stock, it's not a bad option.
