Enermax Platimax D.F. 1200W PSU Review
Why you can trust Tom's Hardware
Cross-Load Tests & Infrared Images
Our cross-load tests are described in detail here.
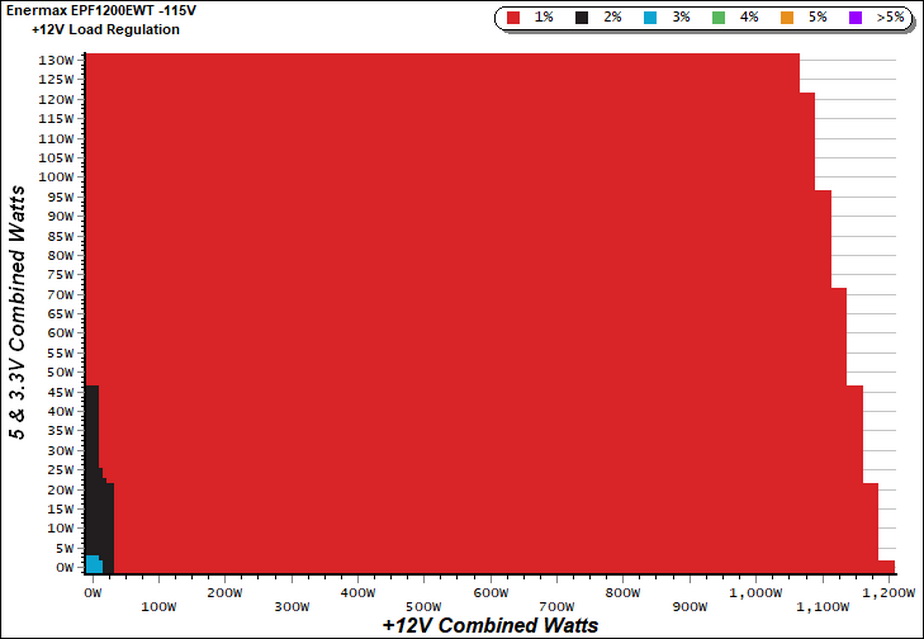
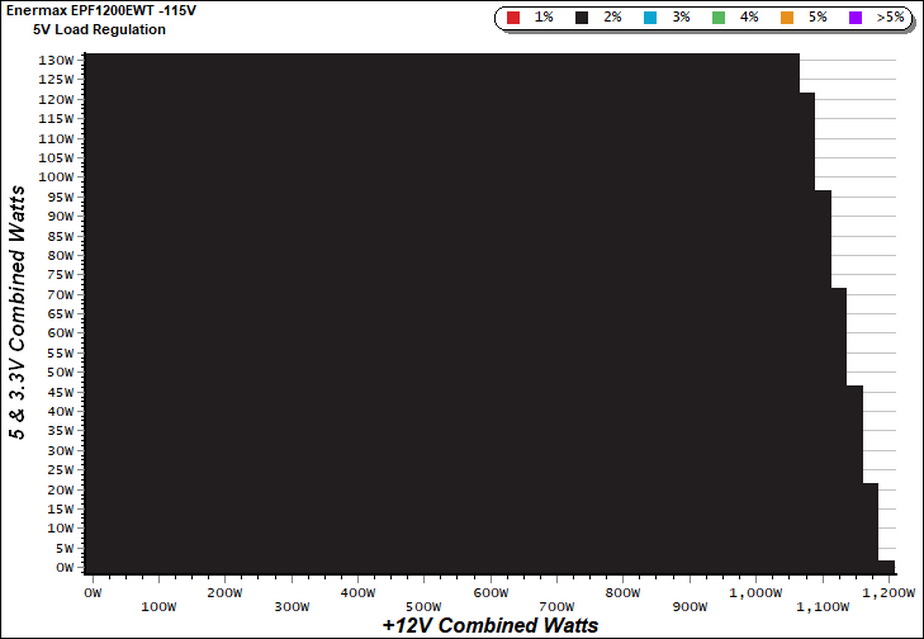
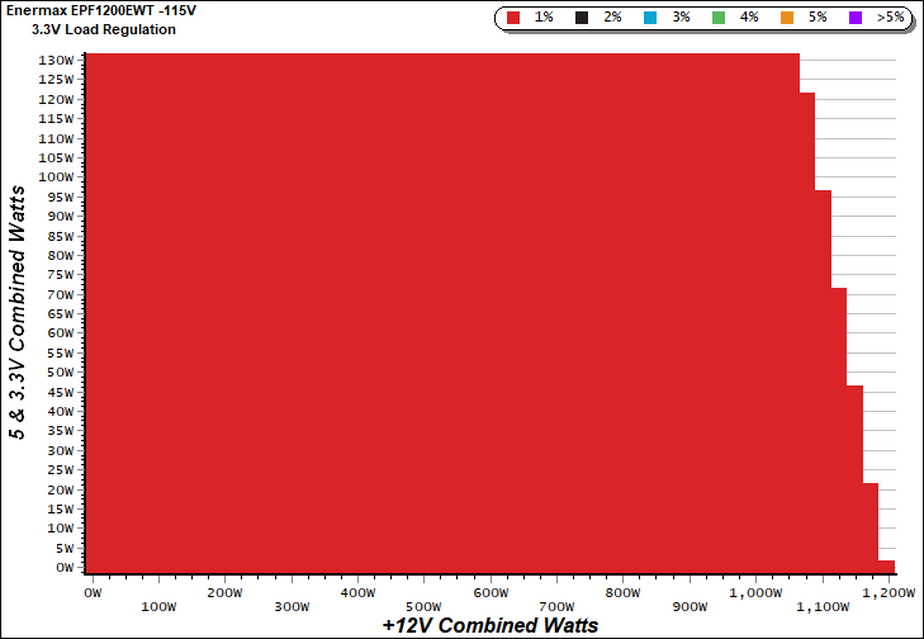
To generate the following charts, we set our loaders to auto mode through our custom-made software before trying more than 25,000 possible load combinations with the +12V, 5V, and 3.3V rails. The load regulation deviations in each of the charts below were calculated by taking the nominal values of the rails (12V, 5V, and 3.3V) as point zero. The ambient temperature was between at 30°C (86°F) to 32°C (89.6°F).
Load Regulation Charts
Efficiency Chart
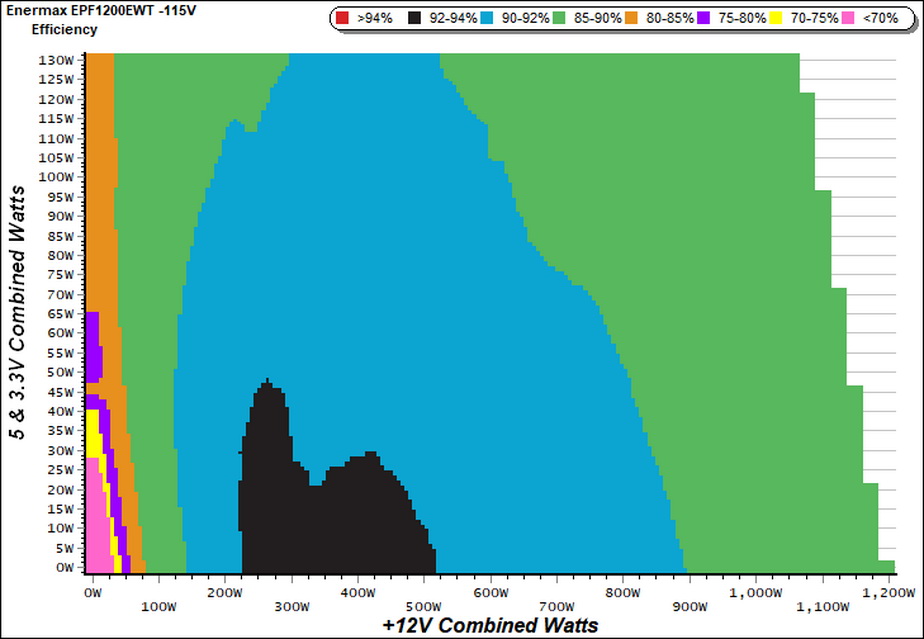
The highest efficiency region is between 210W and 510W at +12V, with load on the minor rails staying low. After all, modern PCs don't draw much power from the 5V and 3.3V rails.
Ripple Charts
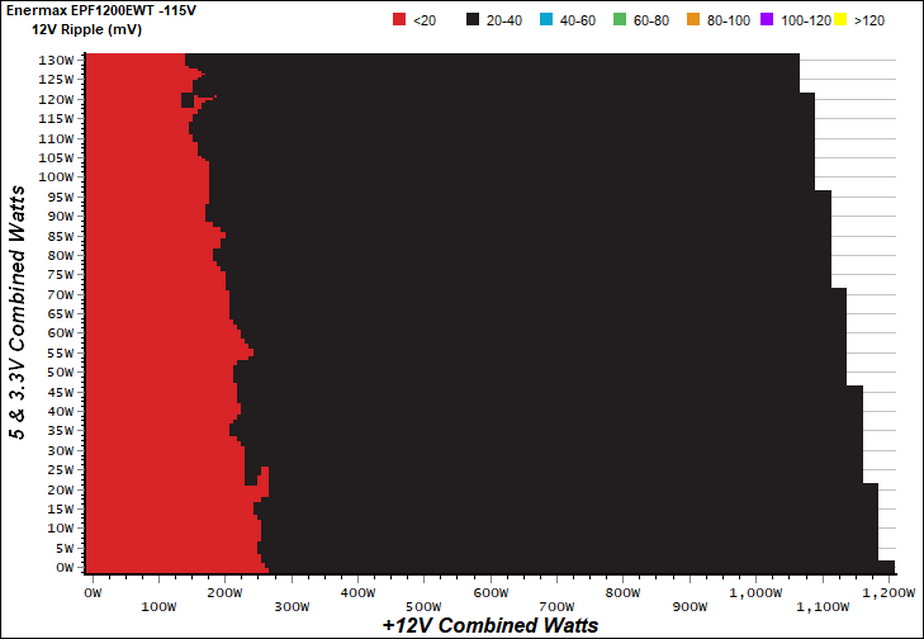
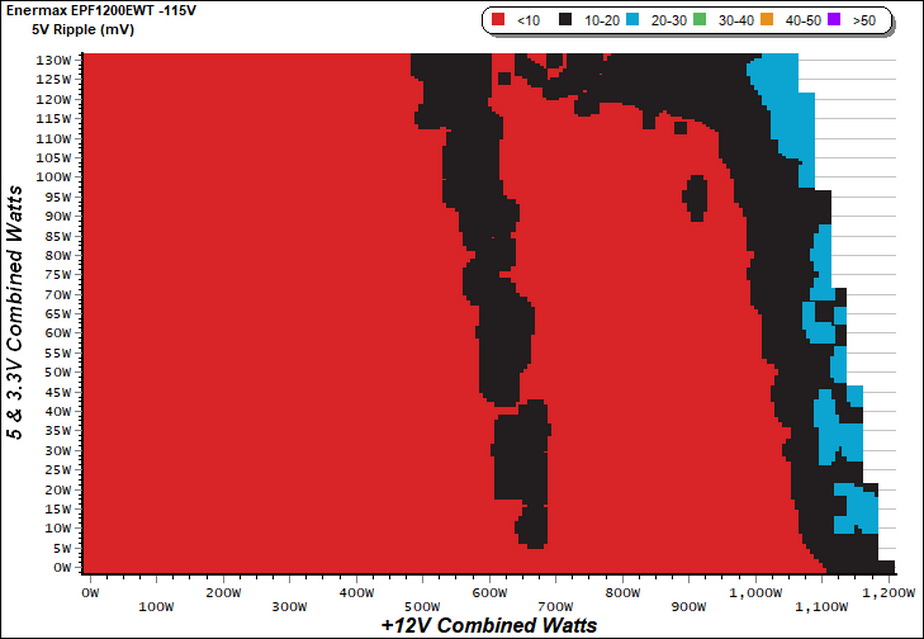
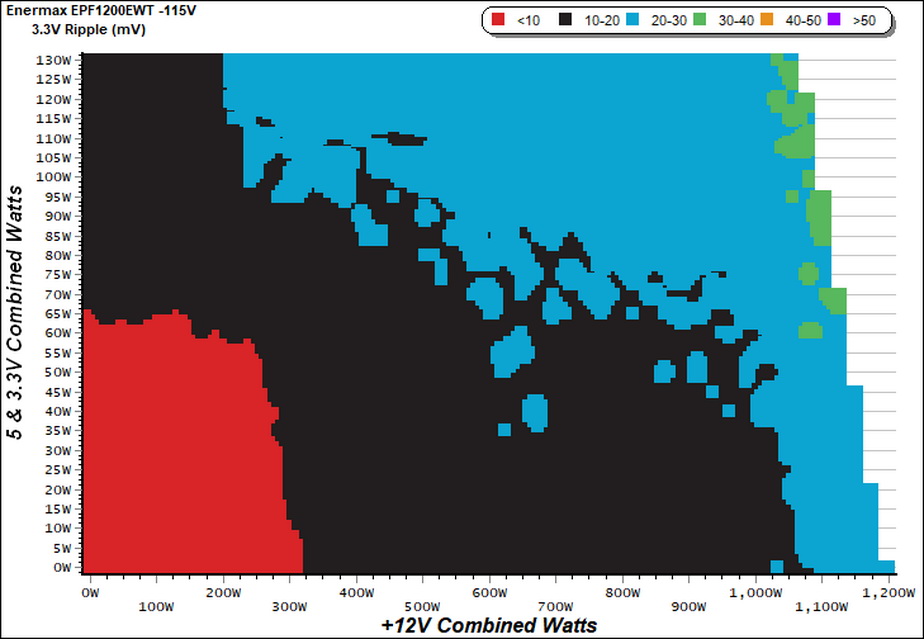
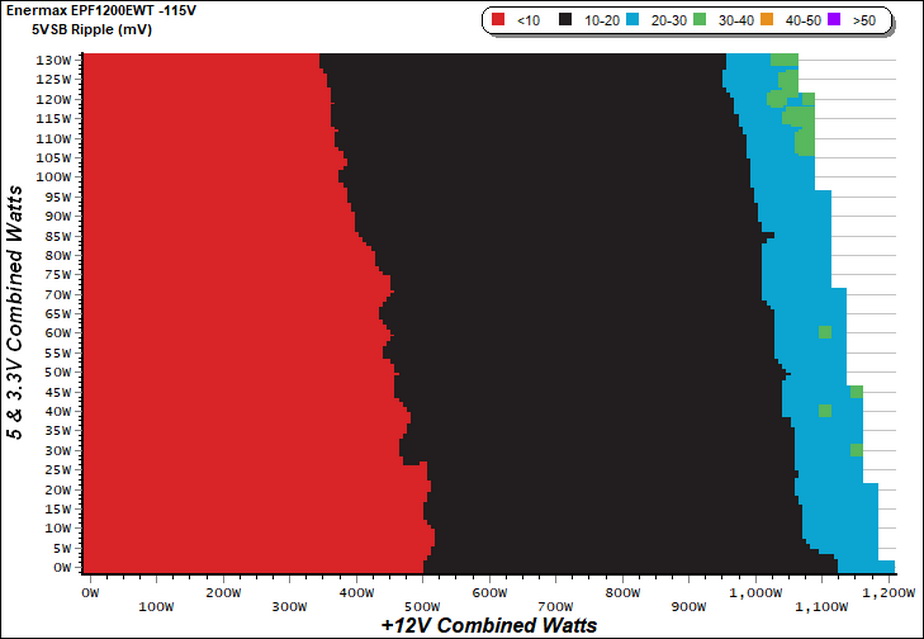
Infrared Images
We applied half-load for 10 minutes with the PSU's top cover and fan removed before taking photos with our modified FLIR E4 camera that delivers 320x240 IR resolution (76,800 pixels).
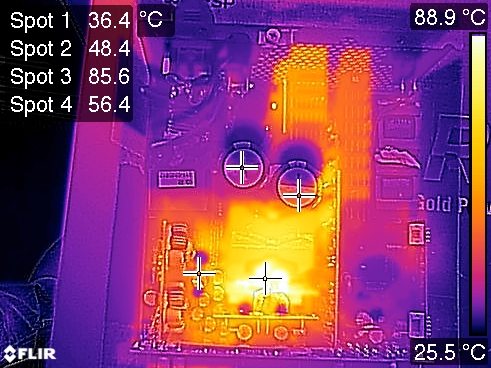
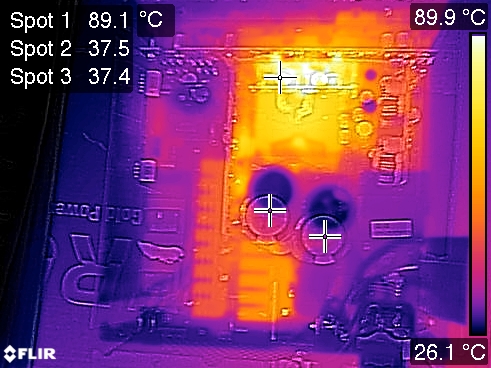
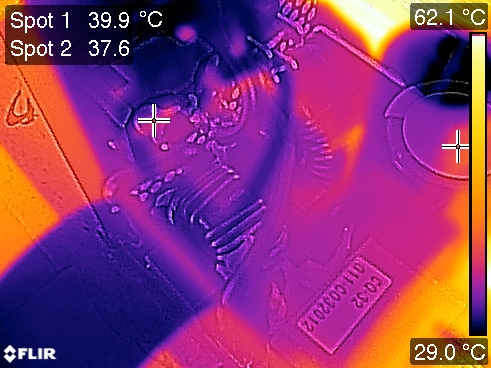
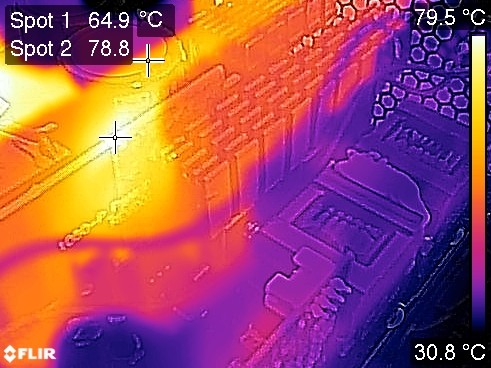
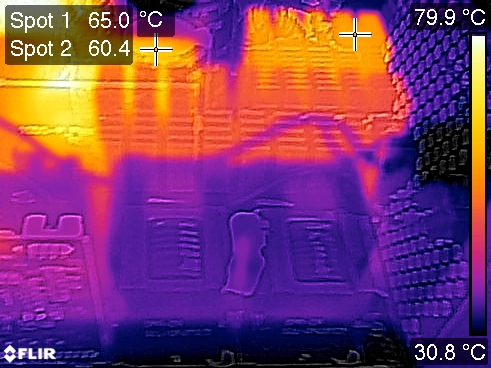
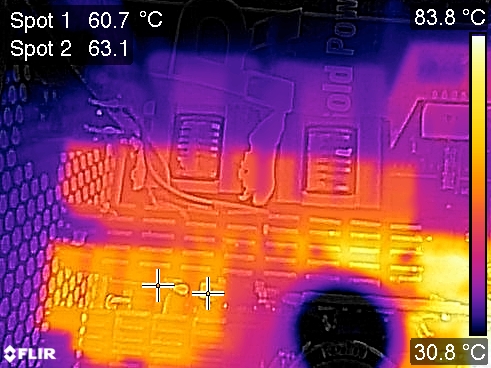
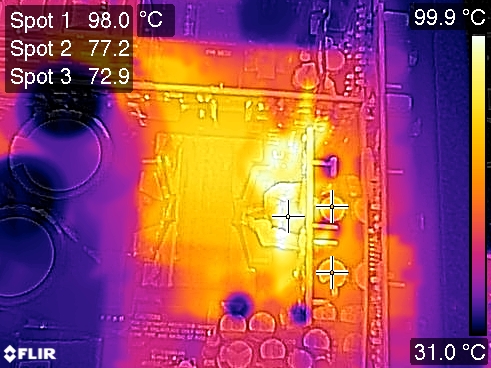
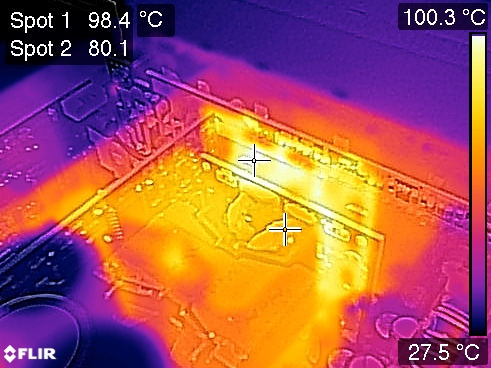
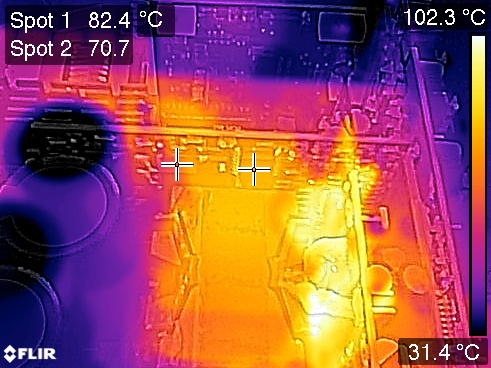
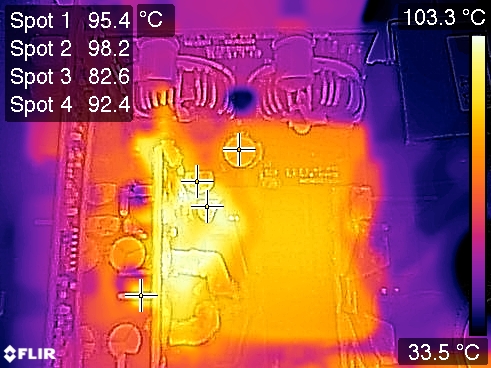
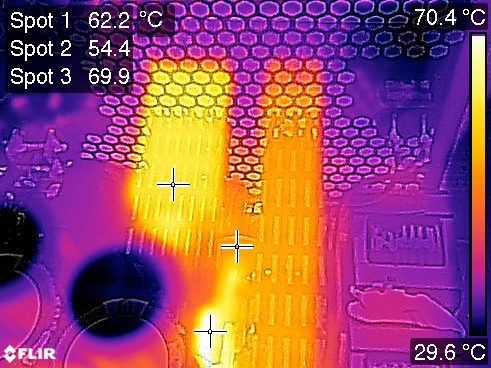
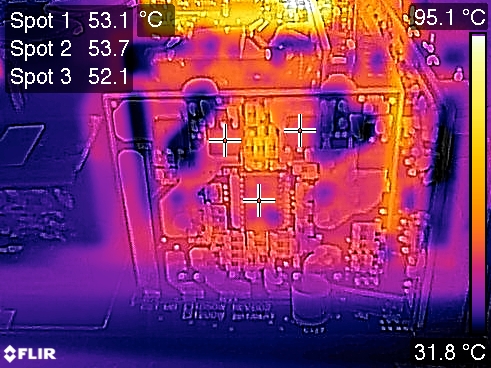
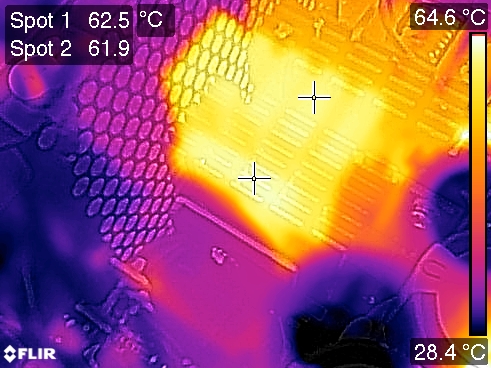
Temperatures inside the PSU are elevated, since only the bridge rectifiers and APFC converter use heat sinks. The rest of the components, including all FETs, are mostly cooled by bus bars and the boards onto which they are installed.
We also notice high temperatures from the solid and polymer caps surrounding the +12V board. What worries us most are the heated-up electrolytic caps, since those are the ones prone to failure under tough conditions.
MORE: Best Power Supplies
Get Tom's Hardware's best news and in-depth reviews, straight to your inbox.
MORE: How We Test Power Supplies
MORE: All Power Supply Content
Current page: Cross-Load Tests & Infrared Images
Prev Page Protection Features Next Page Transient Response Tests
Aris Mpitziopoulos is a contributing editor at Tom's Hardware, covering PSUs.
-
Soaptrail The DFR would not be that bad at adding dust to the case if it does it each time you start your PC. If DFR kicks in each time you resume from sleep i do not expect to see dust all over the case but if DFR is only activated once or twice a year then yes you will be adding dust to the case assuming it actually detaches from the PSU.Reply -
love4earthwk I'm afraid Teardown video is about thermaltake grand rgb.Reply
Enermax platimax df 1200w video is uploaded in Aris's youtube channel
https://www.youtube.com/watch?v=UYHaJDsd9QI -
Aris_Mp Yes there is a problem with the video. We are working on it! I am sorry for the confusion!Reply -
bettsar I prefer to read the teardown analysis. I usually find that to be the most interesting part of the power supply reviews. Thanks for the high quality work that you do in putting these together.Reply
