EVGA BQ Series 850W PSU Review
One of EVGA's most affordable power supply families, the BQ, includes five unique models. The higher-capacity ones are made by HEC and the rest come from Andyson. Today we're testing the flagship 850 BQ.
Why you can trust Tom's Hardware
Cross-Load Tests And Infrared Images
Our cross-load tests are described in detail here.
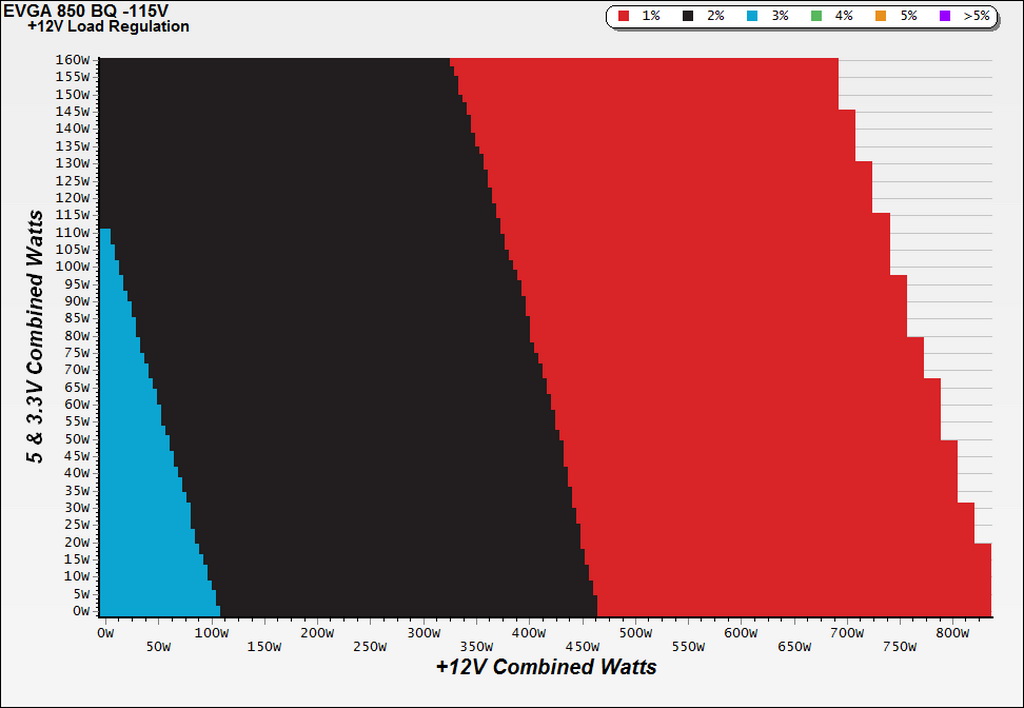
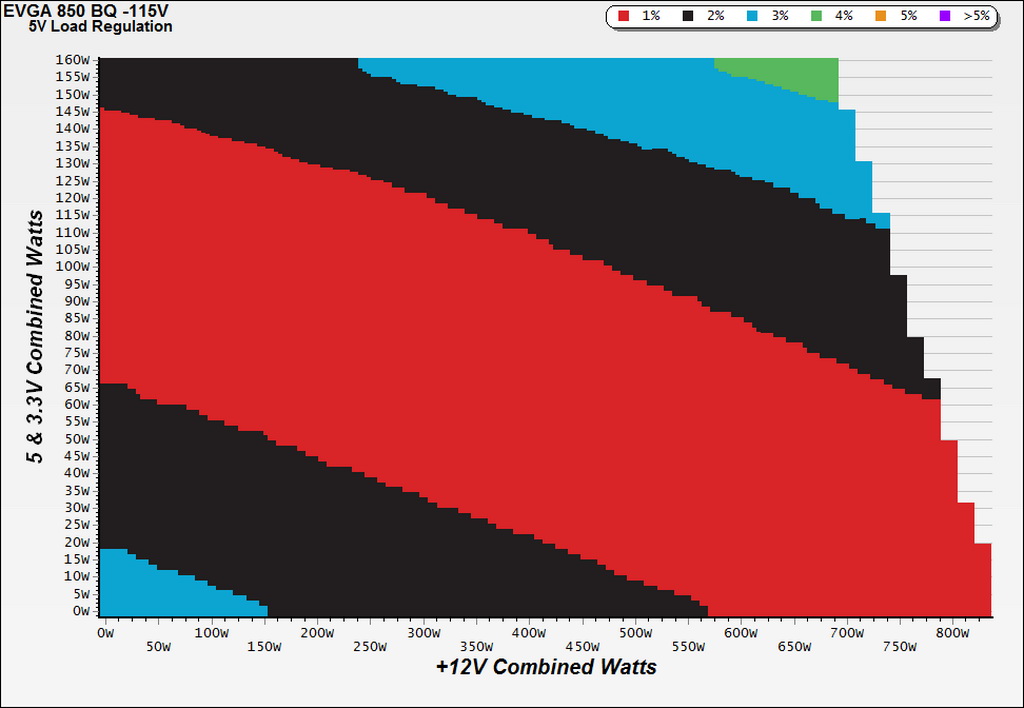
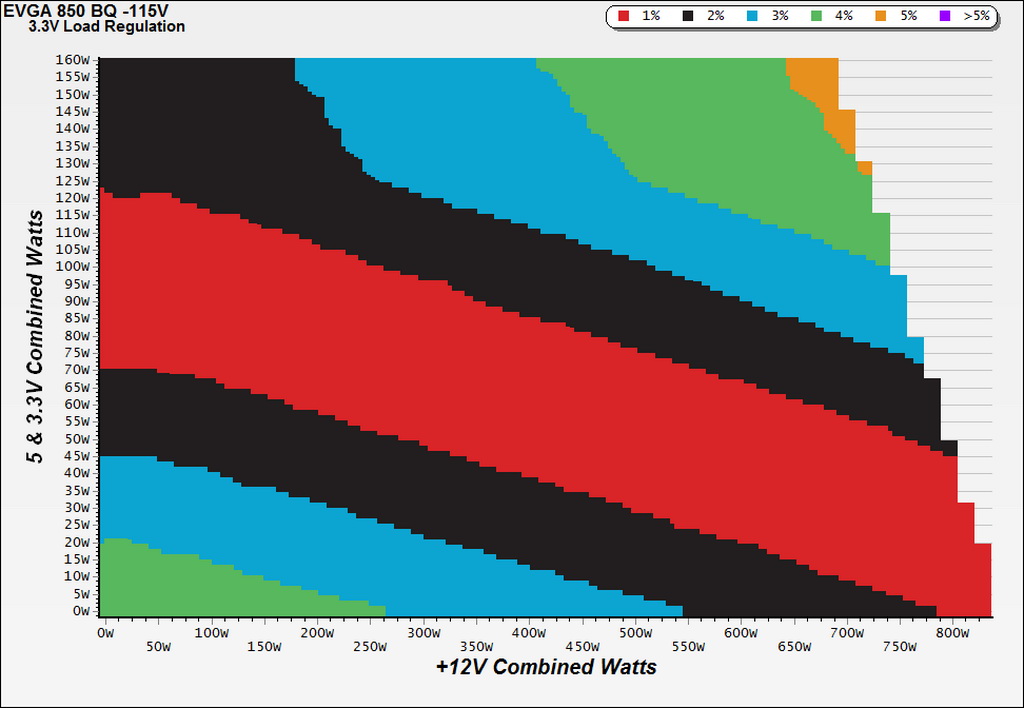
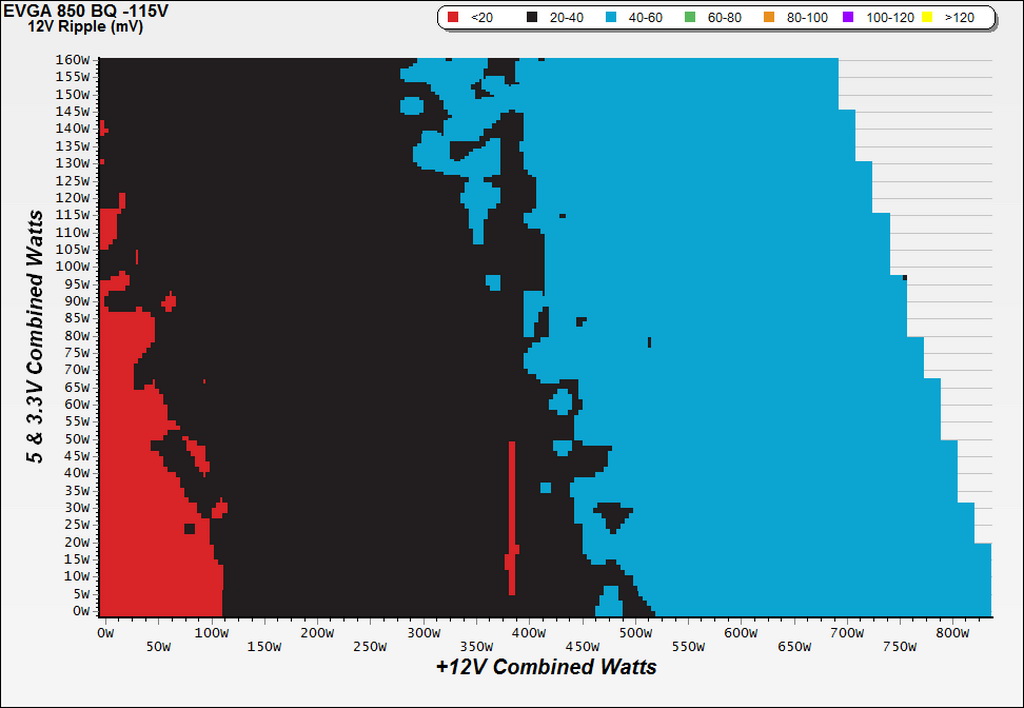
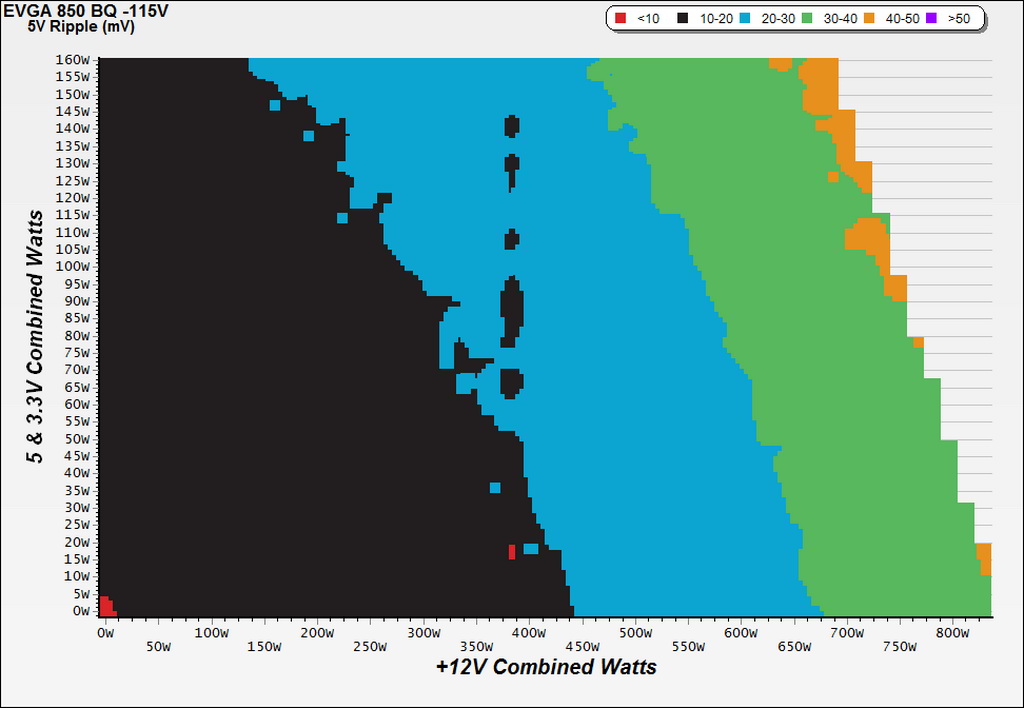
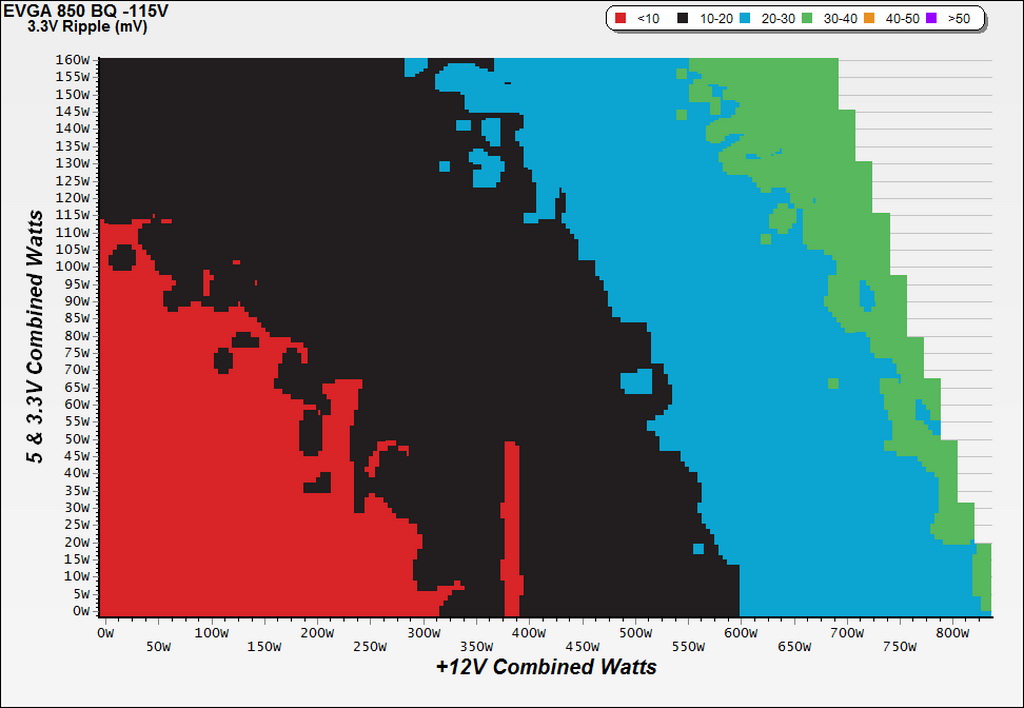
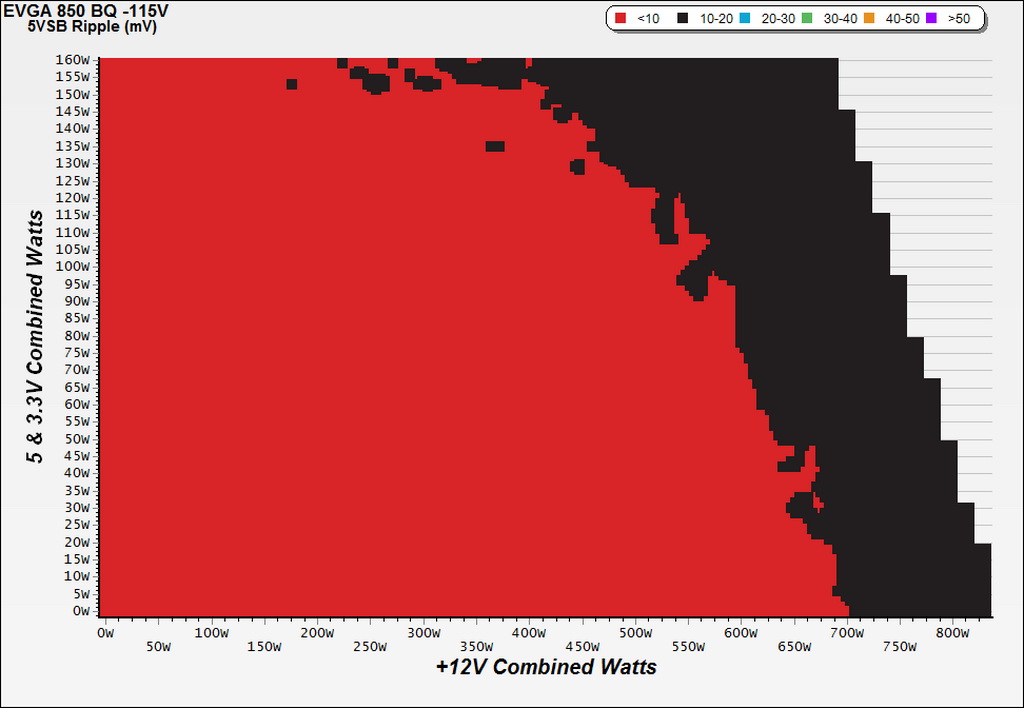
To generate the following charts, we set our loaders to auto mode through our custom-made software before trying more than 25,000 possible load combinations with the +12V, 5V and 3.3V rails. The load regulation deviations in each of the charts below were calculated by taking the nominal values of the rails (12V, 5V and 3.3V) as point zero.
Load Regulation Charts
Efficiency Chart
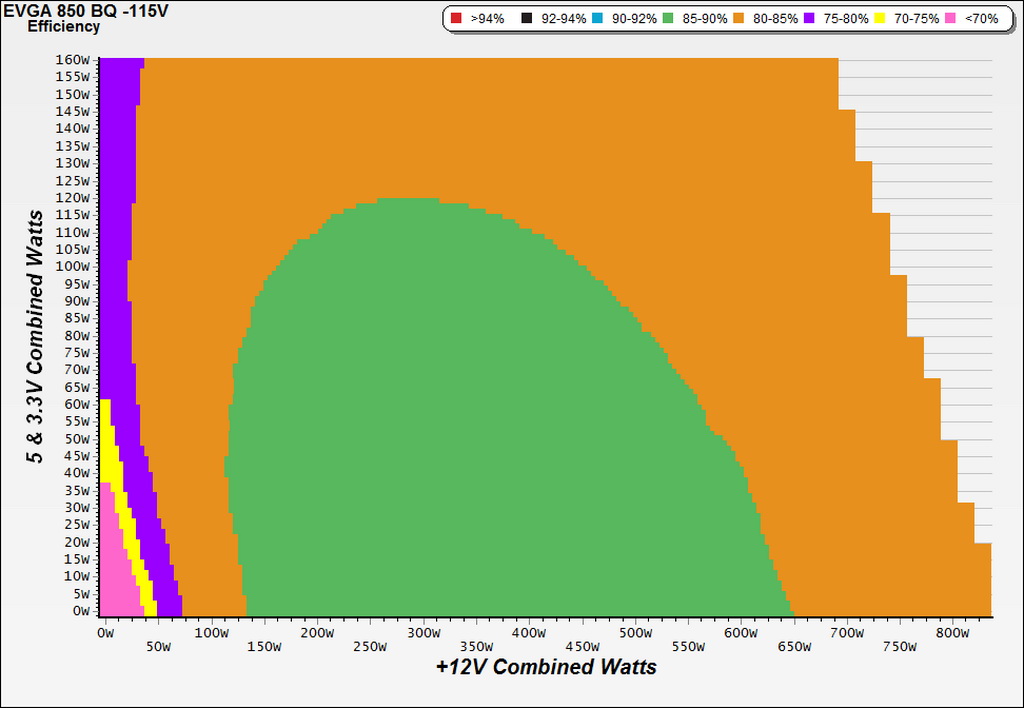
As you can see, the 850 BQ's efficiency is greater than 85% during much of our testing. Above 650W loads it drops to the 80-85% range, but this isn't an issue. The cooling fan's noise is what should worry you under higher loads.
Ripple Charts
Infrared Images
We took some IR photos of the PSU with its top cover, along with the fan, missing and around 400W of load applied for several minutes. We used our modified FLIR E4 camera that delivers 320x240 IR resolution (76,800 pixels).
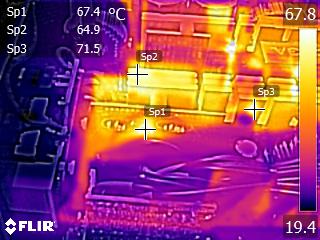
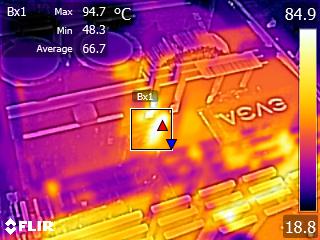
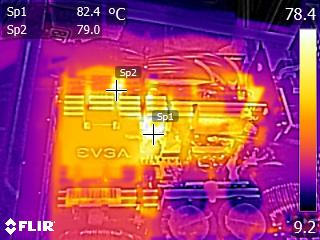
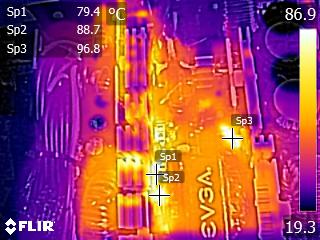
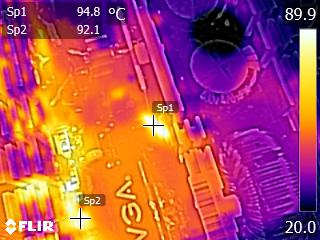
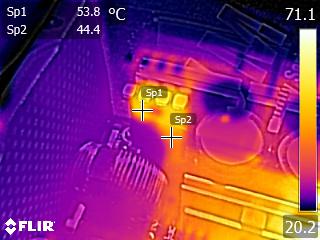
The SBRs on the secondary side get hot quickly without a fan pushing lots of air above them. Even with a fan, under tough conditions the thermal loads on those SBRs will be high. This is why HEC uses a large secondary heat sink.
Also worth mentioning is the NTC thermistor's very high operating temperature, which reaches 97°C in a matter of minutes. The higher its temperature, however, the less energy is wasted, since its resistance gets lower as the temperature rises. The only potential issue is that it'll take some time for the thermistor to cool down once the PSU turns off before it's ready to do its job during the start-up phase.
Get Tom's Hardware's best news and in-depth reviews, straight to your inbox.
Current page: Cross-Load Tests And Infrared Images
Prev Page Protection Features, Evaluated Next Page Transient Response Tests
Aris Mpitziopoulos is a contributing editor at Tom's Hardware, covering PSUs.
-
Metteec Also, for $20 more, you can pick up an equivalent gold rated PSU or maybe even a platinum one on sale and after rebates. It is the halcyon days for competition in quality PSUs.Reply -
_TheD0ct0r_ Reply19020704 said:Thanks for the review. Looks like I will be avoiding this one.
Why is that?
-
Metteec @_THEDICTOR_, for $85, there are so many other better options. EVGA could have been more competitive model if they made quieter version. Instead, you get a PSU with fixed cables, low efficiency, high power variances, and noise like a mini-vacuum. While the higher quality capacitors and warranty are nice, the lack of utility does not make this a good value. 3-years ago, this would have been a great PSU, but times have changed. It is a great day to buy a PSU, just not this one.Reply -
MasterMace appears to be another terrible unit. I'll have to read back and see if it's an Andyson or a HECReply -
Nuckles_56 I would have thought that EVGA could have pushed HEC a bit harder and got a much better unit out of them than thisReply -
lunyone I would personally like to see more 450-550w PSU reviews, not the cherry picked and delivered 750w+ ones that seem to make the rounds. It is just that most people are only going to need 450-550w PSU's for their 1 dGPU based systems.Reply -
Aris_Mp This is not a cherry-picked sample. It comes directly from a store shelf and not from EVGA.Reply
As for more 450-550W PSU reviews, I am currently working on a 500W unit (which however isn't affordable).
