Five Overclocked GeForce GTX 560 Cards, Rounded-Up
We were foiled in our quest to find the best vendor-provided GPU cooler for Nvidia's GeForce GTX 560. But out of the ashes sprung a round-up of cards armed with those very same solutions. Which of these five GF114-based boards is right for you?
Power, Temperature, And Noise
Power draw, thermal performance, and acoustic output should all be important factors to consider as you choose between different variations on the same graphics processor.
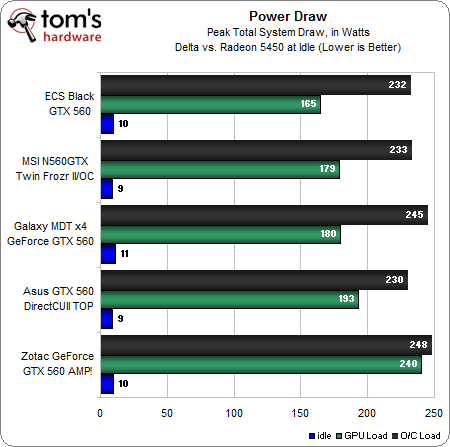
In order to gauge power use, we used a Kill A Watt meter at the wall during our Battlefield 3 testing.
The blue bars represent idle power consumption compared to a Radeon HD 5450, the green bars reflect power consumption under load, and the black bars indicate peak overclocked power use.
Each step of the way, our results reflect clock rates and voltage settings, yielding little in the way of surprises.
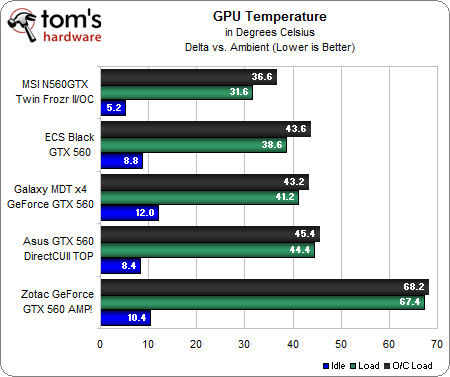
Our thermal measurements were also taken during Battlefield 3 testing and logged with GPU-Z and MSI's Afterburner utility.
The temperature differences between these cards compared to ambient is fairly similar overall. Zotac's offering is the outlier, perhaps as a direct result of the highest default voltage setting. We would have expected those numbers to even out once we overvolted the other cards to similar levels, however, that's not the case, and Zotac's thermal reading remains significantly higher. In contrast, MSI’s Twin Frozr II performs well here.
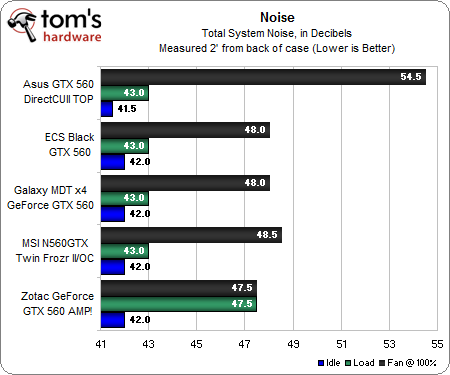
Keep your eye on the green bars, as those represent acoustics using stock fan settings under load. Asus leads just slightly by virtue of its quieter idle noise level. Four of the cards give us the exact same load reading, though, which is pretty impressive given the range of different cooling implementations. Zotac's card again returns louder-than-anticipated results as its fans push to keep those higher thermal readings down.
Get Tom's Hardware's best news and in-depth reviews, straight to your inbox.
Current page: Power, Temperature, And Noise
Prev Page Overclocking And Multi-Monitor Performance Next Page Five Unique GeForce GTX 560sDon Woligroski was a former senior hardware editor for Tom's Hardware. He has covered a wide range of PC hardware topics, including CPUs, GPUs, system building, and emerging technologies.
-
pensivevulcan Kepler is around the corner, so are lower end AMD 7000 series parts, this was interesting but wouldn't one want to wait for a plethora of reasons.Reply -
payneg1 The Galaxy model comes closest with its 830/1002 MHz clocks, but Zotac's AMP! edition goes all the way to 950/1100 MHz.Reply
This dosent match with the above chart -
crisan_tiberiu so, basicaly if someone plays on a single monitor, there is no point going beyond a gtx 560 or a 6950 in today's games. (it slike in the "best gaming CPU chart", no point going beyond i5 2500k for gaming.Reply -
giovanni86 salad10203Are those temps for real? My 280 gtx has never idled under 40C.Your kidding right, my overclocked 580GTX at 60% fan speed idles at 32c. Cards down clock themselves which allows them to run cooler at idle temps even if it were clocked at upwards i don't think a card would get hot unless it was being used.Reply -
justme1977 crisan_tiberiuReply
I have the feeling that even a i5 2500k@4ghz bottlenecks a 7970 @1080p in most newer games.
If the GPU market goes the way it does, it won't take long that even midrange cards will be bottlenecked @1080p by the cpu.
-
FunSurfer I think there is an error on the Asus idle voltage: instead "0.192 V Idle" it should be 0.912Reply


