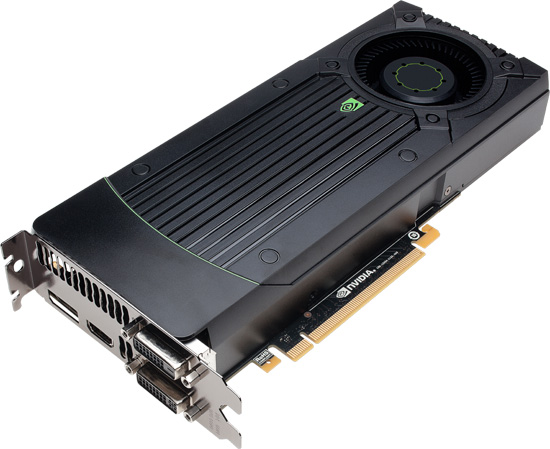
Seven GeForce GTX 660 Ti Cards: Exploring Memory Bandwidth
Seven GeForce GTX 660 Tis landed in our lab. Today, we're benchmarking them, measuring their noise and temperatures, and conducting a more in-depth analysis of the impact a 192-bit memory interface has on performance. The results are enlightening!
Testing For Memory Interface Limitations
We went back and took a closer look at the tests in our launch story, along with the benchmarks run by other sites. After sorting through the settings everyone used, we saw that it's not easy to properly test the limitations of a product's memory bus using real-world metrics. The variations between games, detail settings, and resolutions are so large that there really isn’t a way to definitively order Nvidia's GeForce GTX 660 Ti, AMD's Radeon HD 7950, and the Radeon HD 7870. Any recommendation based on a limited benchmark suite isn't wholly informative until you've covered many, many more titles than anyone could conceivably run leading up to a launch.
In short, every buyer is playing different games at different settings, making it impossible to pass one judgement that applies to everyone. This is particularly true with the GeForce GTX 660 Ti and AMD Radeon HD 7950.
Benchmark Selection and Setup
During the course of our exploration, we noticed the largest performance variations in games that weren't very hard on the GPU, allowing the cards to pump out high frame rates. Under those circumstances, even AMD's Radeon HD 7870 was sometimes able to take the lead. Nvidia's GeForce GTX 660 Ti seemed to run into the biggest problems in titles leveraging little or no tessellation, and the least-demanding effects. A strong GPU didn't matter, and the card was held back by its memory interface like a sports car that can’t put its horsepower down due to small tires.
In light of the 660 Ti's narrower 192-bit memory interface, we needed to figure out the best way to benchmark such a design decision. Some sites used very large textures at very high resolutions and maximum detail settings to demonstrate how the card runs out of steam in extreme situations. Unfortunately, low, unplayable frame rates make it hard to track accuracy. Those numbers aren't practical anyway.
We took a different route. First, we tried to get rid of manufacturer-specific advantages and disadvantages resulting from graphics drivers. After trying out a lot of games, we settled on Batman: Arkham City. We disabled tessellation, horizon-based ambient occlusion (HBAO), and multi-view soft shadows (MVSS) in order to not slow down the GPU too much. Running the game like this, without anti-aliasing, yielded the benchmark results we were expecting at both tested resolutions based on each card's specs. Nvidia's GeForce GTX 670 inched out AMD's Radeon HD 7950, followed by the GeForce GTX 660 Ti with the Radeon HD 7870 in the rear. Then, we set out to measure what happens when resolution is increased and anti-aliasing is enabled.
Choosing the Graphics Cards for the Comparison
Get Tom's Hardware's best news and in-depth reviews, straight to your inbox.
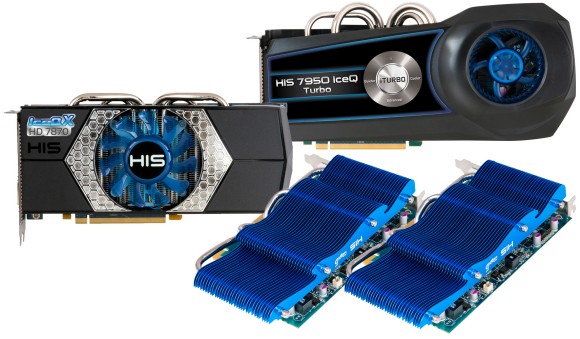
We chose a reference GeForce GTX 670, HIS' 7870 IceQ 2 GB with a 1 GHz GPU clock, HIS' 7950 IceQ with an 800 MHz GPU clock, and two passively-cooled HIS 7750 iSilence 5s in CrossFire. Really, the Radeon HD 7750s shouldn't stand a chance. However, we're currently working on another story testing passive cards, and some of the benchmark results are pretty interesting. We decided to include them at 1920x1080.
We were interested in two things. First, how big is the difference between Nvidia's GeForce GTX 670 and 660 Ti. And second, where do the Radeon HD 7950 and 7870 fit in?
We used each card's reference clock rates for all tests, and we didn't apply the BIOS update for AMD's Radeon HD 7950. As you’ll see, the overclocking doesn’t really change anything when it comes to memory interface limitations. In fact, the performance gets hit even harder.
Also, we were particularly interested in how the 2 GB and 3 GB cards would compare. The only way 2 GB of memory can be handled over a 192-bit bus is with mixed-density ICs. It works like this: the three 64-bit controllers divide the total memory into 512 MB chunks, which are accessed at the full 192 bits. The remaining 512 MB is addressed by just one 64-bit controller in a completely separate transaction. Nvidia won't divulge anything else about its implementation for competitive reasons, but there is undoubtedly latency there the controllers have to contend with. It'd seemingly be easier to implement 3 GB using a trio of 1 GB chunks. Setting each card to Nvidia's reference clock rate provided us with a little insight.
Benchmark System and Settings
We overclocked our CPU to 5 GHz to avoid a CPU-imposed limitation (this required our Core i5-2500K, since the i7-2600K won't go that high; besides, Batman doesn't benefit from Hyper-Threading). In comparison, gaming performance at the processor's factory setting did suffer a little bit. This didn't change the order in which the cards finished, though, so we're confident that our results apply to non-overclocked platforms, too.
| Header Cell - Column 0 | Graphics Test Bench |
|---|---|
| Processor | Core i5-2500K (Sandy Bridge), 32 nm, Overclocked to 5 GHz |
| Cooler | Prolimetech Super Mega + Noiseblocker Multiframe |
| Memory | 4 x 4 GB Kingston HyperX DDR3-1600 |
| Motherboard | Gigabyte Z68X UD7-B3, Z68 Express |
| Operating System and Drivers | Windows 7 Ultimate x64GeForce 305.37 Catalyst 12.8 WHQL |
| Benchmarks | Batman: Arkham CityHBAO Off, MVSS Off, Tessellation Off, Max. Details1920x10802560x1440No AA, FXAA, 2x MSAA, 4x MSAA, 8x MSAA |
Our carefully-selected benchmark should tell us everything we need to know about how these graphics cards stack up against each other. We start out with separate benchmark settings and then combine all of the numbers to give an overview of the cards’ performance.
Current page: Testing For Memory Interface Limitations
Prev Page Benchmark Results: 3D Performance Next Page Testing For Memory Interface Limitations: 1920x1080
Igor Wallossek wrote a wide variety of hardware articles for Tom's Hardware, with a strong focus on technical analysis and in-depth reviews. His contributions have spanned a broad spectrum of PC components, including GPUs, CPUs, workstations, and PC builds. His insightful articles provide readers with detailed knowledge to make informed decisions in the ever-evolving tech landscape
-
scotthulbs I'd Like to know which 2GB model 660ti you used in this comparison? I would like to see how if perhaps the Zotac memory overclock has much of an effect on performance. If you used the Zotac in this comparison that may very well be the reason it outperforms the 3GB Galaxy card? Maybe run this same test overclocking the memory, it seems as though the 660ti with its memory overclocked can nearly reach GTX670 Bandwidth. I'd like to see how much that helps overcome the narrow bus.Reply -
mayankleoboy1 The problem with wider memory interface is that it exponentially increases the chip's die-size. Hence, cost per wafer and power consumption will increase a lot.Reply
IMO both AMD and Nvidia should use the XDR2 memory in the next series of cards. That would give the same bandwidth at half the interface size. -
iknowhowtofixitThis review reinforces what I have been saying for weeks. The GTX 660Ti is overpriced at $300. Since you can easily find a HD7950 for $300 or less after rebates, it makes the 660TI irrelevant. To me, the 660Ti needs to be $60-$75 cheaper before it can achieve bang for the buck status.it is because of the 660ti that the 7950 prices dropped to $300 or less with MIR: so tell me how irrelevant they are now?Reply
-
ahrensy For the Batman Arkham City tests on the 670 and 660ti, was the PhysX setting set to Off, Low or High?Reply -
EzioAs Reply9537131 said:it is because of the 660ti that the 7950 prices dropped to $300 or less with MIR: so tell me how irrelevant they are now?
The 7950 has been our for months now compared to the 660ti and the price drop happens before the release of the 660ti. Nvidia should really have predicted that the 7950 prices should come down even more so it makes almost no sense that they release the 660ti at $300.
The 7870 performs just slightly slower compared to the 660ti but beats it once you crank up the AA really high and it costs $50 less. On the other hand the 7950 is overall faster than the 660ti and even surpass the the $60+ 670 once you crank the AA really high as well. For the 660ti to sell, Nvidia should really lower it to $260 imo.....or they could just rely on fanboys -
Reply9537133 said:The 7950 has been our for months now compared to the 660ti and the price drop happens before the release of the 660ti.
AMD cuts HD 7000 series price even furtherTuesday, 21 August 2012 08:57 (after the 660ti release)
AMD has already dropped the HD 7970 from US $479 to US $429, HD 7950 from US $399 to US $349 and the HD 7870 down from US $349 to US $299. The new price cut skips the HD 7970 graphics card but includes the HD 7950, HD 7870 as well as the 1 and 2GB versions of the HD 7850.
The most important is probably the price cut for the 3GB HD 7950 which battles it out with Nvidia's recently released GTX 660 Ti. The HD 7950 3GB is, according to the report, will receive a US $30 price cut placing it at US $320. The HD 7870 2GB graphics card got another US $50 price cut pushing it down to US $250 which probably makes it one of the most interesting mid-range graphics cards on the market.
cheers! :) -
FormatC Reply
PhysX was off, because it affects the overall performance. PhysX is dead - ok, not quite, but almost ;)9537132 said:For the Batman Arkham City tests on the 670 and 660ti, was the PhysX setting set to Off, Low or High?
-
EzioAs Reply9537134 said:AMD cuts HD 7000 series price even furtherTuesday, 21 August 2012 08:57 (after the 660ti release)
AMD has already dropped the HD 7970 from US $479 to US $429, HD 7950 from US $399 to US $349 and the HD 7870 down from US $349 to US $299. The new price cut skips the HD 7970 graphics card but includes the HD 7950, HD 7870 as well as the 1 and 2GB versions of the HD 7850.
The most important is probably the price cut for the 3GB HD 7950 which battles it out with Nvidia's recently released GTX 660 Ti. The HD 7950 3GB is, according to the report, will receive a US $30 price cut placing it at US $320. The HD 7870 2GB graphics card got another US $50 price cut pushing it down to US $250 which probably makes it one of the most interesting mid-range graphics cards on the market.
cheers! :)
If you check the price of the 7950s before this news at most online retailer (Newegg, NCIX), you'll know that the price drop happens already although the official news from AMD was a couple of weeks later -
Reply
now you are talking complete nonsense unless you do not understand there were two price drops and the latter of which is because of the 660ti; as the article stated.so you want to see pricing history . . :)9537136 said:If you check the price of the 7950s before this news at most online retailer (Newegg, NCIX), you'll know that the price drop happens already although the official news from AMD was a couple of weeks later
Sapphire Radeon HD 7950 3GB Video Card
now how much sense does it make to drop prices and not tell anyone?
:pfff:

