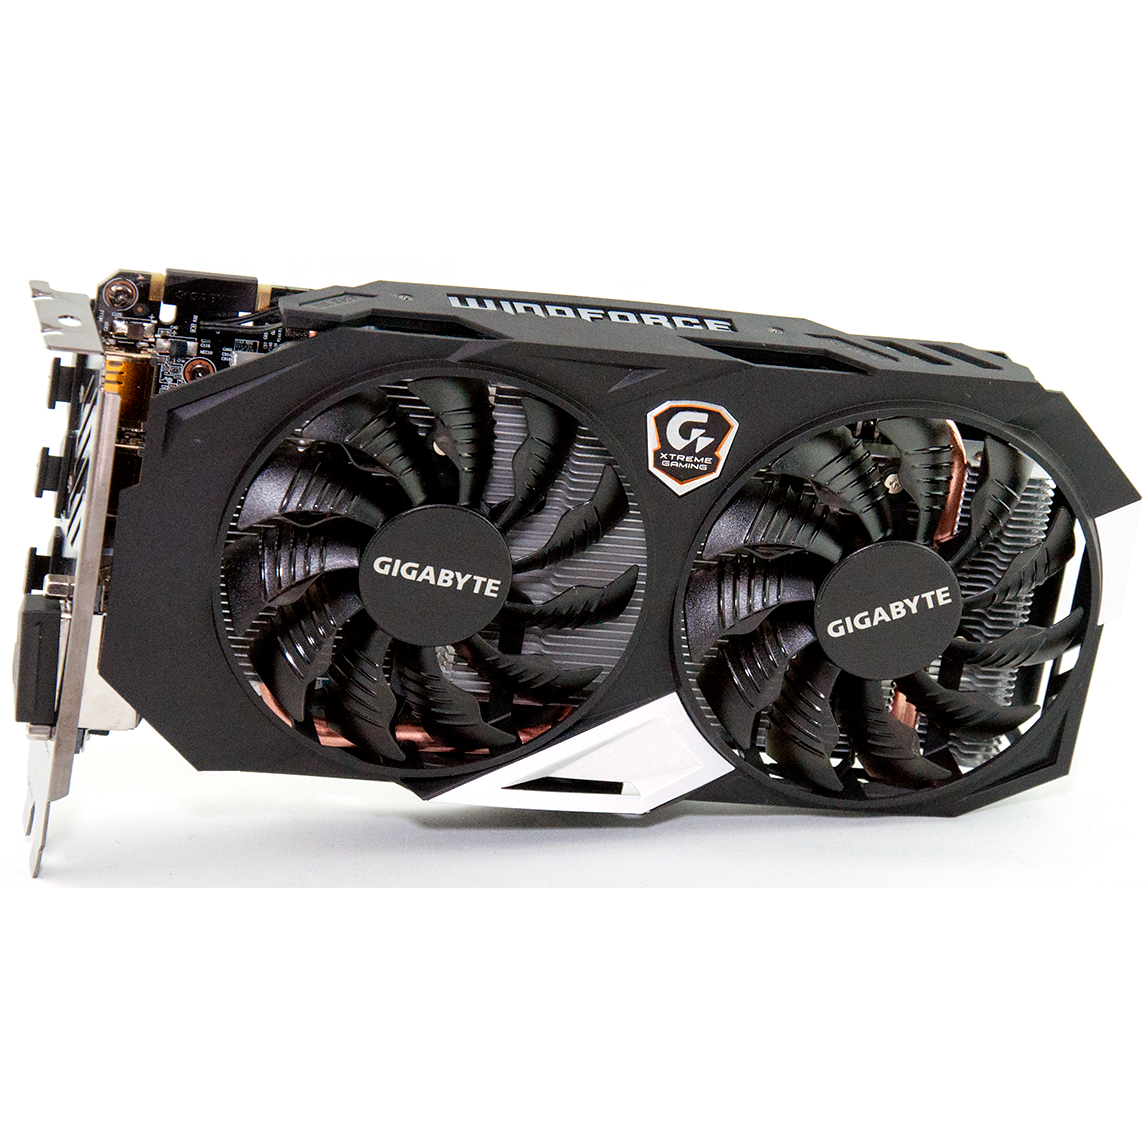
Gigabyte GeForce GTX 950 Xtreme Gaming Review
Nvidia's GeForce GTX 950 offers great value, performing nearly as well as the 960 for less money. Can Gigabyte's aggressively overclocked GeForce GTX 950 Xtreme Gaming outperform the more expensive GPU?
Why you can trust Tom's Hardware
How We Test
Test System
In order for us to compare results between cards reviewed by any of our reviewers, Tom's Hardware standardized the test bench that we all use for 2015. By doing this, each of our locations can have different sets of cards and still compare from the pool of results that any of us have obtained. Starting with an MSI X99S XPower motherboard, each test bench has an Intel Core i7-5930K overclocked to 4.2GHz, 16GB of Crucial Balistix Sport DDR4, two Crucial 500GB SSDs and an 850W power supply from be quiet!.
Software And Drivers
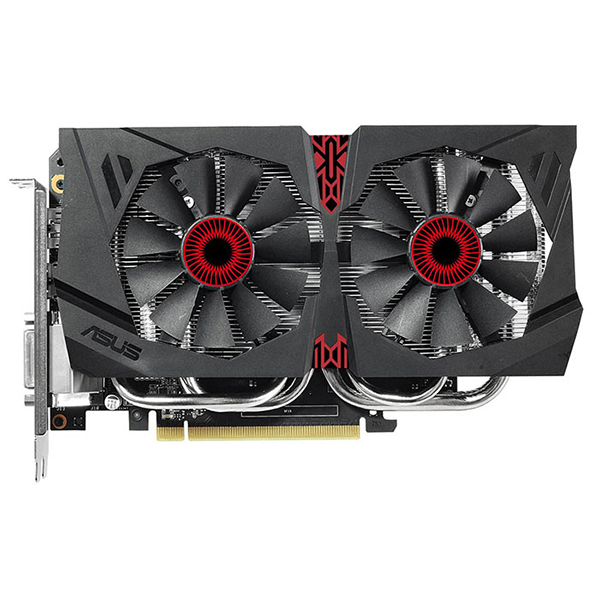
We retested Asus' GTX 950 Strix with an updated 358.50 driver package for this comparison, and the same was done for Zotac's GTX 960. Nvidia is pushing the GTX 950 as a step up for GeForce GTX 650 owners with a similar budget, but interested in more performance. We tested a 650 in our first look at the GeForce GTX 950 back in August. But for this review, we chose to leave the 650 numbers out. You can find the comparison here if that interests you.
The GTX 750 Ti does make it into our graphics, though its performance wasn't refreshed through a driver update. The numbers come from our GTX 950 Strix review; they were generating using Nvidia's 355.65 package.
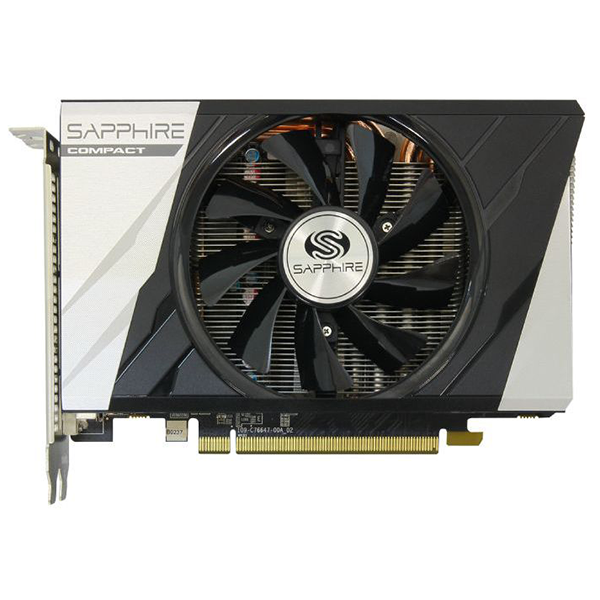
There were some complaints about AMD's showing in the last GeForce GTX 950 review, so rather than pulling the same numbers, we re-ran results on the XFX R7 370 and Sapphire R9 380 ITX using Catalyst 15.7.1.
Benchmarks
| Middle-earth: Shadow of Mordor | Built-in benchmark, 40-sec Fraps, Very High |
|---|---|
| Battlefield 4 | Custom THG Benchmark, 100-sec Fraps, Ultra preset |
| Metro: Last Light | Built-in benchmark, 145-sec Fraps, Very High preset, 16x AF, Normal motion blur |
| Tomb Raider | Version 1.01.748.0, Custom THG Benchmark, 40-sec Fraps, Ultimate preset |
| Far Cry 4 | Version 1.9.0, Custom THG benchmark, 60-sec Fraps, Ultra preset |
| Grand Theft Auto V | Build 350, Online 1.26, In-game benchmark sequence #5, 110-sec Fraps, FXAA: On, MSAA: 2x, Texture Quality: Very High, Shader Quality: Very High, Shadow Quality: High, Reflection Quality: Very High, Water Quality: High, Particles Quality: Very High, Grass Quality: High, Soft Shadows: Softer, Post FX: Very High, Anisotropic Filtering: 16x |
Noise
To test for noise, a handheld decibel meter records acoustic output two inches behind the graphics card's I/O bracket. The instrument has a floor of 35dB; anything lower and it registers 0dB. To represent a recording that comes back as 0dB, but clearly isn't silent, the graph is made to indicate 34dB. When no sound is generated (such as when the fans stop spinning in a semi-passive mode), the graph shows 0dB.
Power
To test power consumption using our reference platform, a bit of creative math is needed. Since Haswell-E processors don’t have integrated GPU cores, we can’t boot the system without a discrete board installed to get a baseline. We are able to estimate consumption based on the approximate power draw of the test bench, though. In our observations, we’ve found that the approximate power draw from everything other than the GPU is 120W. By deducting that from the recorded wattage reported on our in-line power meter, we can calculate the approximate draw of the GPU.
Gaming
All of the benchmark runs employ the same game settings used for our higher-end card reviews. The first GTX 950 we wrote about was tested under toned-down detail levels in GTA V, which proved unnecessary. For that reason, we reran the game using more taxing quality settings.
Get Tom's Hardware's best news and in-depth reviews, straight to your inbox.
Each benchmark is run at two resolutions. Gamers buying this kind of card won't be playing on QHD or 4K displays. Instead, 1920x1080 and lower are going to be most prevalent. We added 1366x768 for its popularity on the Steam Hardware Survey.
Comparison Graphics Cards
MORE: Best Graphics CardsMORE: All Graphics Content
Kevin Carbotte is a contributing writer for Tom's Hardware who primarily covers VR and AR hardware. He has been writing for us for more than four years.
-
chaosmassive for future benchmark, please set to 1366x768 instead of 720p as bare minimumReply
because 720p panel pretty rare nowadays, game with resolution 720p scaled up for bigger screen, its really blur or small (no scaled up) -
kcarbotte Replyfor future benchmark, please set to 1366x768 instead of 720p as bare minimum
because 720p panel pretty rare nowadays, game with resolution 720p scaled up for bigger screen, its really blur or small (no scaled up)
All of the tests were done at 1366x768.
Where do you see 720p?
-
rush21hit I have been comparing test result for 950 from many sites now and that leaves me to a solid decision; GTX 750Ti. I'm having the aging HD6670 right now.Reply
Even the bare bone version still needed 6pin power and still rated 90Watt, let alone the overbuilt. As someone who uses a mere Seasonic's 350Watt PSU, I find the 950 a hard sell for me. Add in CPU OC factor and my 3 HDD, I believe my PSU is constrained enough and only have a little bit more headroom to give for GPU.
If only it doesn't require any additional power pin and a bit lower TDP.
Welp, that's it. Ordering the 750Ti now...whoa! it's $100 now? yaayyy -
ozicom I decided to buy a 750Ti past but my needs have changed. I'm not a gamer but i want to buy a 40" UHD TV and use it as screen but when i dig about this i saw that i have to use a graphics card with HDMI 2.0 or i have to buy a TV with DP port which is very rare. So this need took me to search for a budget GTX 950 - actually i'm not an Nvidia fan but AMD think to add HDMI 2.0 to it's products in 2016. When we move from CRT to LCD TV's most of the new gen LCD TV had DVI port but now they create different ports which can't be converted and it makes us think again and again to decide what to buy.Reply -
InvalidError Reply
There are adapters between HDMI, DP and DVI. HDMI to/from DVI is just a passive dongle either way.17165047 said:now they create different ports which can't be converted
-
Larry Litmanen Obviously these companies know their buying base far better than i do, but to me the appeal of 750TI was that you did not need to upgrade your PSU. So if you have a regular HP or Dell you can upgrade and game better.Reply
I guess these companies feel like most people who buy a dedicated GPU probably have a good PSU. -
TechyInAZ Looks great! Right off the bat it was my favorite GTX 950 card since Gigabyte put some excellent aesthetics into the card, but I will still go with EVGA.Reply -
matthoward85 Anyone know what the SLI equivalent would be comparable to? greater or less than a gtx 980?Reply


