Why you can trust Tom's Hardware
We measure real-world power consumption using Powenetics testing hardware and software. We capture in-line GPU power consumption by collecting data while looping Metro Exodus (the original, not the enhanced version) and while running the FurMark stress test. Our test PC remains the same old Core i9-9900K as we've used previously, to keep results consistent.
For the RTX 4090 cards, we've upped the quality setting in Metro Exodus to 4K extreme in order to tax the GPU as much as possible, and we run at 2560x1440 with FurMark. That's slightly different from the other GPUs we've tested in the past, but these charts are intended to represent something close to worst-case power consumption, temps, etc., so we check other settings to ensure we're pushing the GPUs as much as reasonably possible.
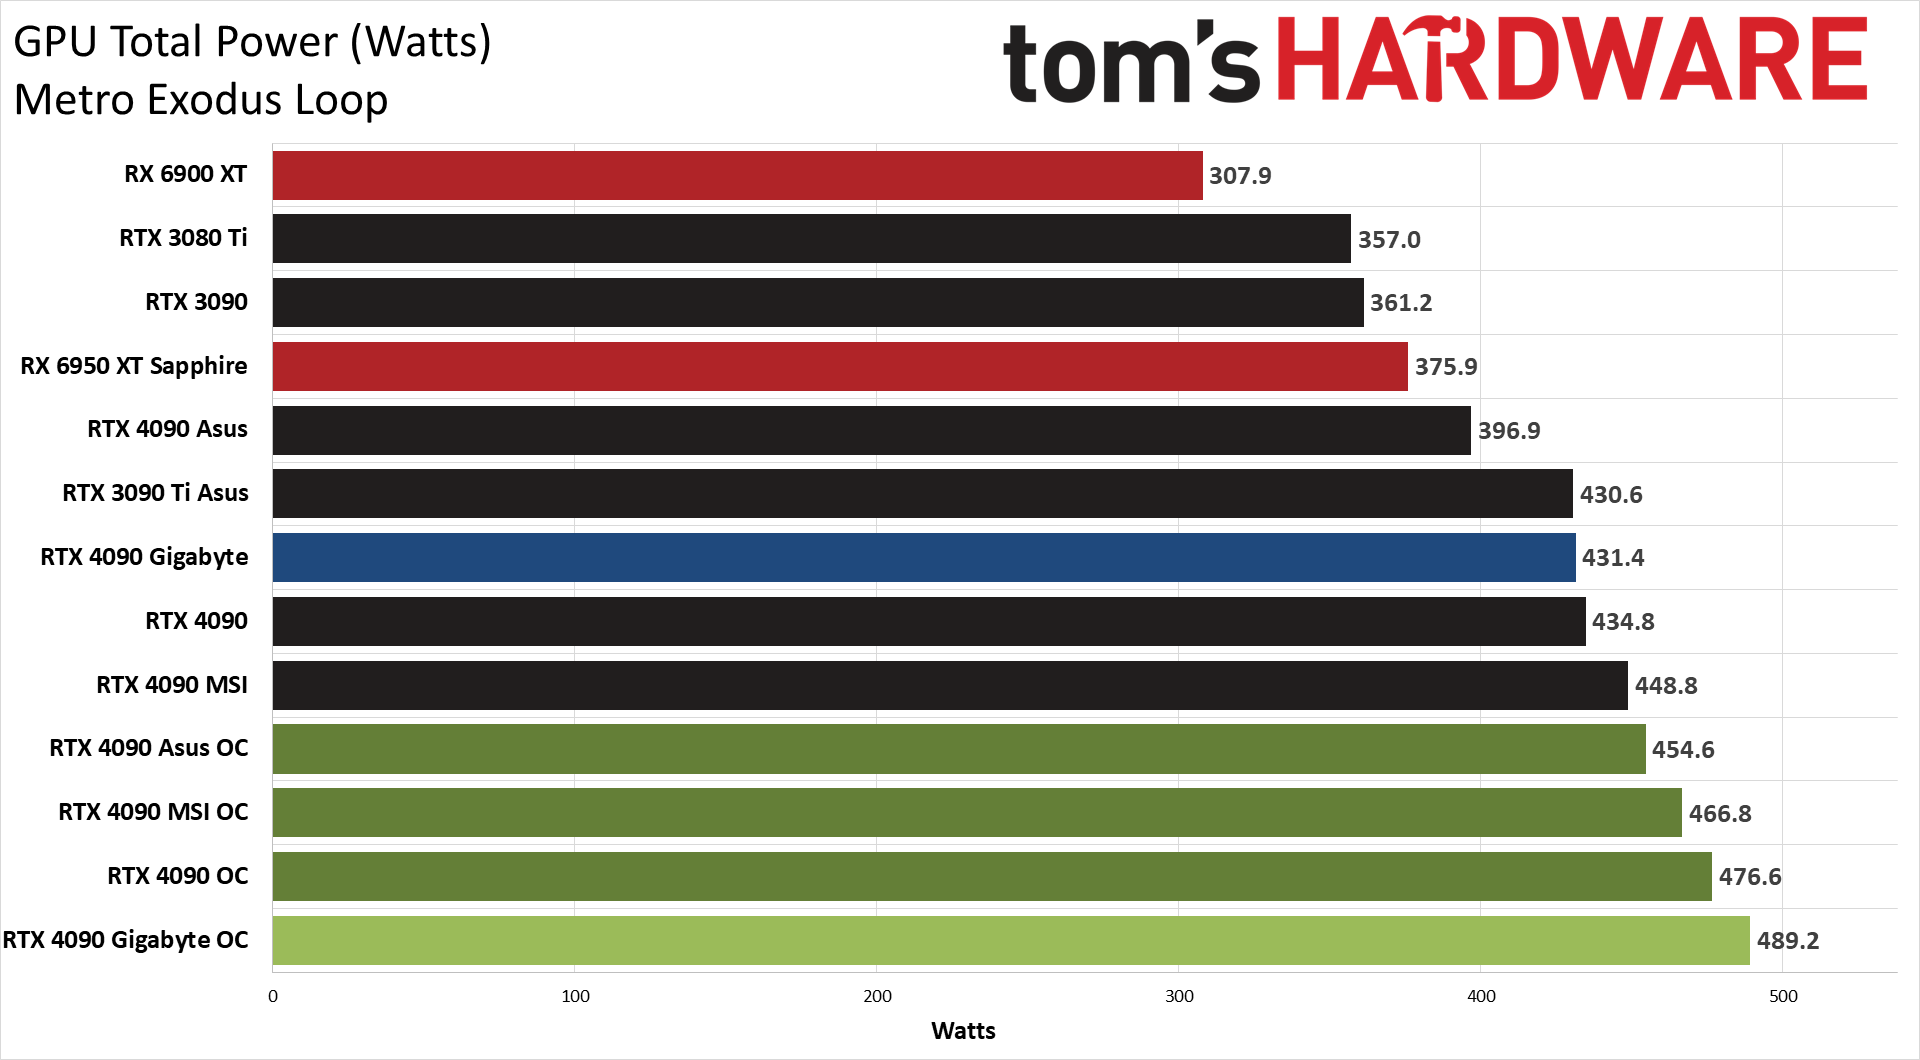
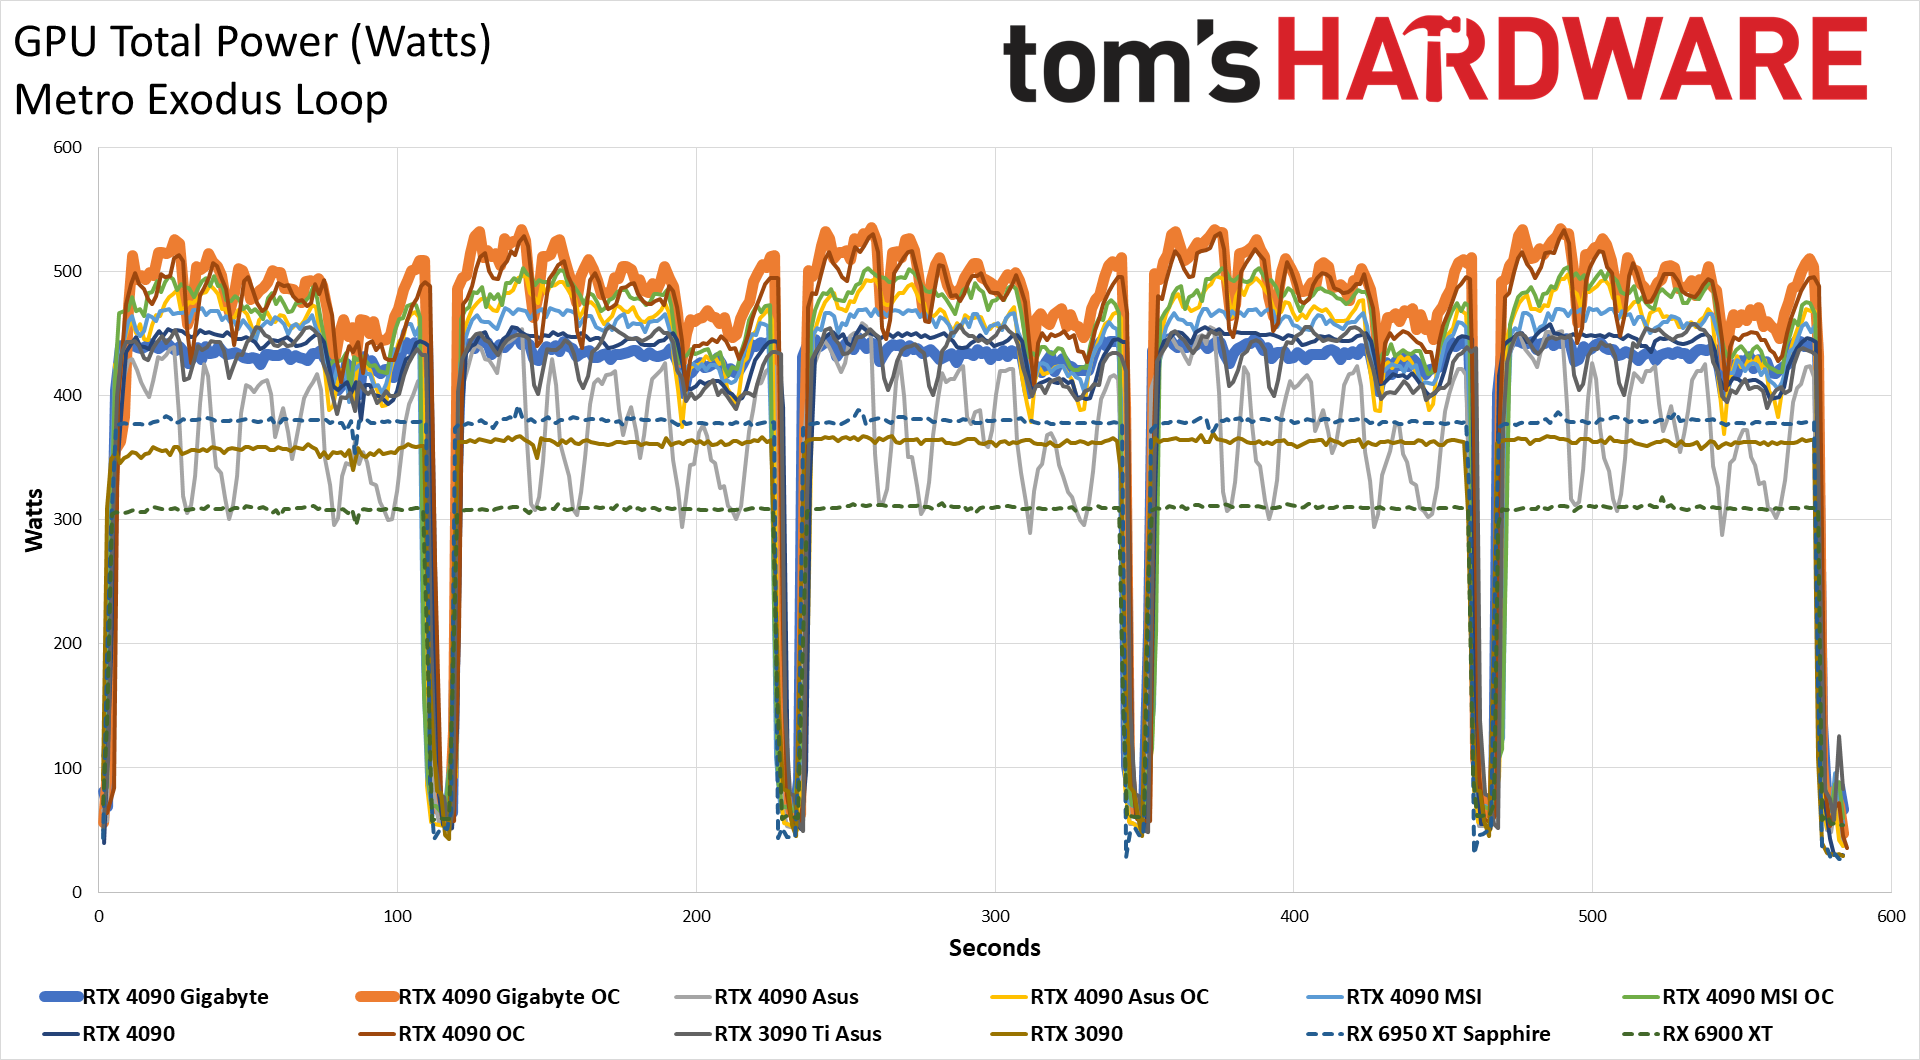
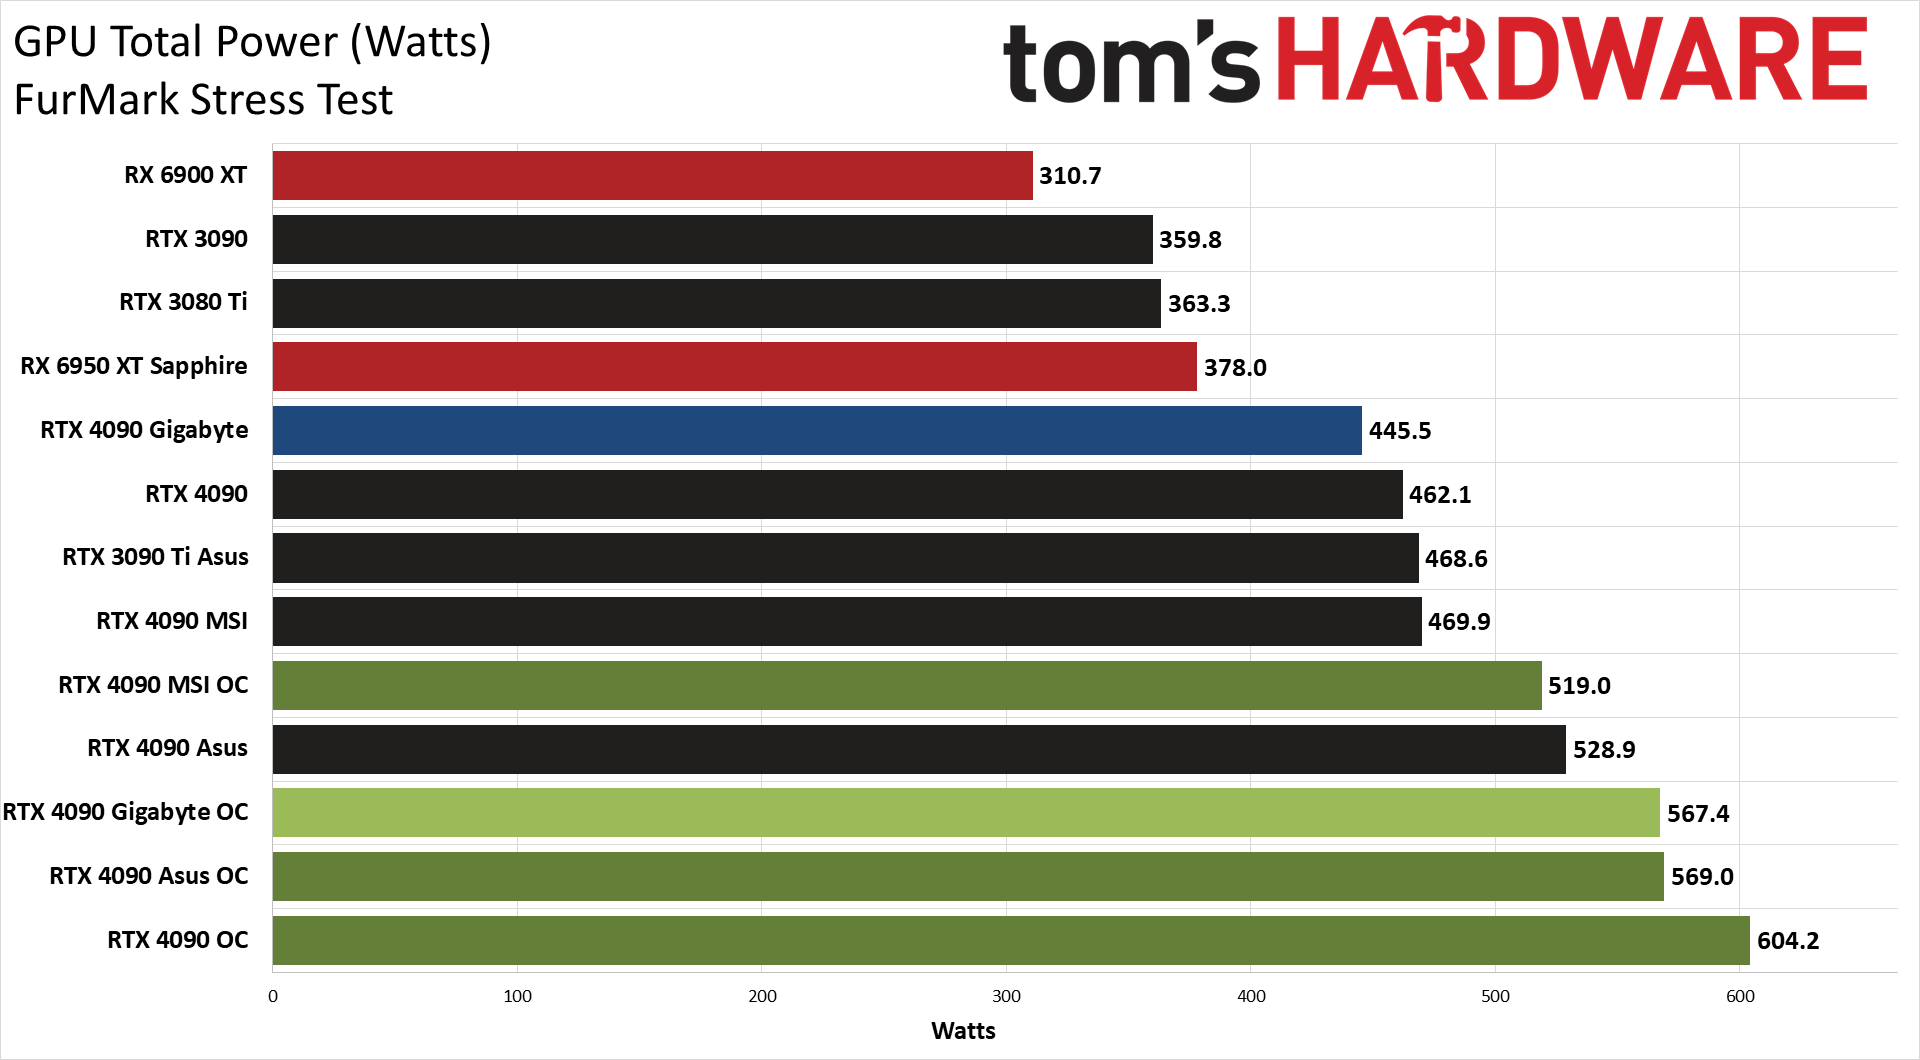
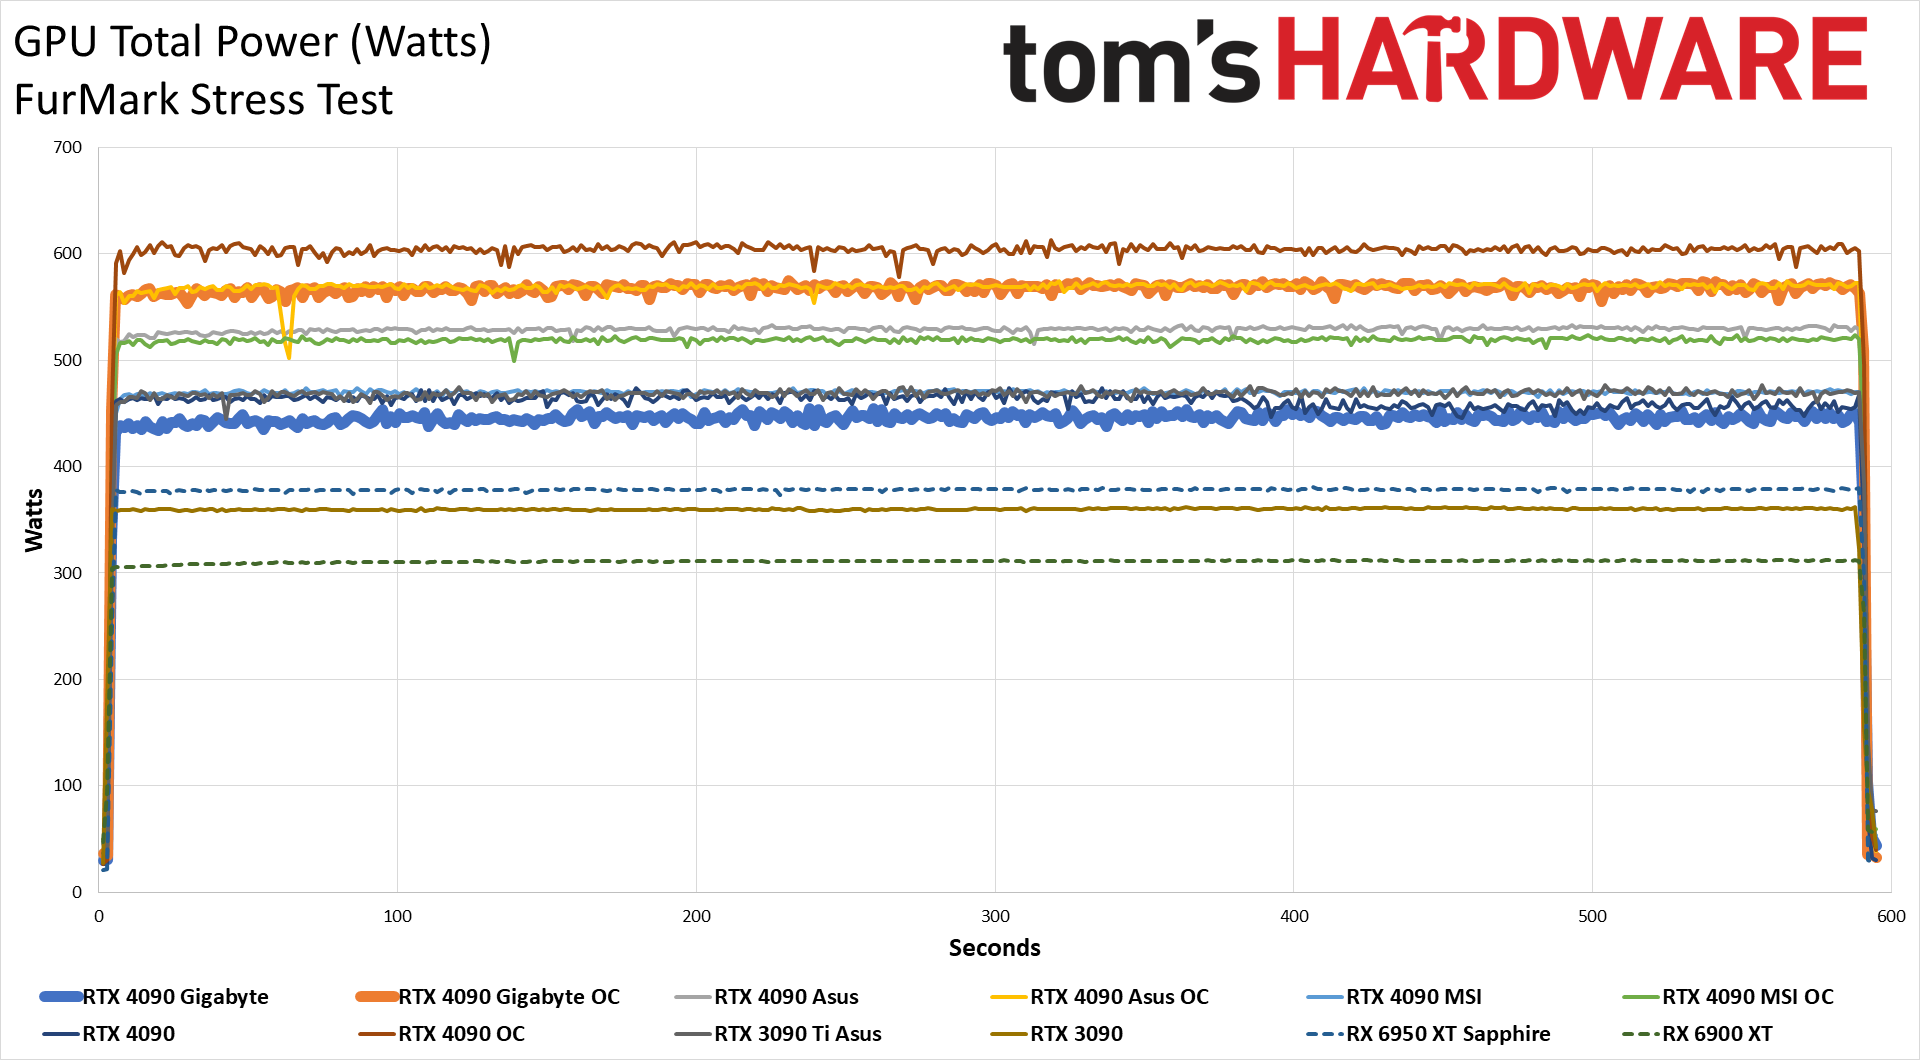
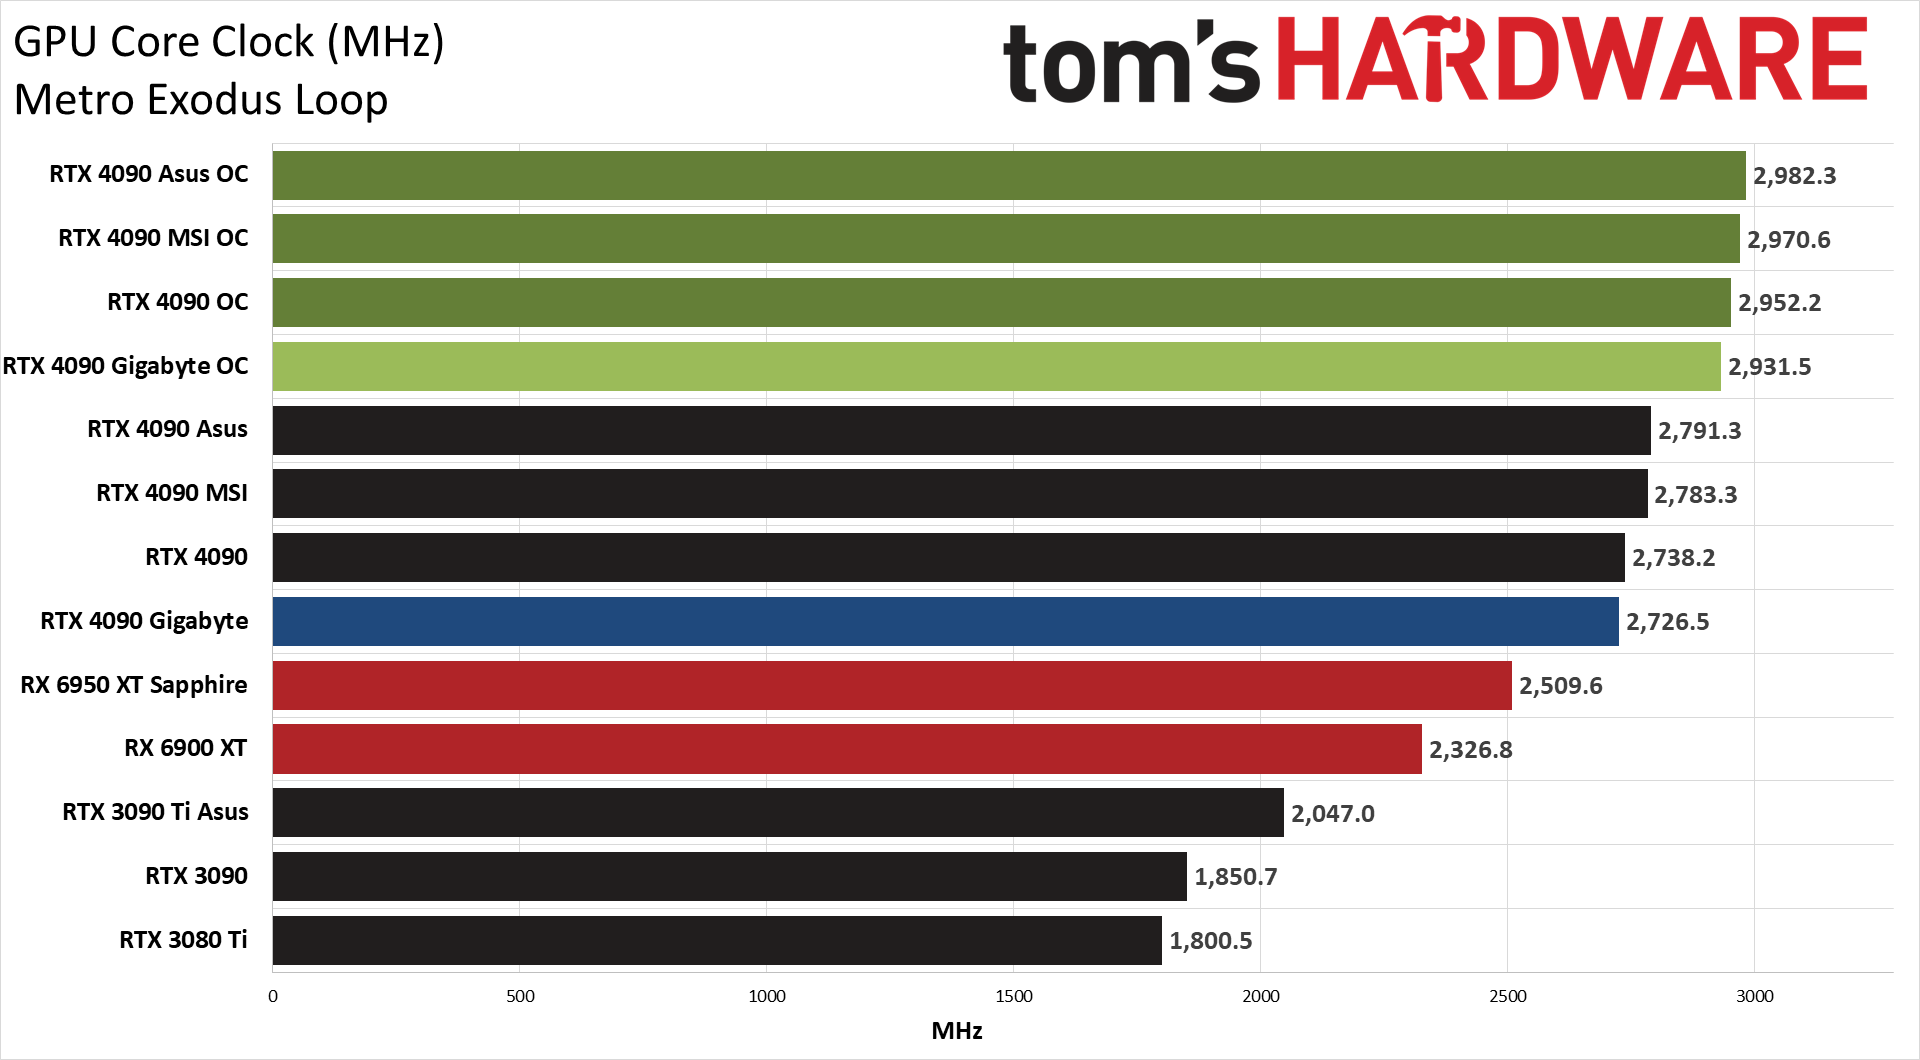
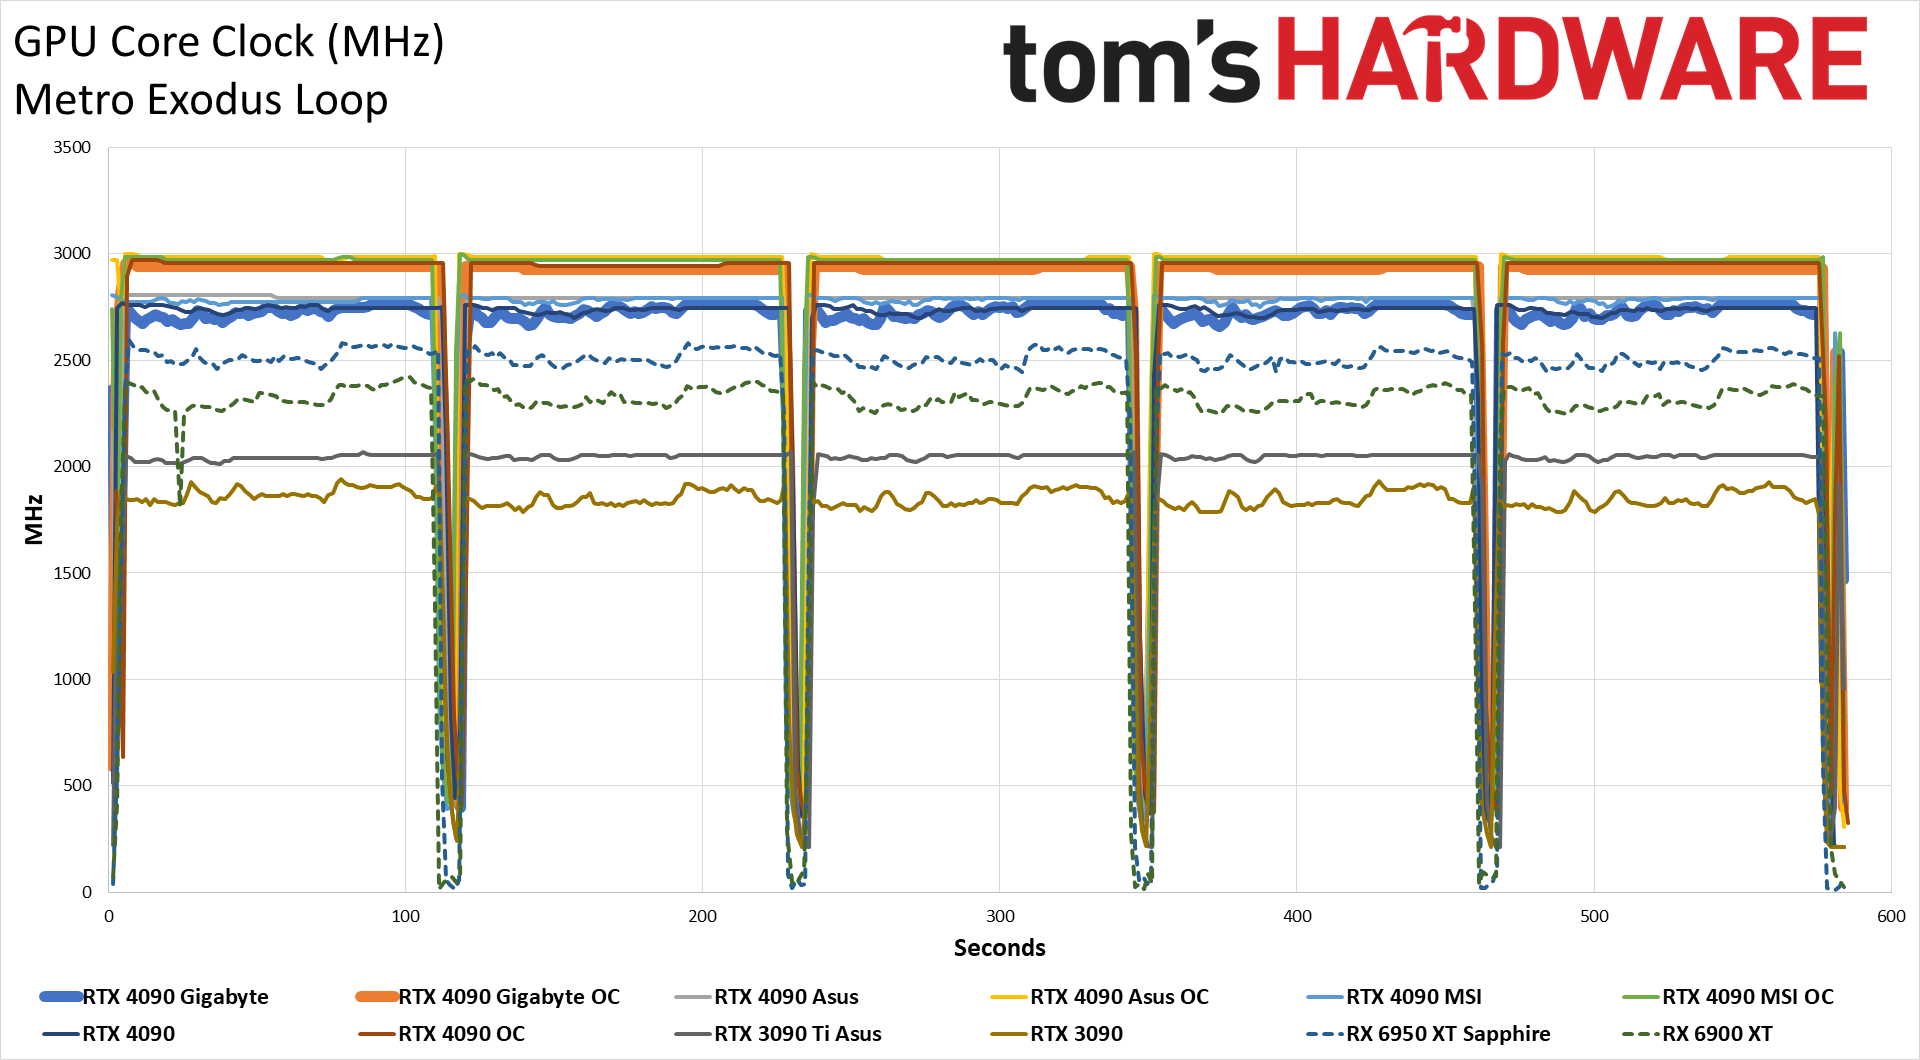
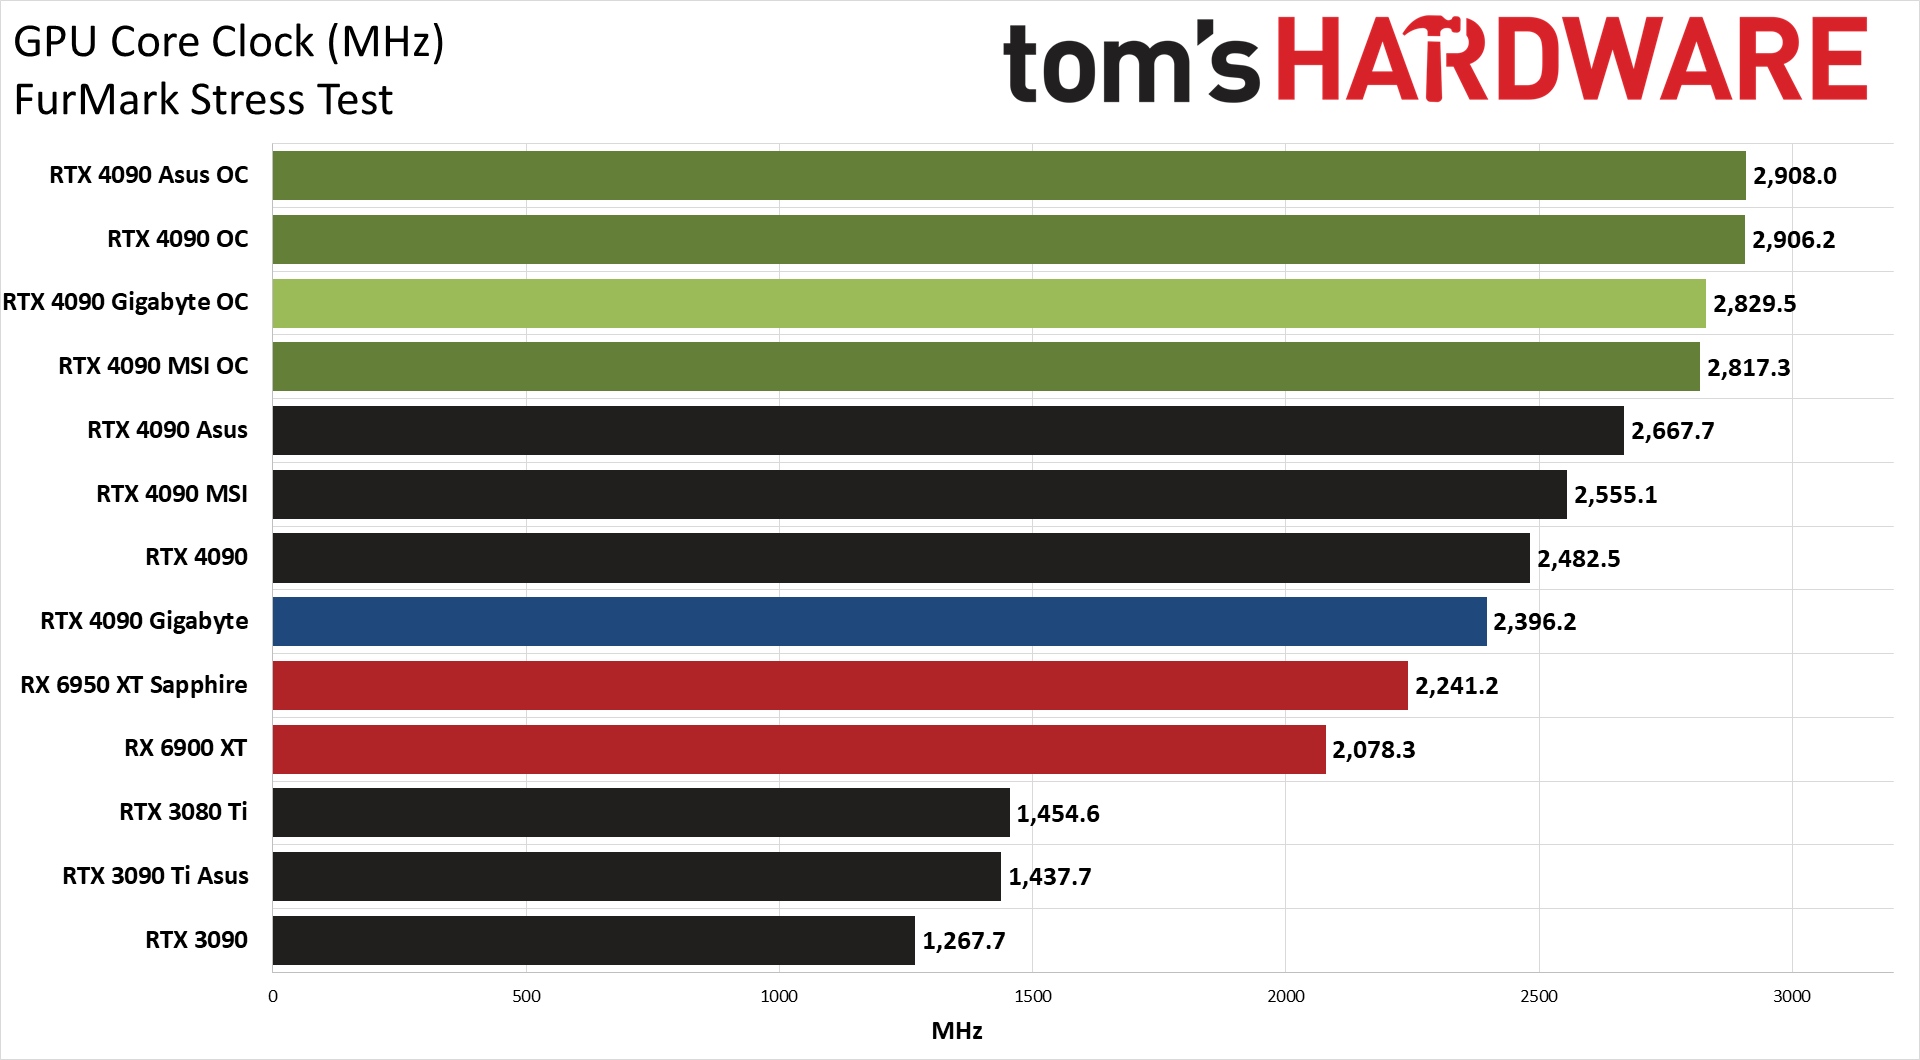
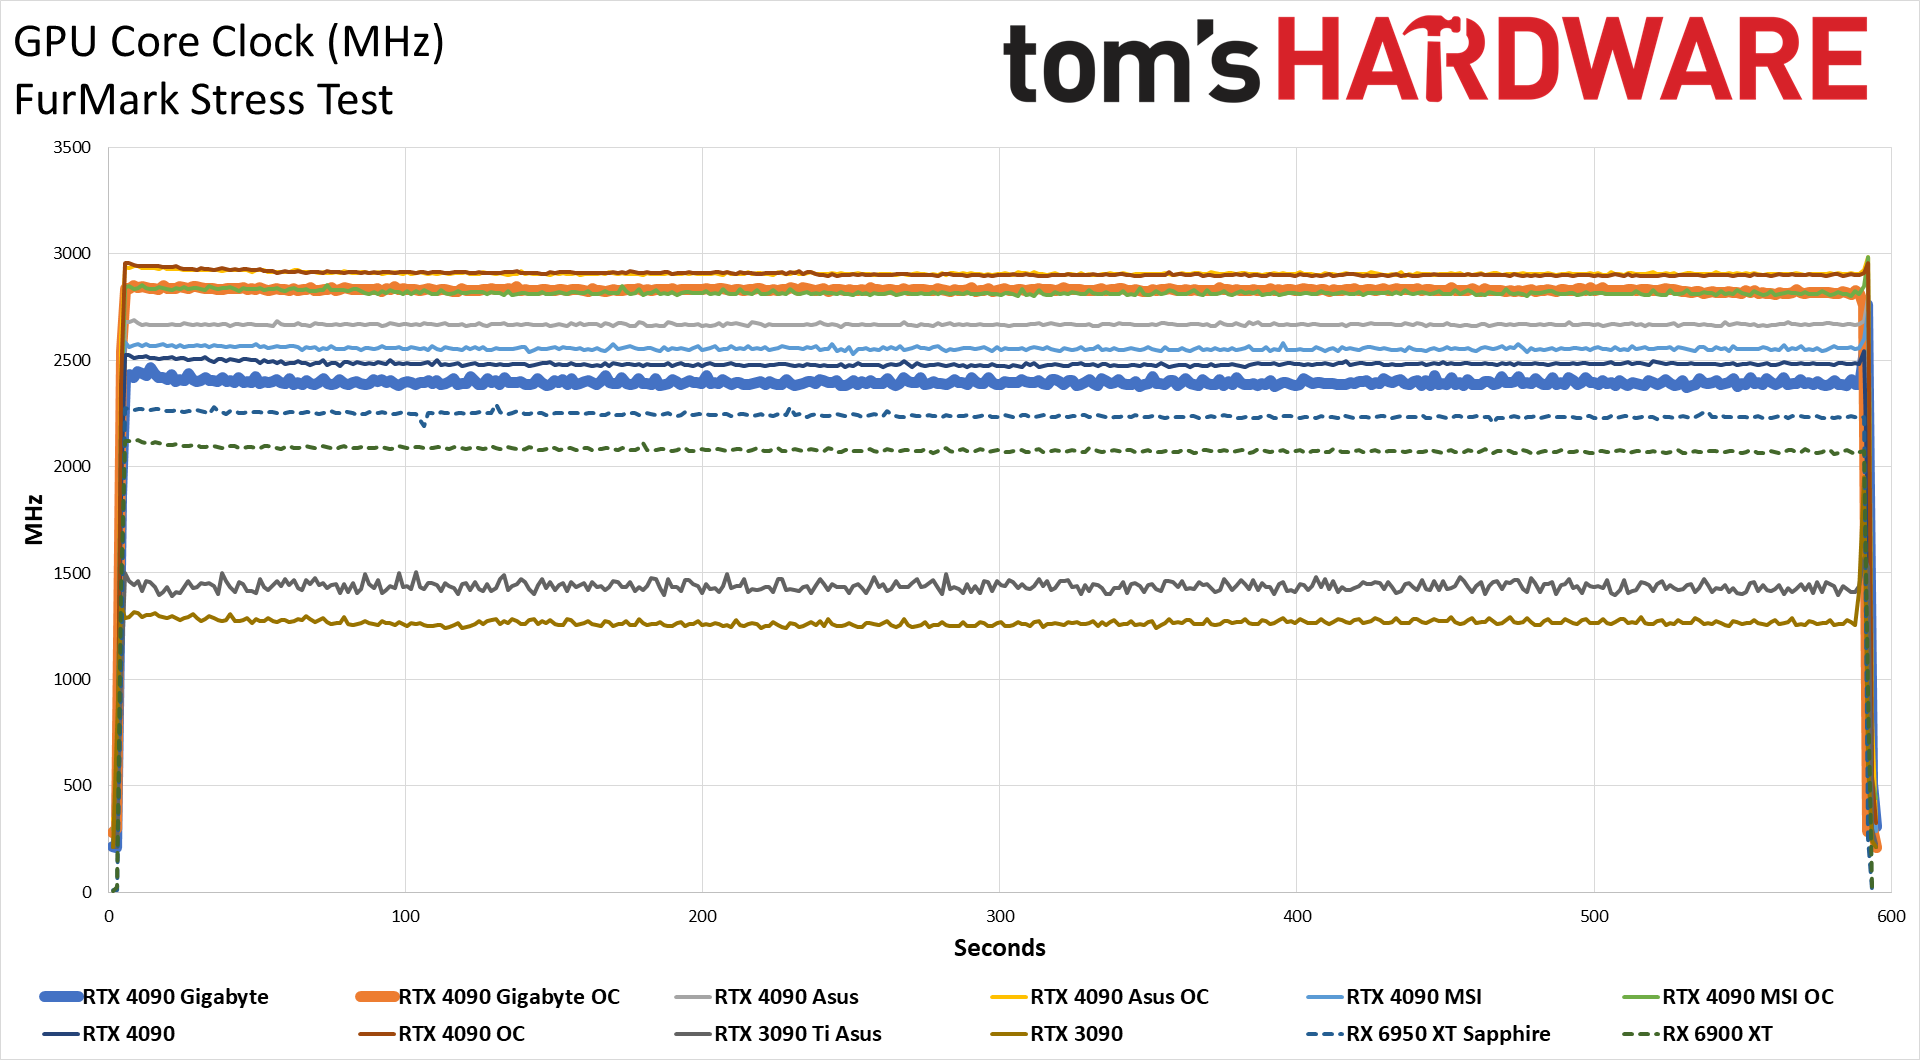
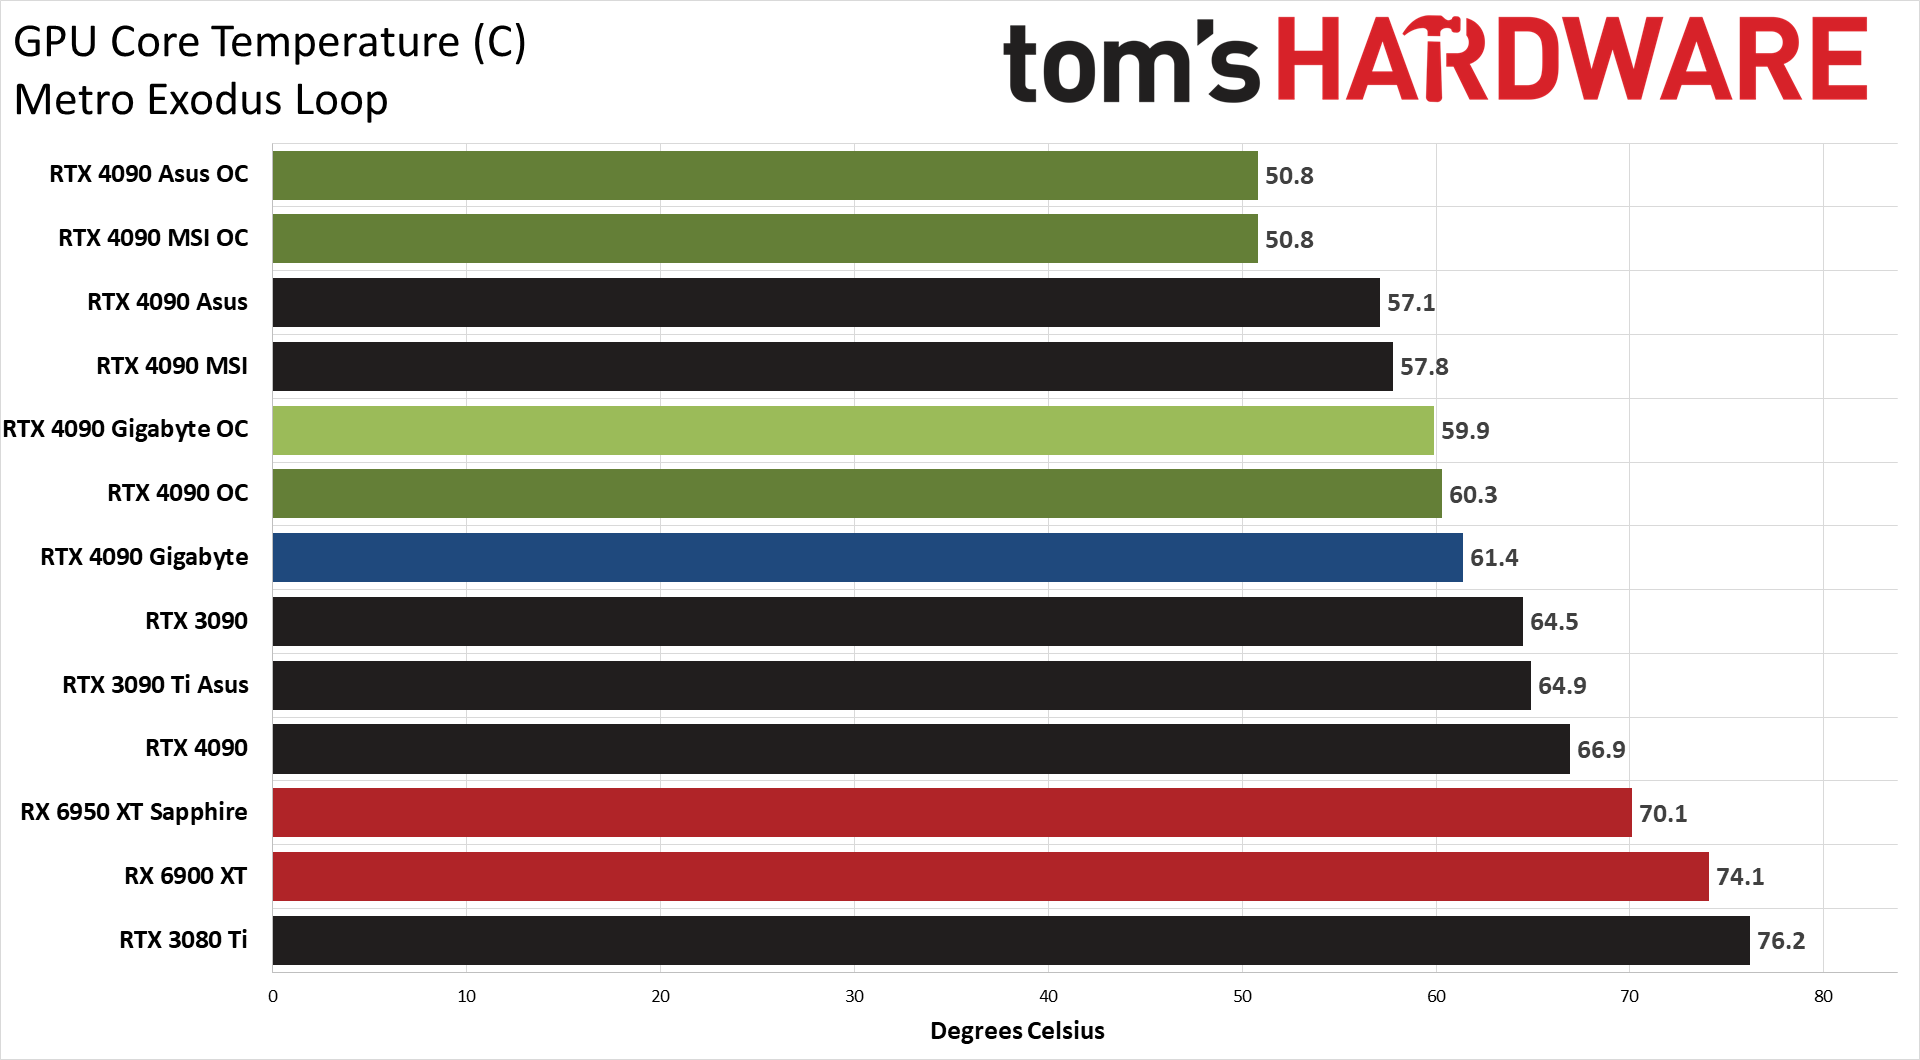
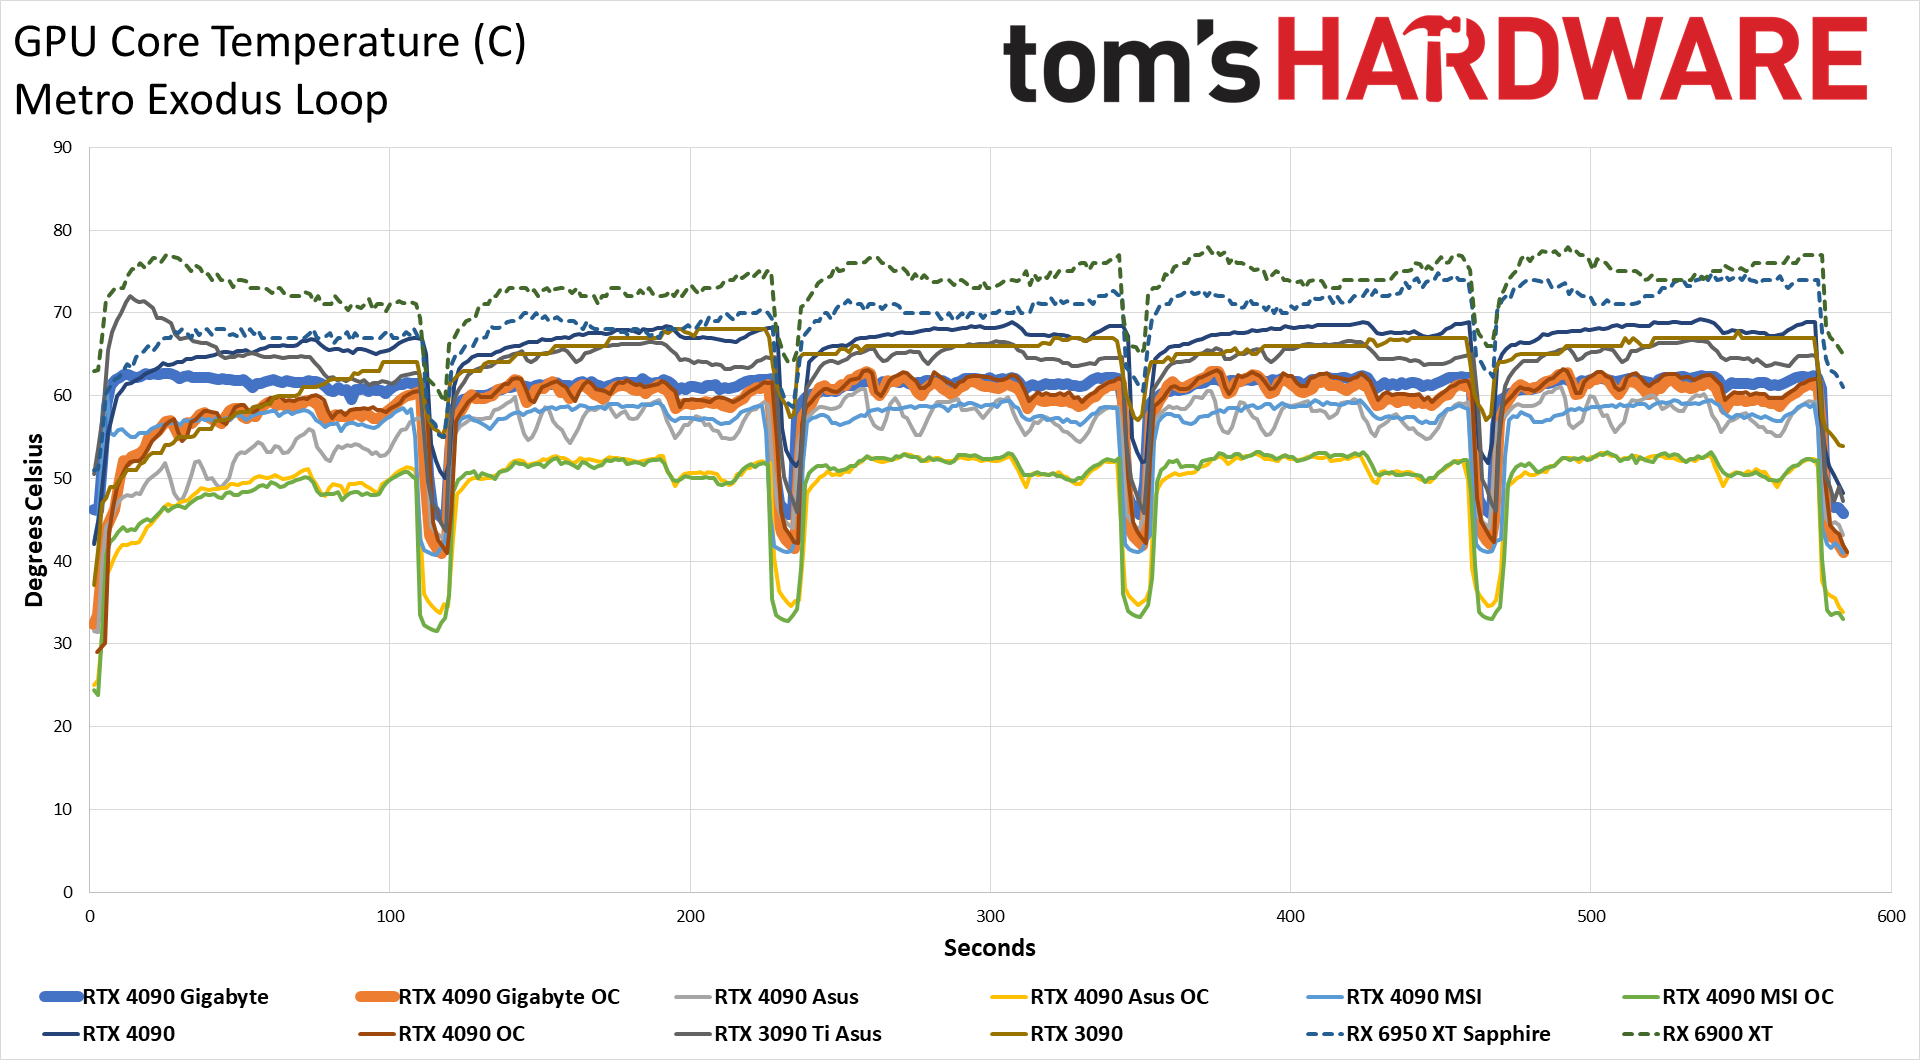
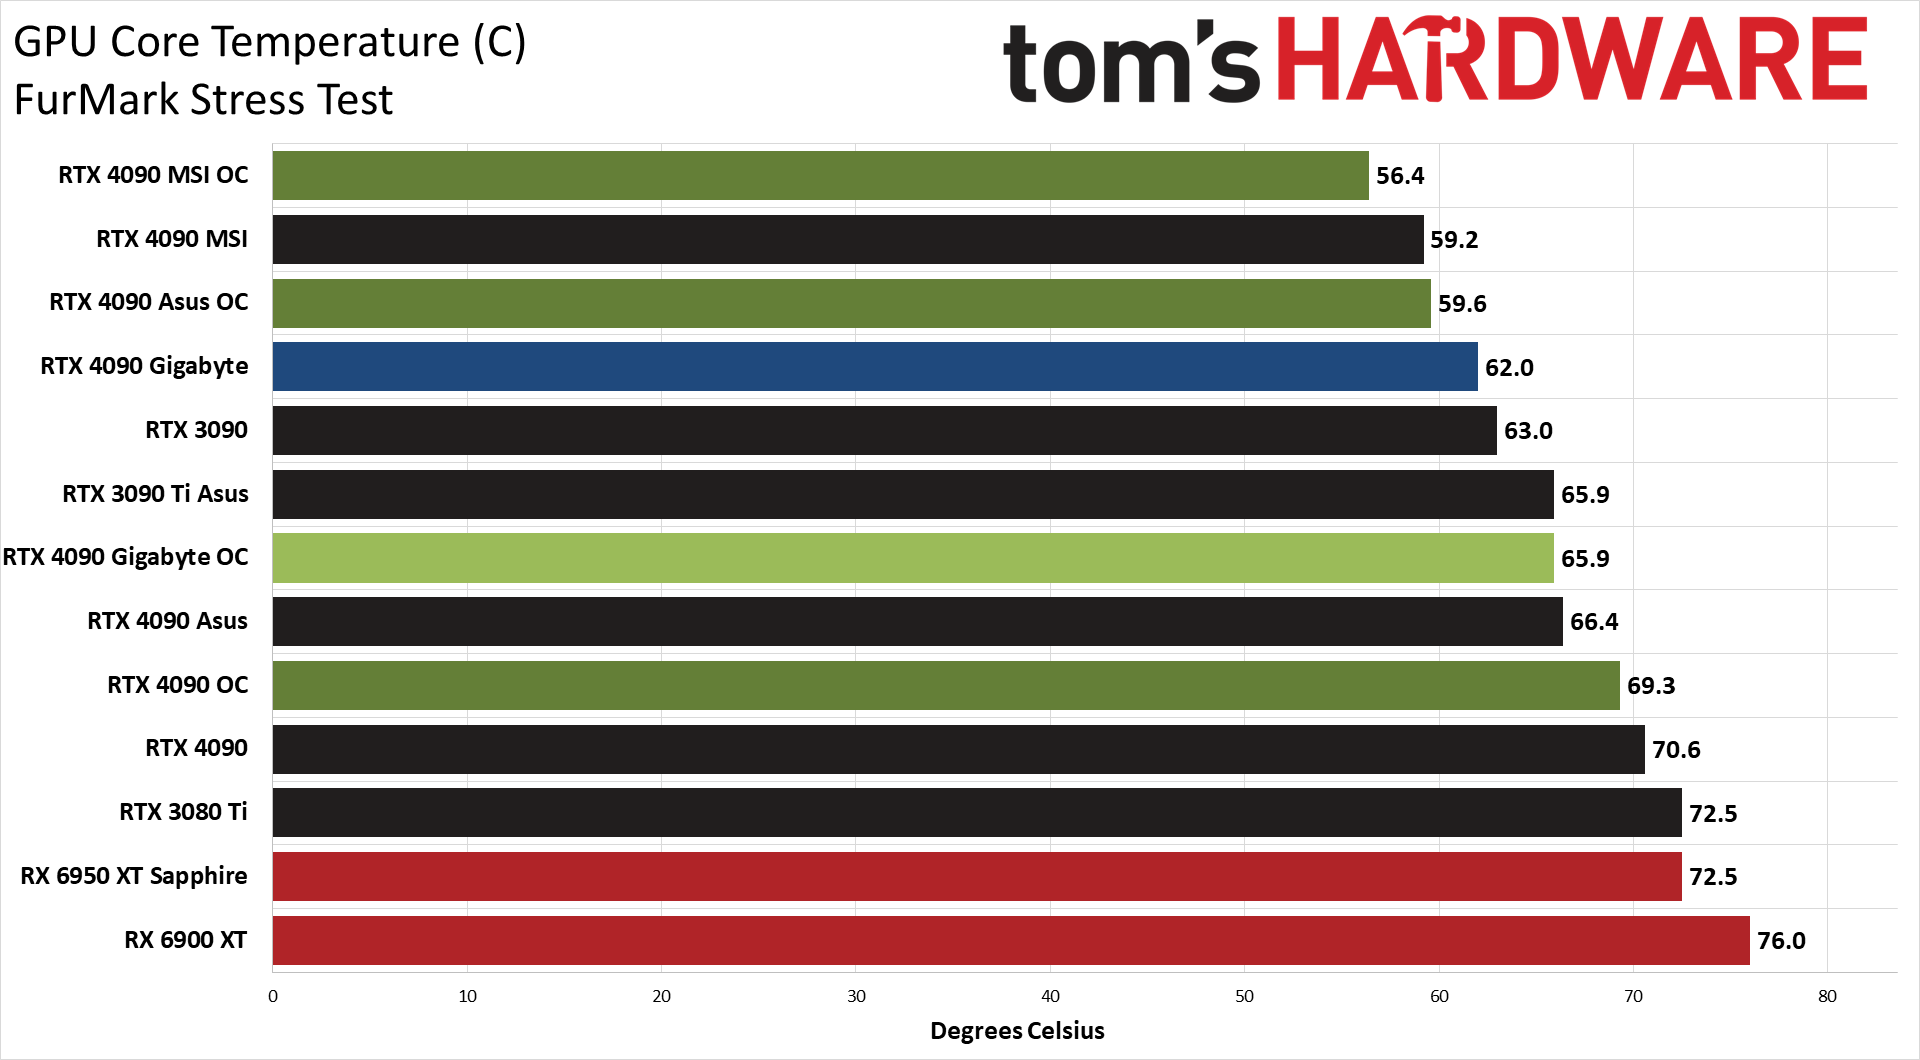
The Gigabyte RTX 4090 uses a bit less power than the reference card in Metro Exodus and FurMark, at least at stock settings. It's a 17W difference in FurMark and just 3W in Metro, but this does perhaps partly explain the slightly lower performance we saw at times with stock settings on the Gigabyte card. Overclocked, things swing the other direction, with Gigabyte drawing more power than the other cards in Metro, though in FurMark the Founders Edition still "wins" by consuming over 600W. Have we mentioned overclocking isn't the best idea for RTX 4090 cards while there's still no explanation for the melting 16-pin adapters?
Clock speeds also match up with what we've seen before: The Gigabyte card averages 12 MHz less than the Founders Edition in Metro, and 86 MHz less in FurMark, where other protections appear to come into effect earlier than on some of the other GPUs. Overclocking mostly levels the playing field, though Gigabyte still comes in at the bottom of the overclocked 4090 grouping.
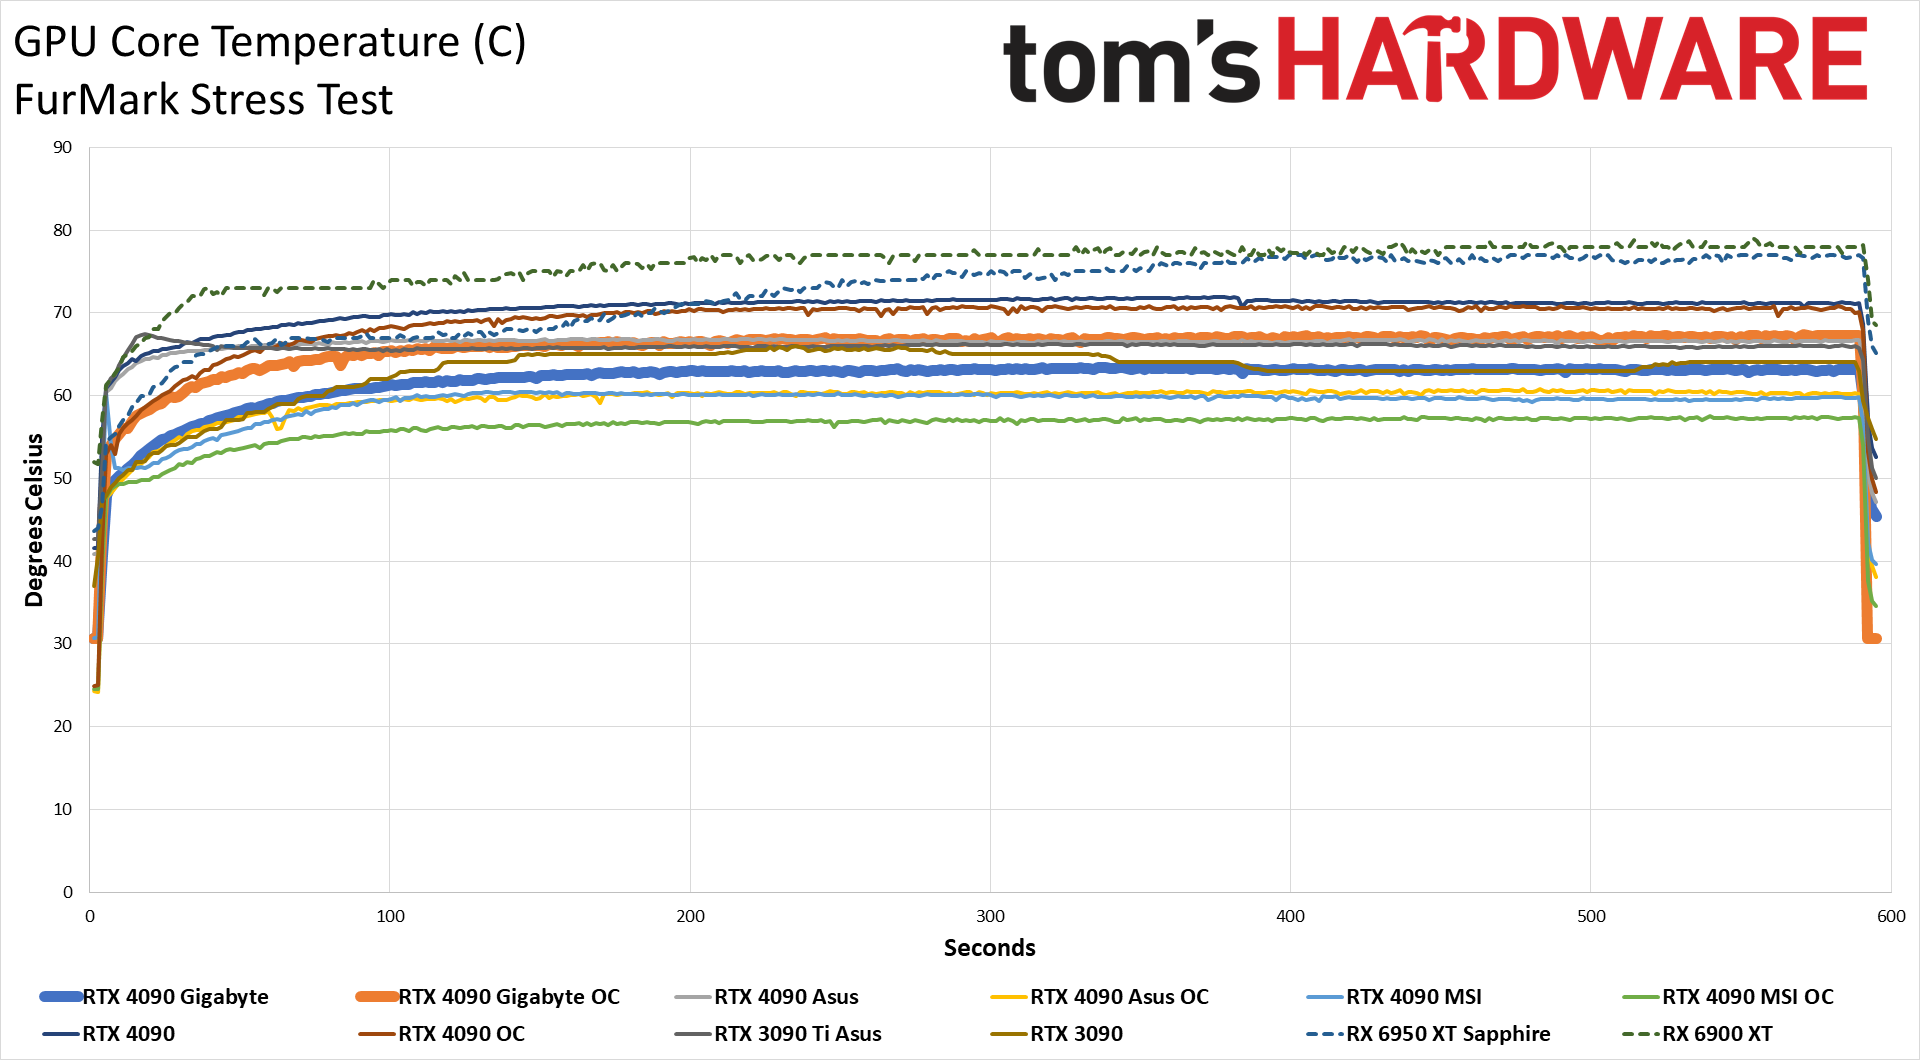
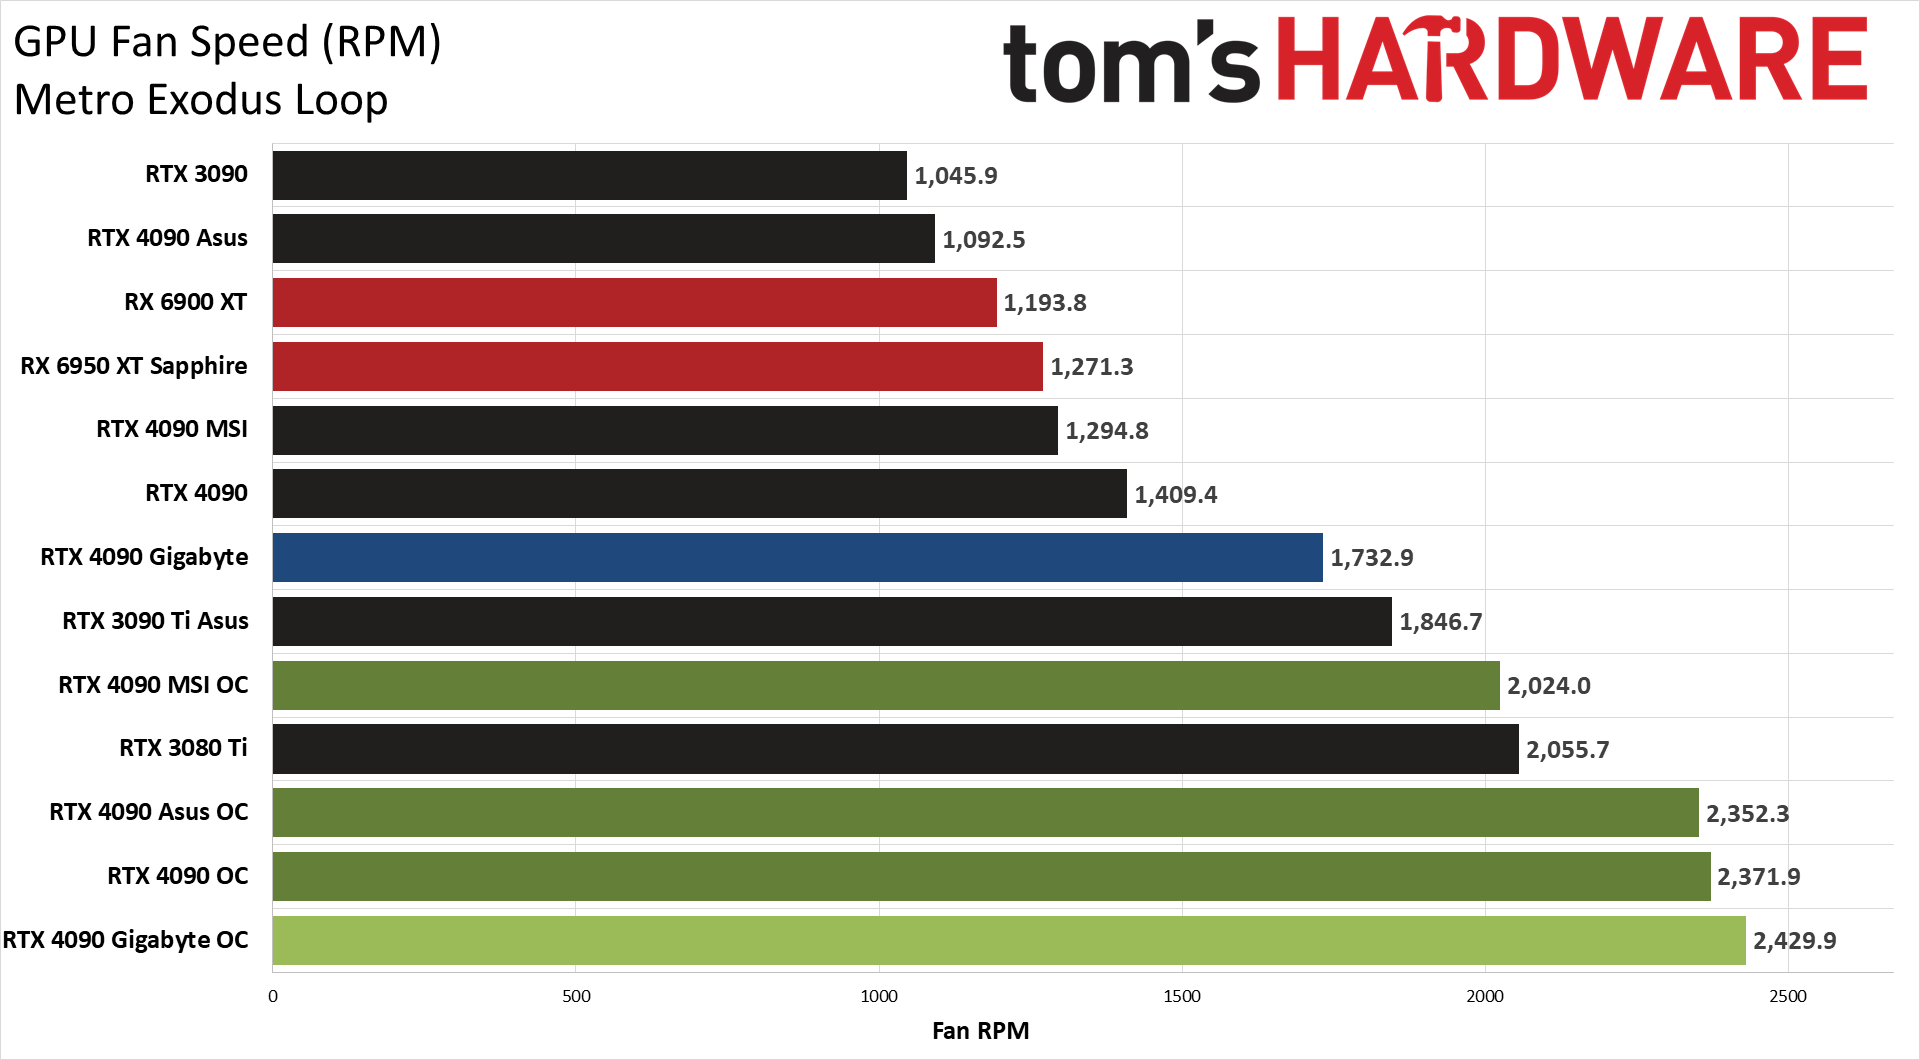
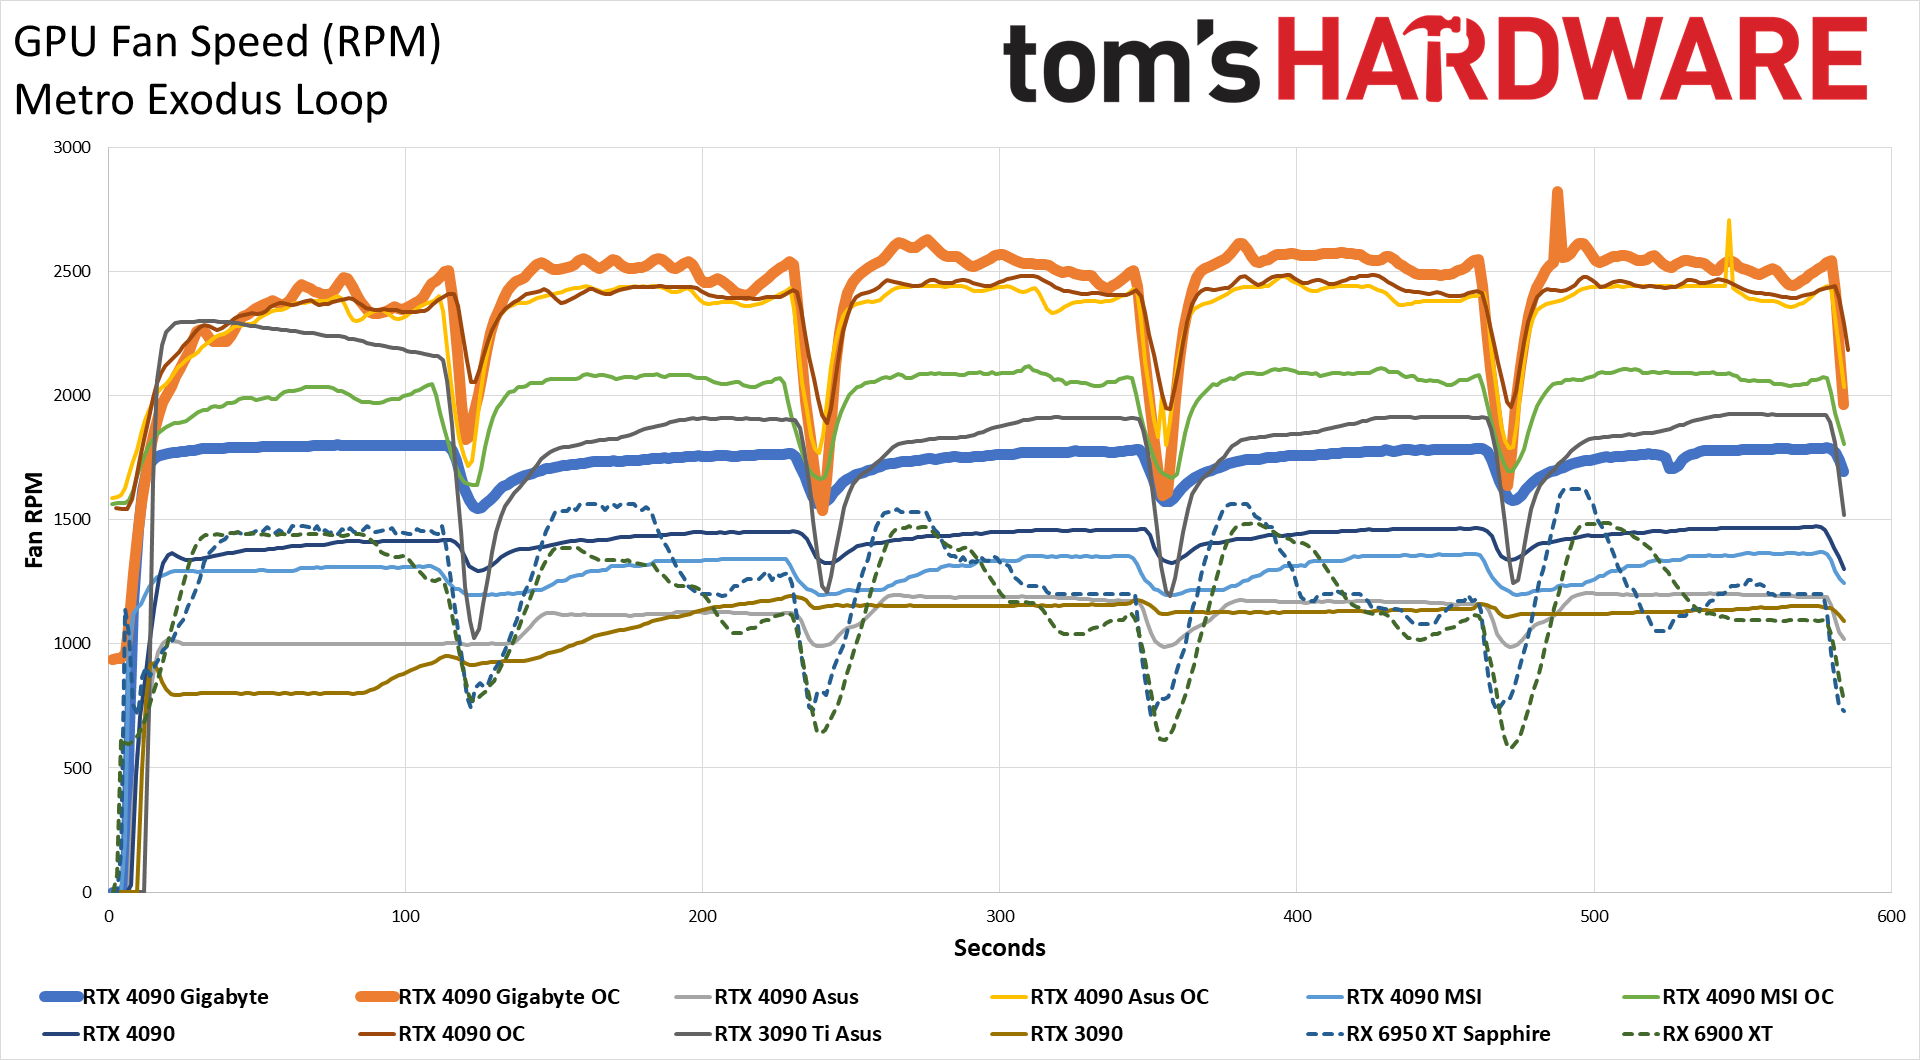
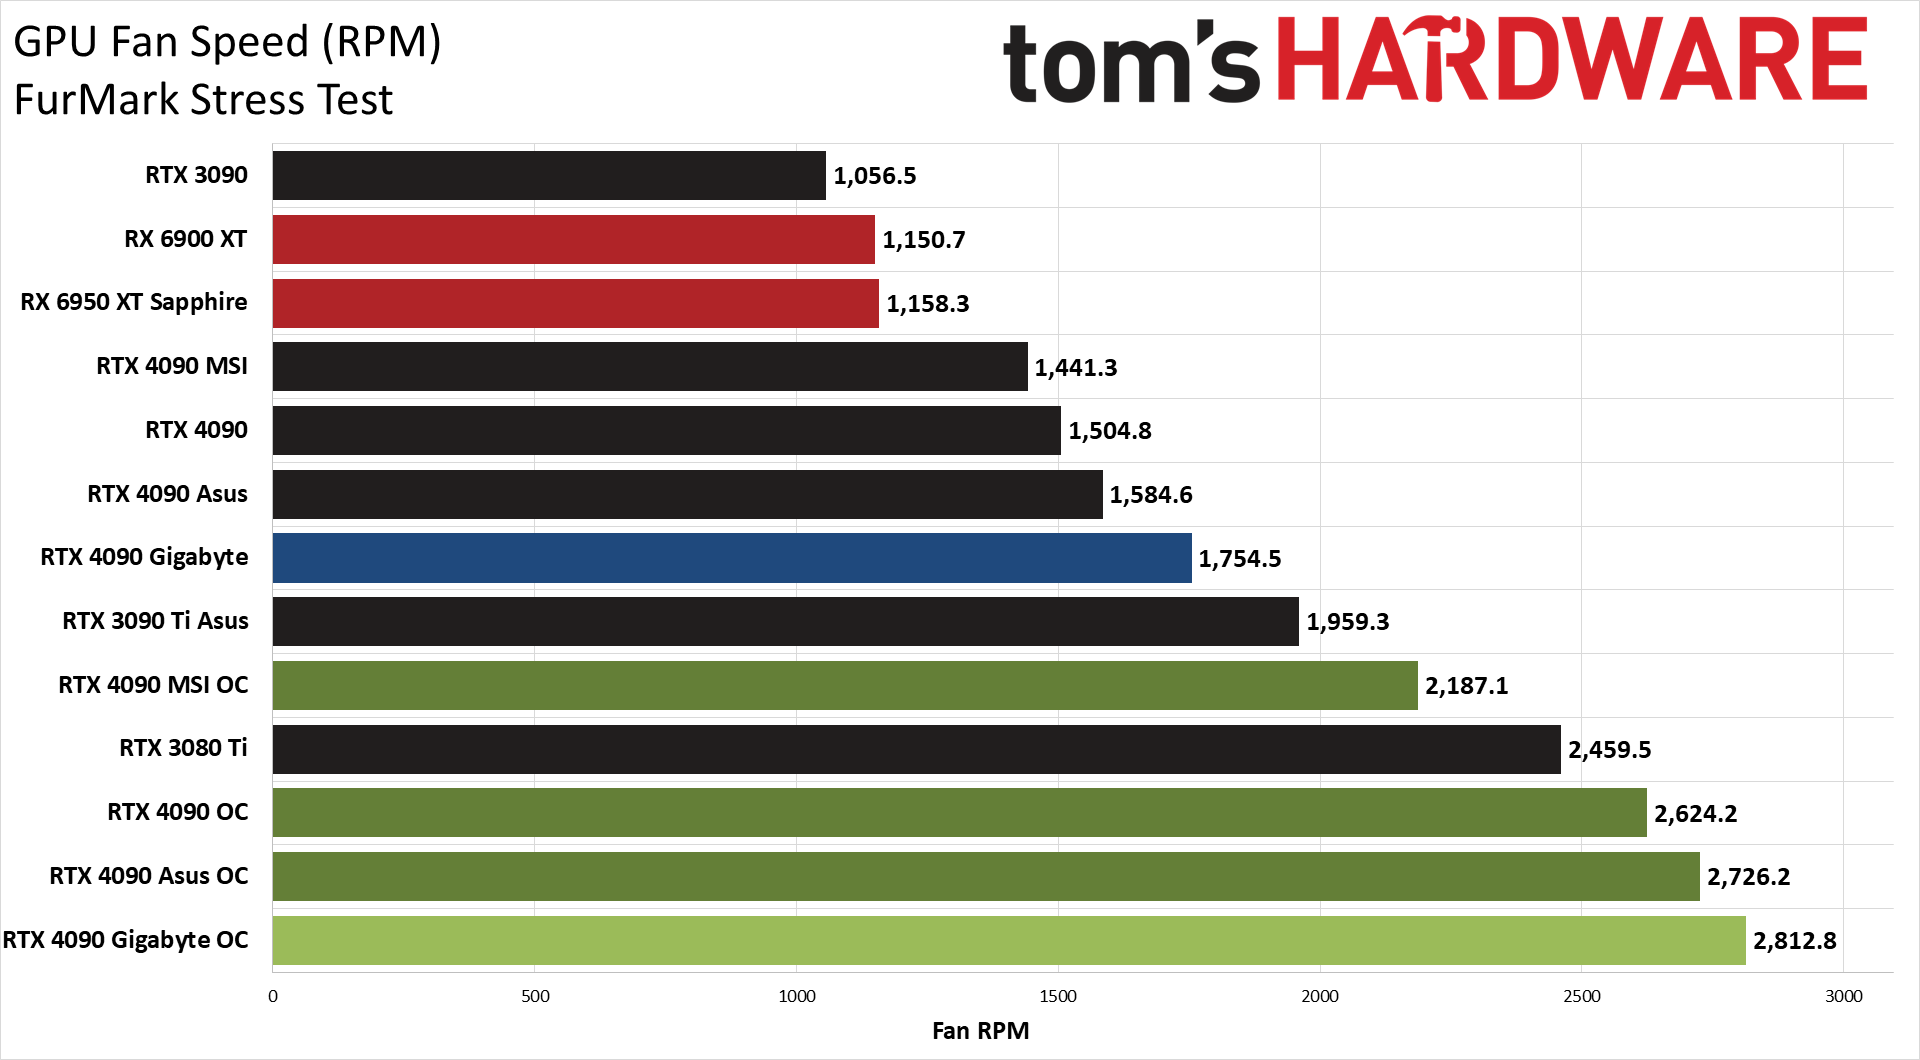
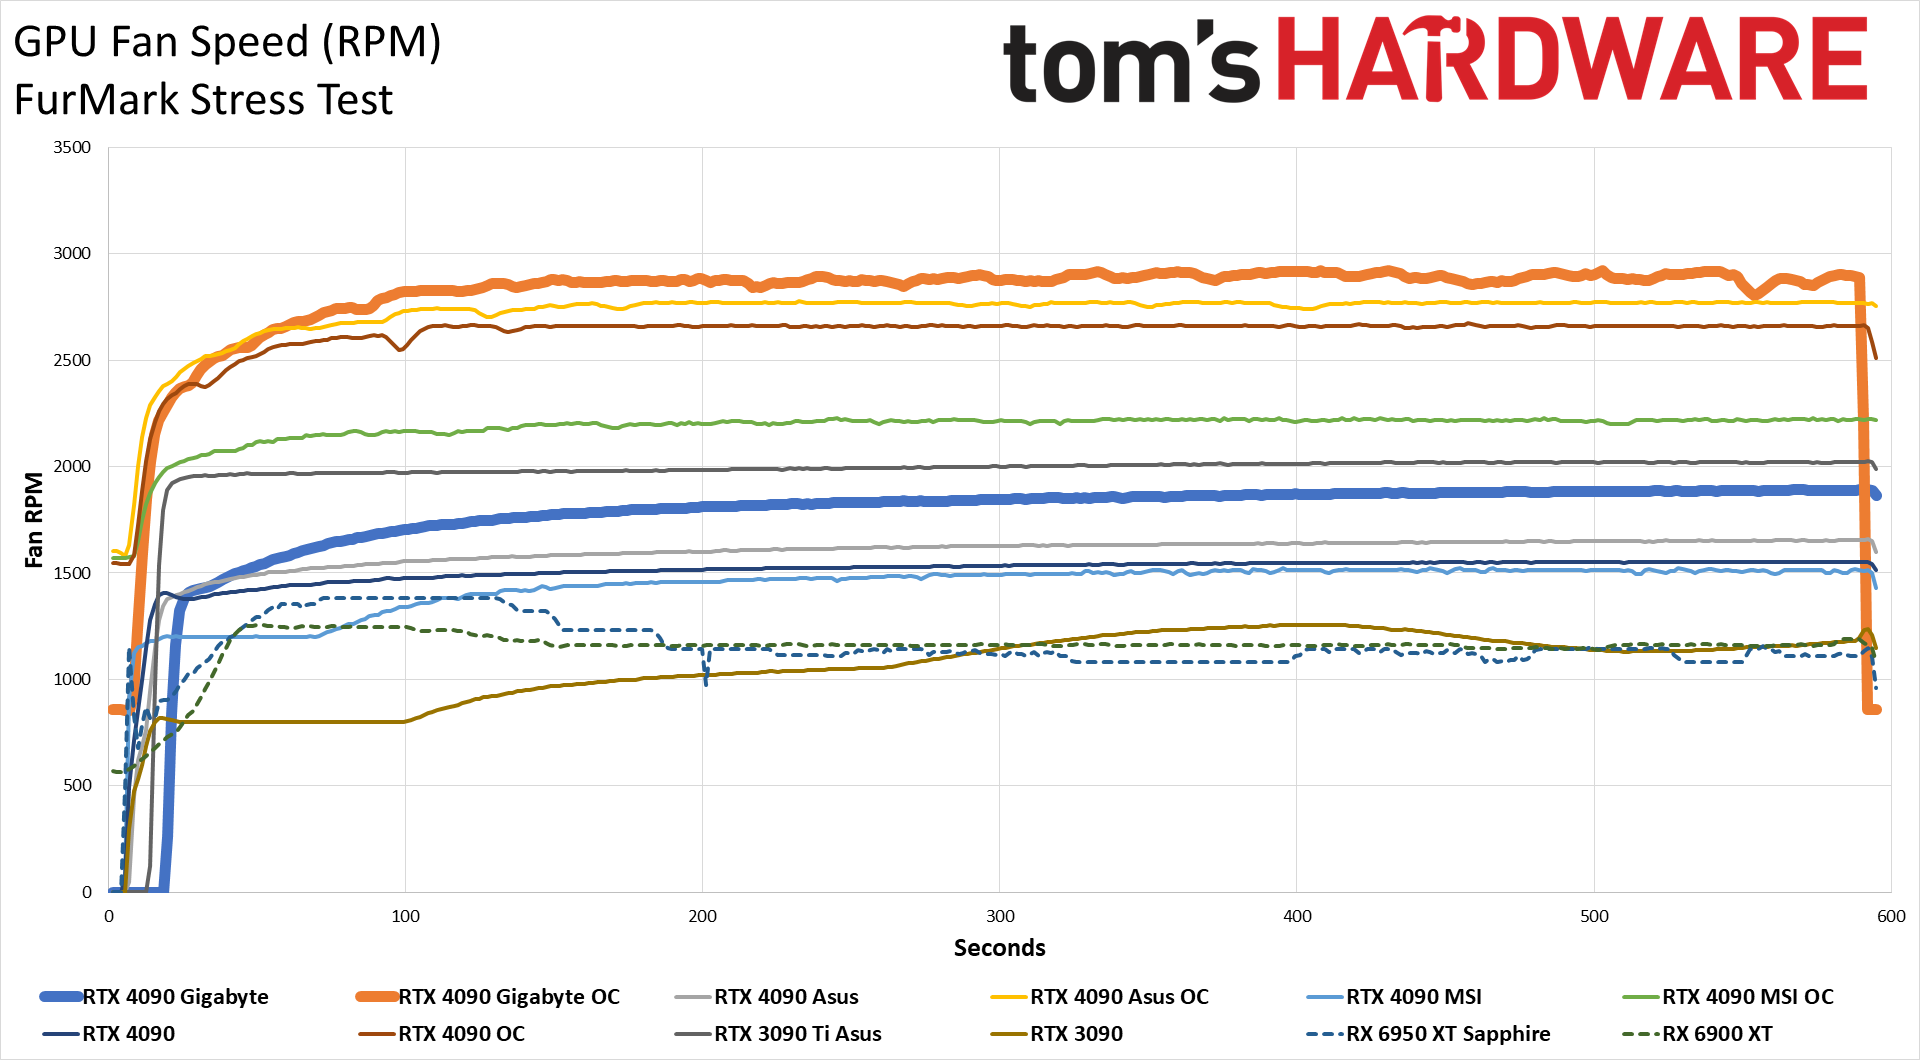
Temperature favors the Gigabyte card over the Founders Edition, though we also need to look at fan speed for additional insight. The takeaway is that Gigabyte appears to prefer lower temps and higher fan speeds over higher temps and lower fan speeds.
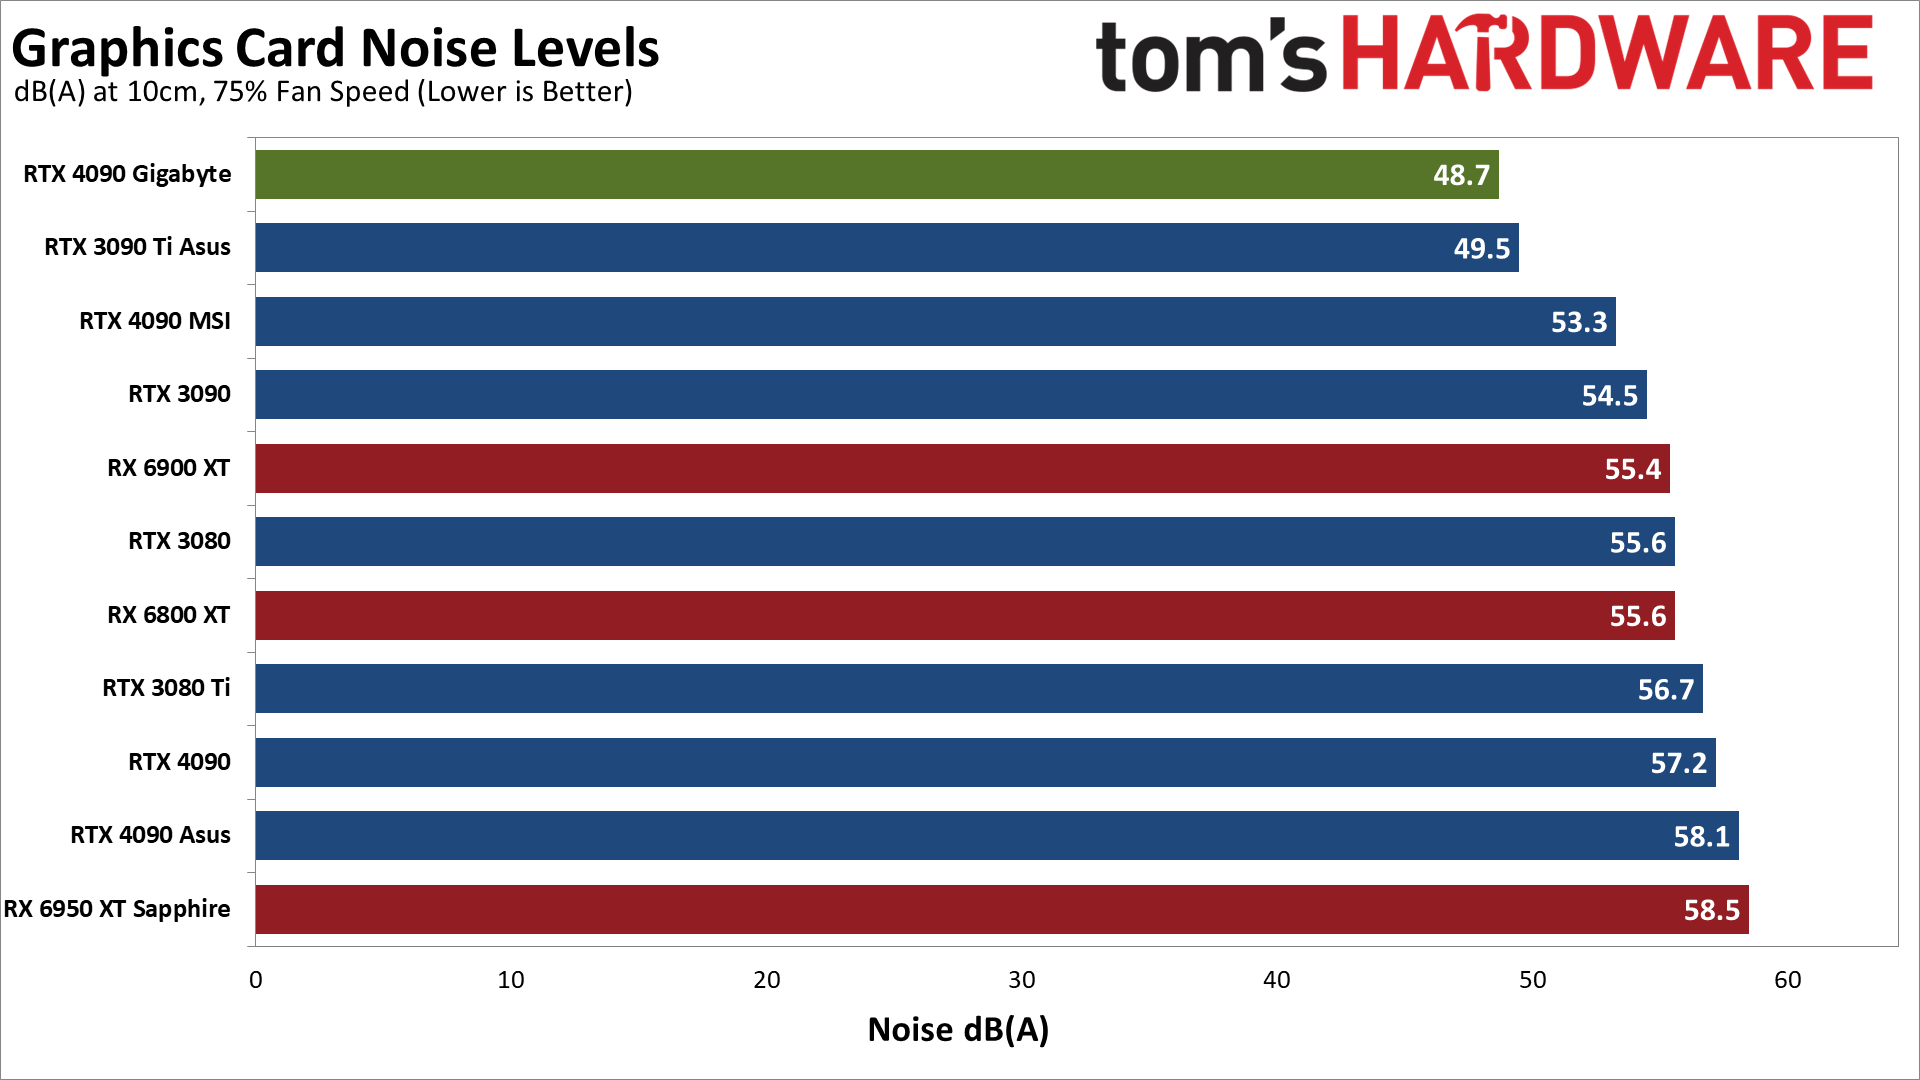
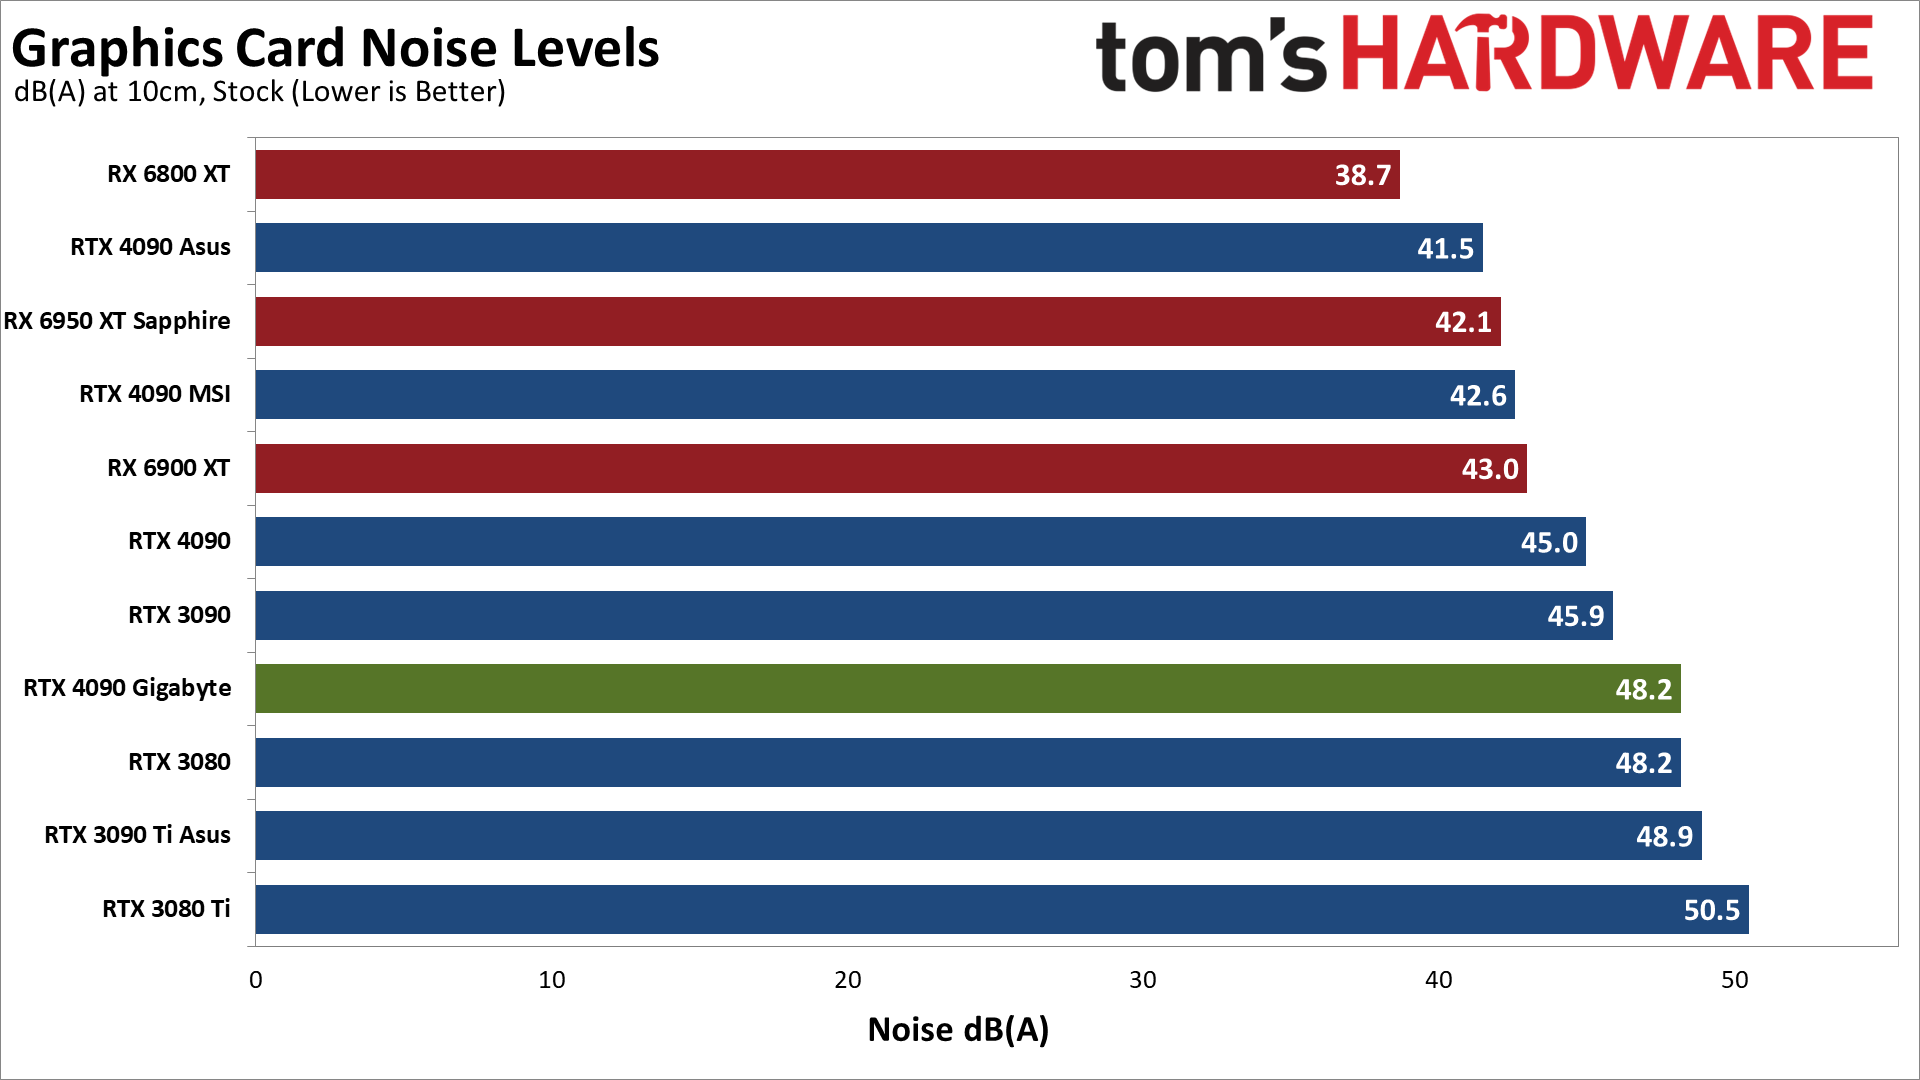
We also use an SPL (sound pressure level) meter for noise testing, positioned about 10cm away from the GPU fans. This is done to focus measurements on the graphics card fans and avoid the influence of other noise sources. Idle noise measured less than 32 dB(A) for all of the cards, which is more or less the limit of our noise floor. We run Metro Exodus for over 15 minutes to let fan speeds stabilize before taking our readings.
The Gigabyte 4090 card ended up at 48.2 dB(A), one of the noisier cards in our charts and louder than any other RTX 4090 we've tested so far. As noted earlier, Gigabyte seems to prefer running higher fan speeds with lower temperatures — not a bad thing, really, unless you're trying to build a nearly silent PC.
We also set a static fan speed of 75%, but that on its own isn't super meaningful. While the chart says "lower is better," you should actually look at both the stock and 75% noise levels. What you'll find with the Gigabyte 4090 is that it's only fractionally louder at 75%. That's because it's running at 74% stock, which means it doesn't have a whole lot of headroom for cooling if it's needed. The Asus 4090 in contrast hits 58.1 dB(A) with a 75% fan speed, but at stock it's only running at 41%, so it can ramp up the fans if necessary.
| Game | Setting | Avg FPS | Avg Clock | Avg Power | Avg Temp | Avg Load |
|---|---|---|---|---|---|---|
| 13-Game Geomean | 1440p 'Ultra' | 126.9 | 2757.2 | 345.3 | 56.9 | 82.80% |
| 13-Game Geomean | 4k 'Ultra' | 83.7 | 2737.5 | 399.4 | 59.6 | 93.10% |
| 6-Game DXR Geomean | 1440p 'Ultra' | 104.3 | 2751.7 | 401 | 59.8 | 90.20% |
| 6-Game DXR Geomean | 4k 'Ultra' | 55.5 | 2715 | 431.5 | 62 | 94.60% |
| 6-Game DXR Geomean OC | 4k 'Ultra' | 59.4 | 2934.4 | 496.2 | 61.7 | 94.30% |
| Borderlands 3 | 1440p Badass | 217.4 | 2760 | 412.5 | 61.5 | 92.70% |
| Borderlands 3 | 4k Badass | 126.3 | 2740.7 | 441.7 | 63.4 | 98.90% |
| Bright Memory Infinite | 1440p Very High | 85.9 | 2758.6 | 421.7 | 62.3 | 99.00% |
| Bright Memory Infinite | 4k Very High | 40.4 | 2730 | 436.3 | 63.5 | 99.00% |
| Bright Memory Infinite OC | 4k Very High | 43.6 | 2940 | 495.8 | 61.8 | 99.00% |
| Control | 1440p High | 135.9 | 2759 | 437.3 | 58.4 | 98.90% |
| Control | 4k High | 67.6 | 2718.4 | 445.2 | 61.3 | 99.00% |
| Control OC | 4k High | 73 | 2940 | 507.4 | 58 | 99.00% |
| Cyberpunk 2077 | 1440p RT-Ultra | 85.2 | 2758.6 | 407.5 | 59.2 | 95.60% |
| Cyberpunk 2077 | 4k RT-Ultra | 43.9 | 2706.8 | 435.7 | 60.9 | 97.30% |
| Cyberpunk 2077 OC | 4k RT-Ultra | 46 | 2940 | 504.6 | 61.9 | 97.20% |
| Far Cry 6 | 1440p Ultra | 151.7 | 2760 | 232.6 | 51.1 | 65.70% |
| Far Cry 6 | 4k Ultra | 132.4 | 2760 | 335.1 | 54.2 | 94.40% |
| Flight Simulator | 1440p Ultra | 76.9 | 2760 | 353.7 | 57.2 | 71.10% |
| Flight Simulator | 4k Ultra | 76.3 | 2760 | 347.1 | 55.2 | 70.90% |
| Fortnite | 1440p Epic | 104 | 2745 | 385.4 | 60.9 | 93.80% |
| Fortnite | 4k Epic | 53 | 2735.2 | 414.8 | 62.2 | 95.50% |
| Fortnite OC | 4k Epic | 57.5 | 2925 | 480.9 | 63.8 | 95.40% |
| Forza Horizon 5 | 1440p Extreme | 172.6 | 2769.8 | 251.1 | 50.2 | 82.60% |
| Forza Horizon 5 | 4k Extreme | 148.7 | 2760 | 314.9 | 55.5 | 92.70% |
| Horizon Zero Dawn | 1440p Ultimate | 179.1 | 2760.6 | 256.7 | 51.9 | 65.70% |
| Horizon Zero Dawn | 4k Ultimate | 153.9 | 2758 | 382.1 | 58.5 | 94.70% |
| Metro Exodus Enhanced | 1440p Extreme | 116 | 2729 | 418.7 | 61.4 | 92.60% |
| Metro Exodus Enhanced | 4k Extreme | 74.1 | 2651.8 | 444.5 | 63 | 98.60% |
| Metro Exodus Enhanced OC | 4k Extreme | 79.7 | 2921.7 | 542.5 | 65.7 | 98.30% |
| Minecraft | 1440p RT 24-Blocks | 107.5 | 2760 | 342.8 | 56.8 | 66.40% |
| Minecraft | 4k RT 24-Blocks | 62.1 | 2748.8 | 413.6 | 61.2 | 80.00% |
| Minecraft OC | 4k RT 24-Blocks | 65.6 | 2940 | 450.9 | 59.1 | 78.60% |
| Total War Warhammer 3 | 1440p Ultra | 166.5 | 2760 | 395.9 | 59.8 | 94.40% |
| Total War Warhammer 3 | 4k Ultra | 103.7 | 2759.8 | 424.5 | 61.1 | 98.30% |
| Watch Dogs Legion | 1440p Ultra | 131.1 | 2763.4 | 275.2 | 50.8 | 71.80% |
| Watch Dogs Legion | 4k Ultra | 112.6 | 2760.3 | 388.5 | 55.4 | 96.70% |
Besides the Powenetics testing, we also collected temperature, power, and clock speed data (via Nvidia FrameView) for most of our benchmarks — "most" because FrameView causes Red Dead Redemption 2 Vulkan to crash to desktop. These are the results from the test runs used in our charts.
For the full suite of 13 games, the Gigabyte card averaged about 2.76 GHz at 1440p and 2.74 GHz at 4K. Note that GPU utilization at 1440p only averaged 83%, compared to 93% at 4K. Limiting things to just the DXR test suite, where we also overclock the cards, 1440p averaged 2.75 GHz with 90% average load, compared to 2.72 GHz and 95% load. Overclocking at 4K bumped that up to 2.93 GHz, still at 94% load, with 7% higher overall performance
Look at the power data as well, where Metro Exodus Enhanced proves to be the most demanding of the games we tested — going by the overclocked power use. DXR games in general used quite a bit more power, while Flight Simulator and Forza Horizon 5 were the least demanding as far as power use goes.
- MORE: Best Graphics Cards
- MORE: GPU Benchmarks and Hierarchy
- MORE: All Graphics Content
Get Tom's Hardware's best news and in-depth reviews, straight to your inbox.
Current page: Gigabyte RTX 4090 Gaming OC: Power, Temps, Noise, Etc.
Prev Page Gigabyte RTX 4090 Gaming OC: Gaming Performance Next Page Gigabyte RTX 4090 Gaming OC: Basically a Reference Card
Jarred Walton is a senior editor at Tom's Hardware focusing on everything GPU. He has been working as a tech journalist since 2004, writing for AnandTech, Maximum PC, and PC Gamer. From the first S3 Virge '3D decelerators' to today's GPUs, Jarred keeps up with all the latest graphics trends and is the one to ask about game performance.
-
cknobman Between pricing, power, things melting I want nothing to do with this gen of Nvidia cards.Reply
I'll wait to see what AMD has and if they suck too then I will just wait for next gen or pricing to drop like a rock. -
Roland Of Gilead Replycknobman said:Between pricing, power, things melting I want nothing to do with this gen of Nvidia cards.
I'll wait to see what AMD has and if they suck too then I will just wait for next gen or pricing to drop like a rock.
Have to agree with you! This chase for max performance is not something I'm interested in. Same with current gen CPU's. Too much power draw.
It's almost cyclical. A good few years ago, power requirements went up dramatically for both GPU's and CPU's, and then dialled back a little with more efficient designs. Seems like we're here again. Hopefully the next gen or two will dial back power consumption to more reasonable levels, while maintaining a decent leap in performance over the previous gen. Specially where we are right now in a global sense, cost of living, utilities, and an ever-worsening climate situation. Electricity/Gas costs a bomb here in Europe. These GPU's just don't make sense for most people. -
RodroX @JarredWaltonGPU with the melting adapter and native cables issues, you Sir are a very brave man to go ahead and OC one of this beasts!Reply -
mrv_co I guess I'm glad these cards exist and continue to push the performance envelope, but I just never made the mental leap to need or want a 'flagship' GPU (much less an even larger case and even more power hungry power supply)... especially since, having had full-tower and mid-tower cases over the years, I transitioned to a SFF case that is cool, quiet and fits neatly under my desk, while realizing that I'm perfectly happy with my ultra wide QHD display.Reply -
JarredWaltonGPU Reply
What's the worst that can happen? It's not like I leave the PC running and walk away for hours. If it melts, that would be sort of awesome and I could do an article on how I caused a 4090 to melt! LOLRodroX said:@JarredWaltonGPU with the melting adapter and native cables issues, you Sir are a very brave man to go ahead and OC one of this beasts!
I still suspect there's a better than reasonable chance Jonny Guru is right and that a few people didn't properly insert the connector. There's a lot of current running through there. Manufacturing defects are the only other real possibility. Given we never heard of people melting RTX 3090 or 3090 Ti 12-pin connections, and that the extra four sense pins make it a bit more difficult to fully insert the 16-pin connector, that seems the most likely option.
But until we have some official statement of cause and cure, it really muddies the RTX 40-series waters! -
junglist724 Reply
I've been sticking flagship CPUs and GPUs into SFF cases for a couple generations now. The 4090FE still fits into some SFF cases and should work well in ones that take good advantage of flow through coolers. The C4-SFX(if it ever actually releases) looks like it would work well even in an air cooled build with a 7950X/13900K + 4090FE. Use an SX1000 PSU plus a 90 or 180 degree 12VHPWR adapter and powering it should be fine.mrv_co said:I guess I'm glad these cards exist and continue to push the performance envelope, but I just never made the mental leap to need or want a 'flagship' GPU (much less an even larger case and even more power hungry power supply)... especially since, having had full-tower and mid-tower cases over the years, I transitioned to a SFF case that is cool, quiet and fits neatly under my desk, while realizing that I'm perfectly happy with my ultra wide QHD display. -
Neilbob Trying hard ... not ... to be ... grumpy old ... misery guts ... ack ...Reply
Subjective: Quantity and/or quality of RGB a matter of total irrelevance to some people.
Pained gasping for breath
(Has no intention of ever letting one of these near the electricity bills. Not sure why the need was felt to comment at all).
