Why you can trust Tom's Hardware
Advanced Transient Response Tests
For details about our transient response testing, please click here.
In the real world, power supplies are always working with loads that change. It's of immense importance for the PSU to keep its rails within the ATX specification's defined ranges. The smaller the deviations, the more stable your PC will be with less stress applied to its components.
We should note that the ATX spec requires capacitive loading during the transient rests, but in our methodology, we also choose to apply a worst case scenario with no additional capacitance on the rails.
Advanced Transient Response at 20% – 20ms
| Voltage | Before | After | Change | Pass/Fail |
| 12V | 12.137V | 11.953V | 1.51% | Pass |
| 5V | 5.040V | 4.949V | 1.81% | Pass |
| 3.3V | 3.327V | 3.182V | 4.36% | Pass |
| 5VSB | 5.075V | 5.029V | 0.90% | Pass |
Advanced Transient Response at 20% – 10ms
| Voltage | Before | After | Change | Pass/Fail |
| 12V | 12.139V | 11.968V | 1.40% | Pass |
| 5V | 5.040V | 4.938V | 2.02% | Pass |
| 3.3V | 3.327V | 3.185V | 4.26% | Pass |
| 5VSB | 5.075V | 5.015V | 1.18% | Pass |
Advanced Transient Response at 20% – 1ms
| Voltage | Before | After | Change | Pass/Fail |
| 12V | 12.140V | 11.957V | 1.51% | Pass |
| 5V | 5.041V | 4.938V | 2.04% | Pass |
| 3.3V | 3.328V | 3.196V | 3.96% | Pass |
| 5VSB | 5.075V | 5.026V | 0.97% | Pass |
Advanced Transient Response at 50% – 20ms
| Voltage | Before | After | Change | Pass/Fail |
| 12V | 12.107V | 11.991V | 0.96% | Pass |
| 5V | 5.027V | 4.933V | 1.86% | Pass |
| 3.3V | 3.316V | 3.165V | 4.54% | Pass |
| 5VSB | 5.034V | 4.989V | 0.89% | Pass |
Advanced Transient Response at 50% – 10ms
| Voltage | Before | After | Change | Pass/Fail |
| 12V | 12.108V | 12.007V | 0.83% | Pass |
| 5V | 5.028V | 4.924V | 2.06% | Pass |
| 3.3V | 3.316V | 3.168V | 4.46% | Pass |
| 5VSB | 5.034V | 4.972V | 1.23% | Pass |
Advanced Transient Response at 50% – 1ms
| Voltage | Before | After | Change | Pass/Fail |
| 12V | 12.109V | 11.999V | 0.90% | Pass |
| 5V | 5.028V | 4.926V | 2.03% | Pass |
| 3.3V | 3.316V | 3.178V | 4.15% | Pass |
| 5VSB | 5.034V | 4.983V | 1.02% | Pass |
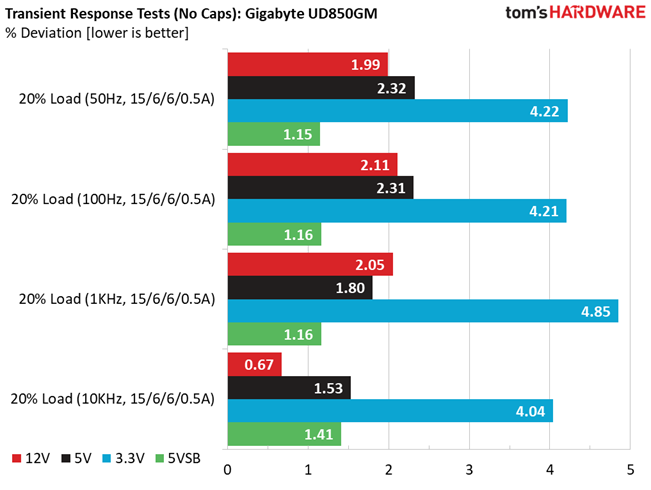
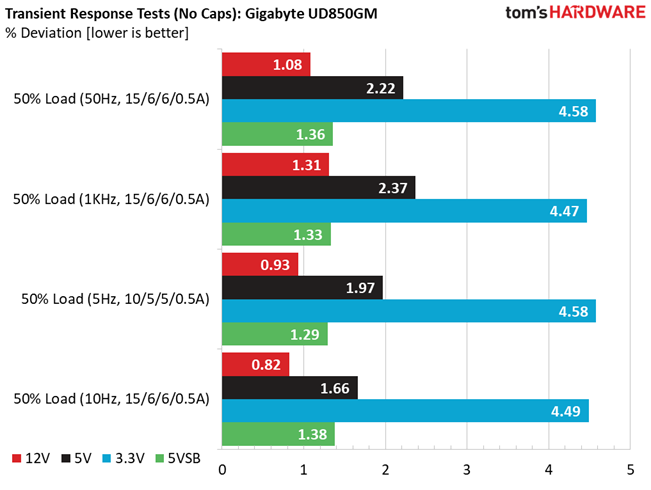
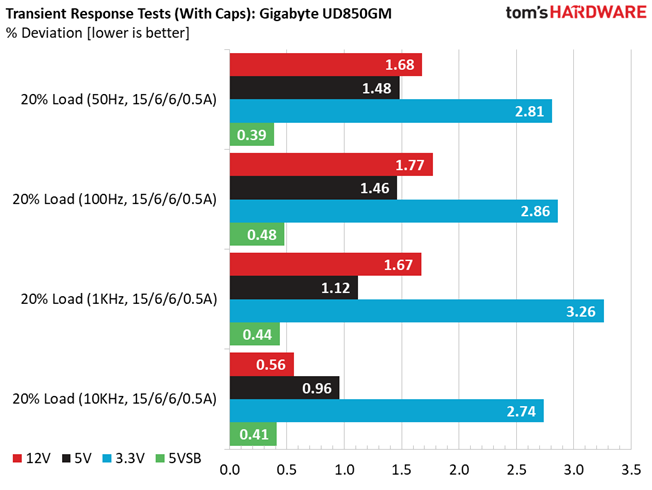
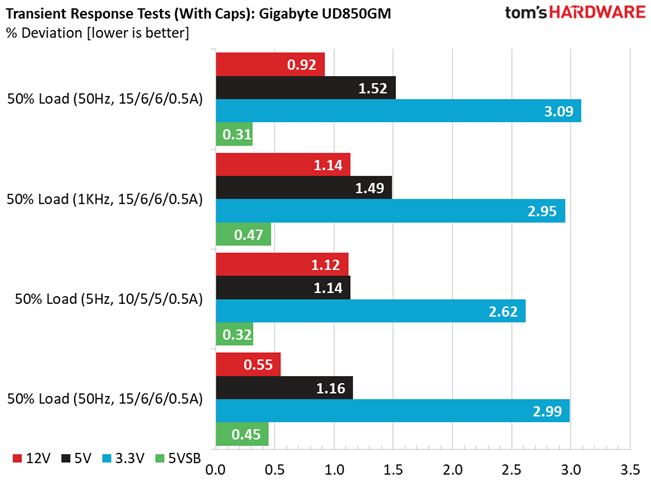
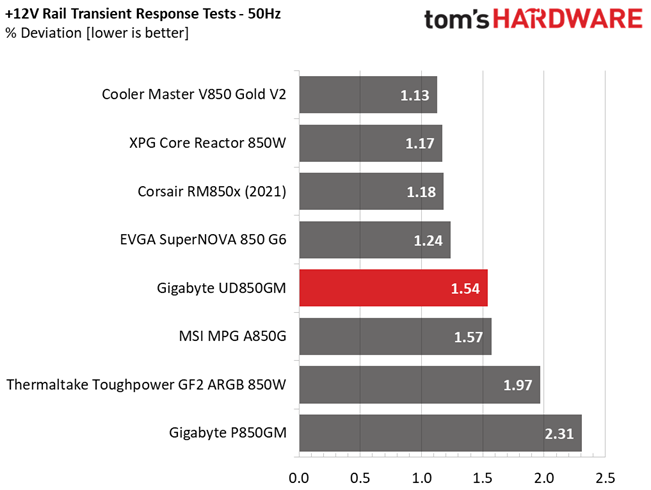
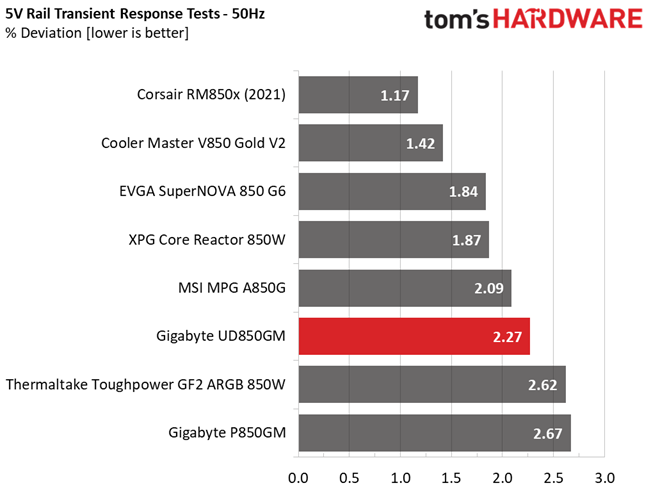
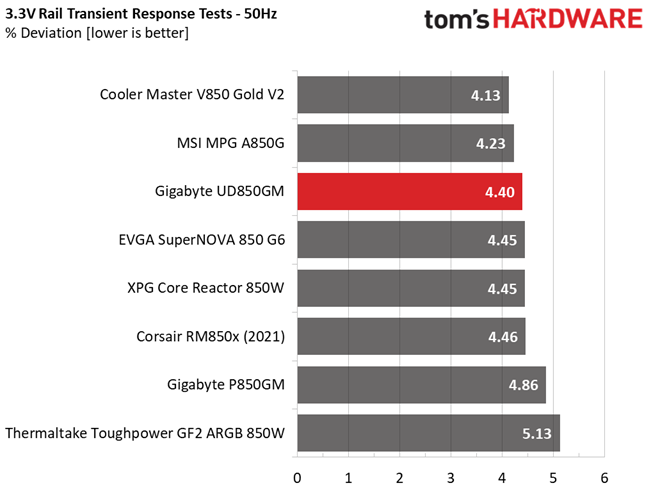
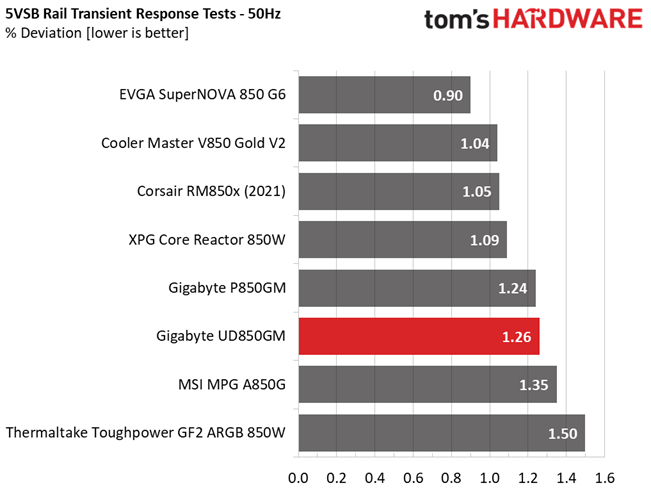
The transient response is decent on all rails. At 3.3V, the deviations are not among the highest in this category. Still, voltage drops below 3.2V in all tests.
Turn-On Transient Tests
In the next set of tests, we measure the PSU's response in simpler transient load scenarios—during its power-on phase. Ideally, we don't want to see any voltage overshoots or spikes since those stress the DC-DC converters of installed components.
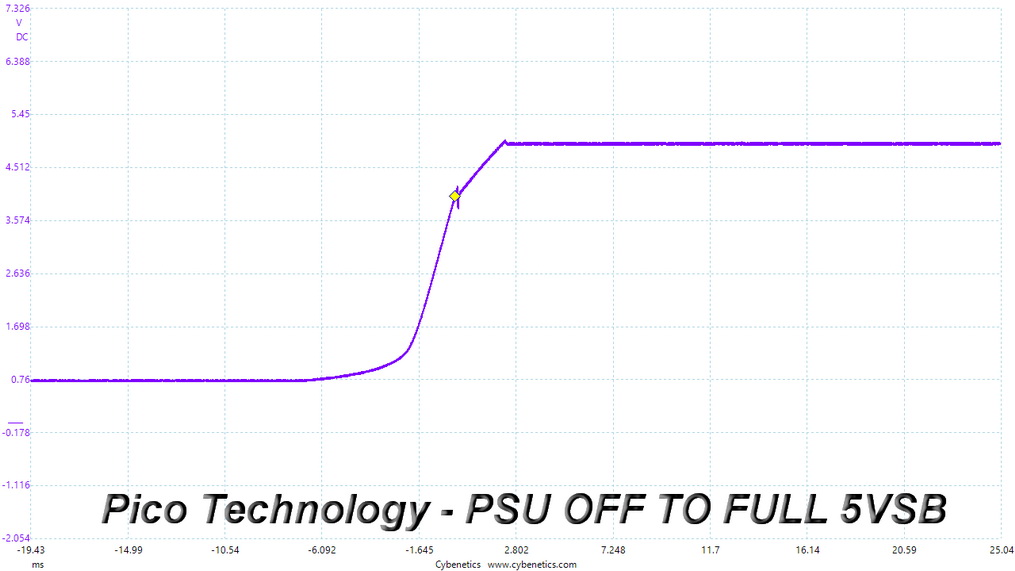
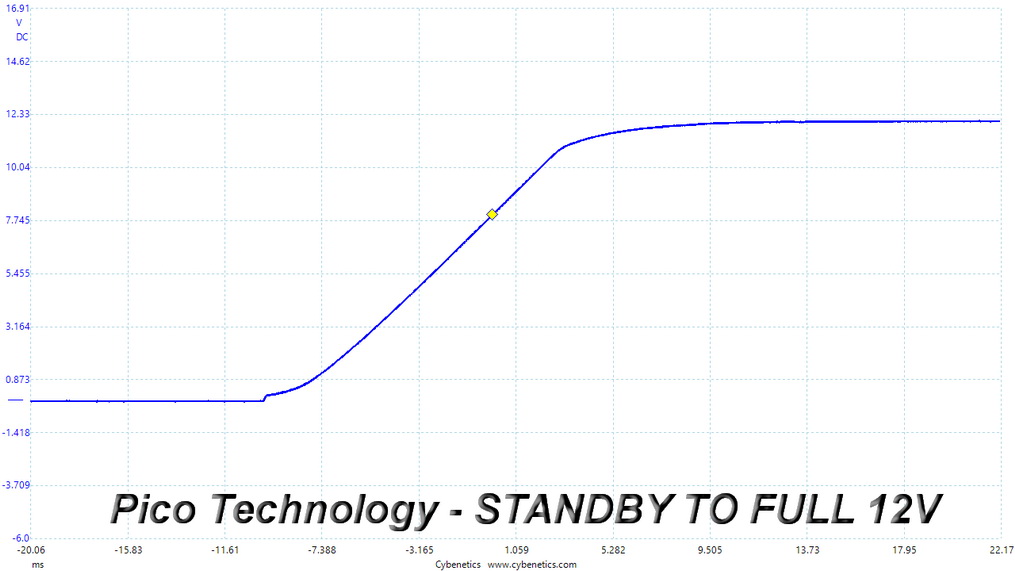
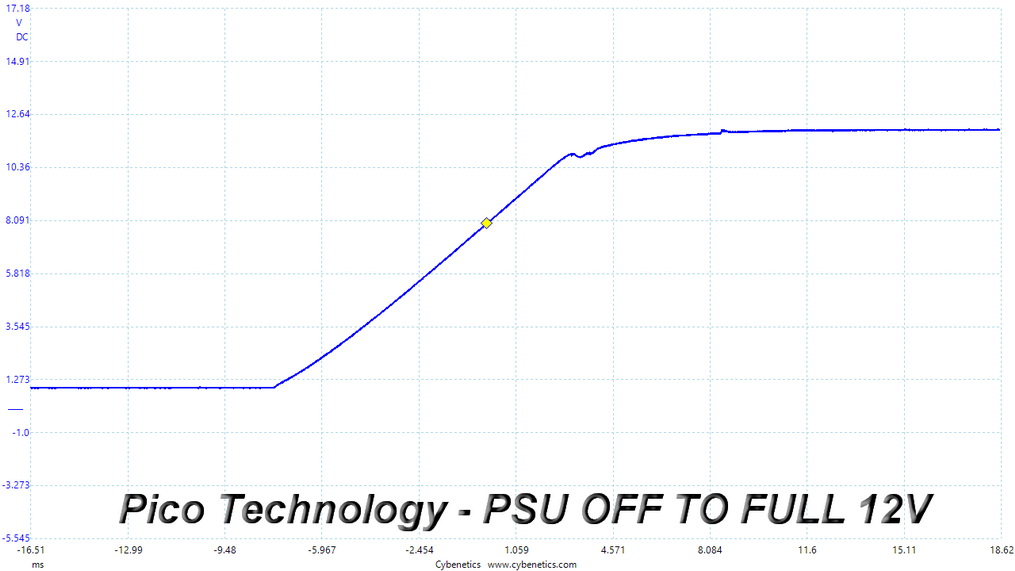
The turn-on transient response is good.
Power Supply Timing Tests
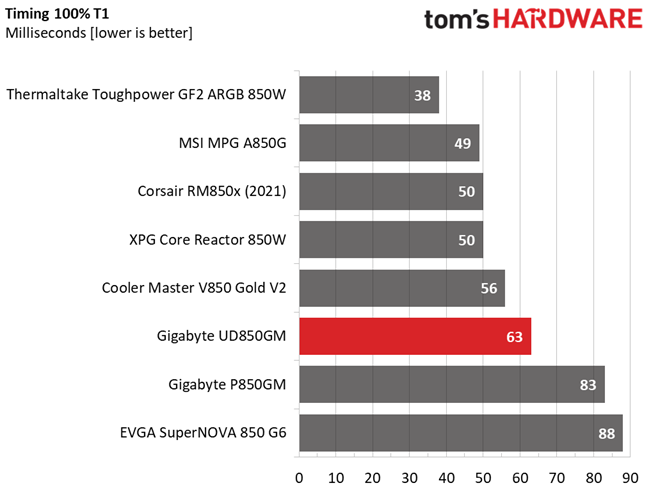
Several signals are generated by the power supply, which need to be within specified ranges for the ATX spec. If they are not, there can be compatibility issues with other system parts, especially mainboards. Since 2020, the PSU's Power-on time (T1) has to be lower than 150ms and the PWR_OK delay (T3) from 100 to 150ms, to be compatible with the Alternative Sleep Mode.
Get Tom's Hardware's best news and in-depth reviews, straight to your inbox.
| T1 (Power-on time) & T3 (PWR_OK delay) | Row 0 - Cell 1 |
| Load | T1 |
| 20% | 63 |
| 100% | 63 |
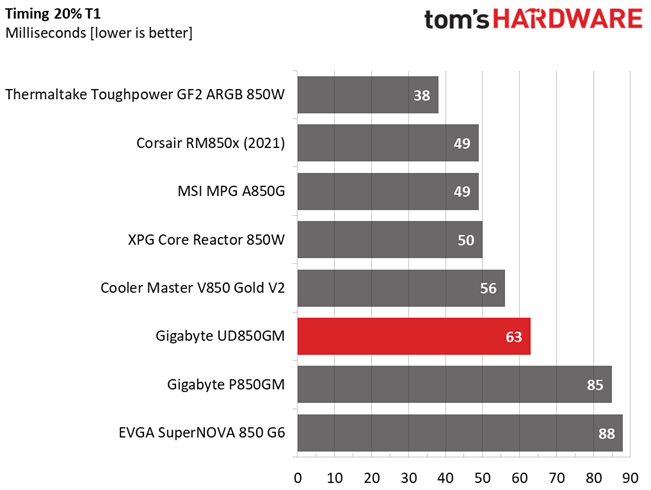
PSU Timing Charts
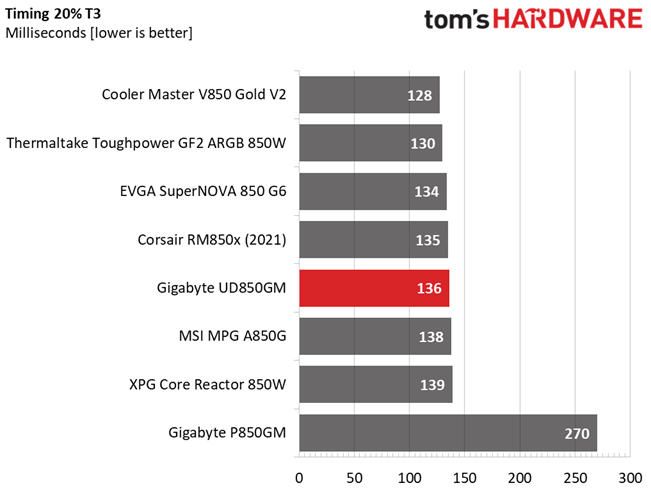
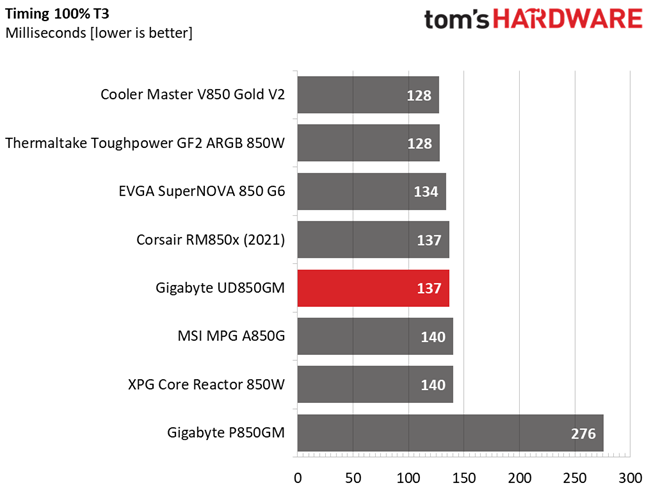
The PWR_OK delay is within the 100-150ms region, so the PSU supports the alternative sleep mode recommended by the ATX spec.
Ripple Measurements
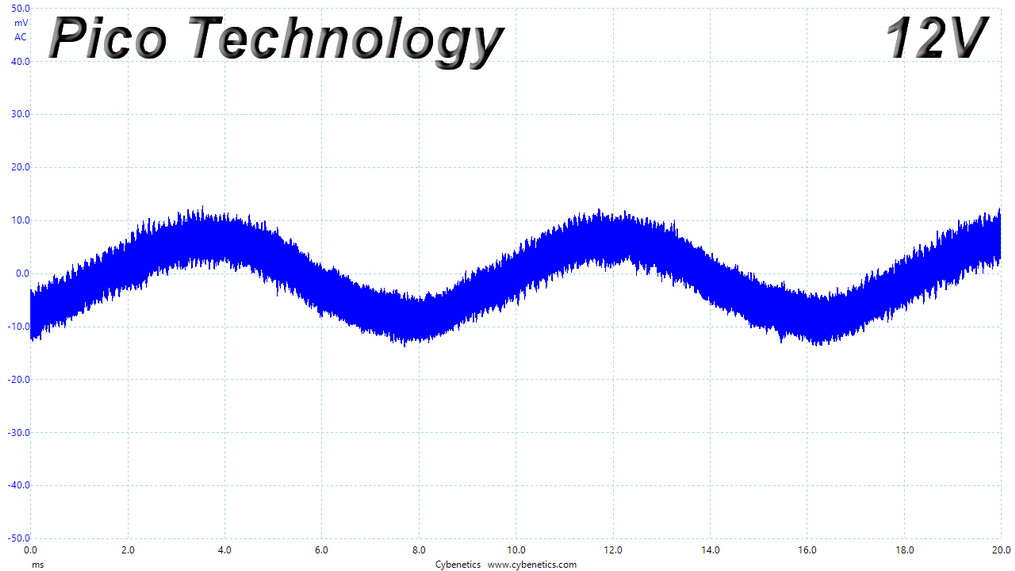
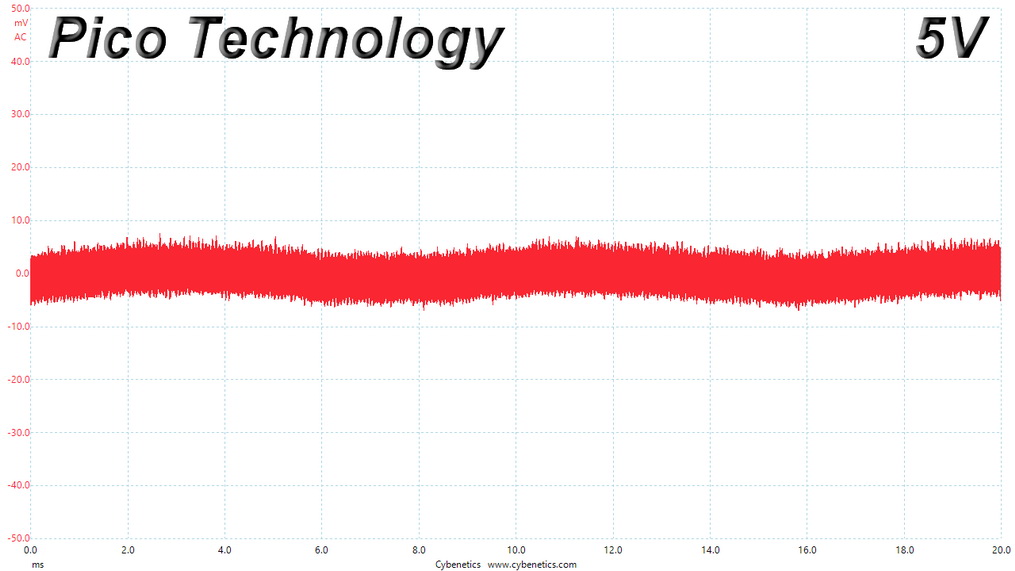
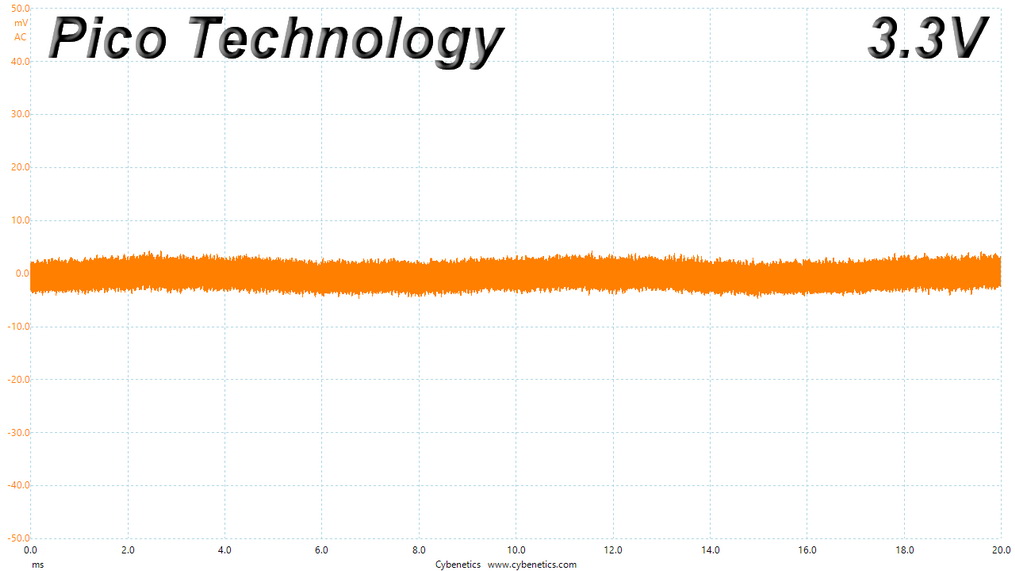
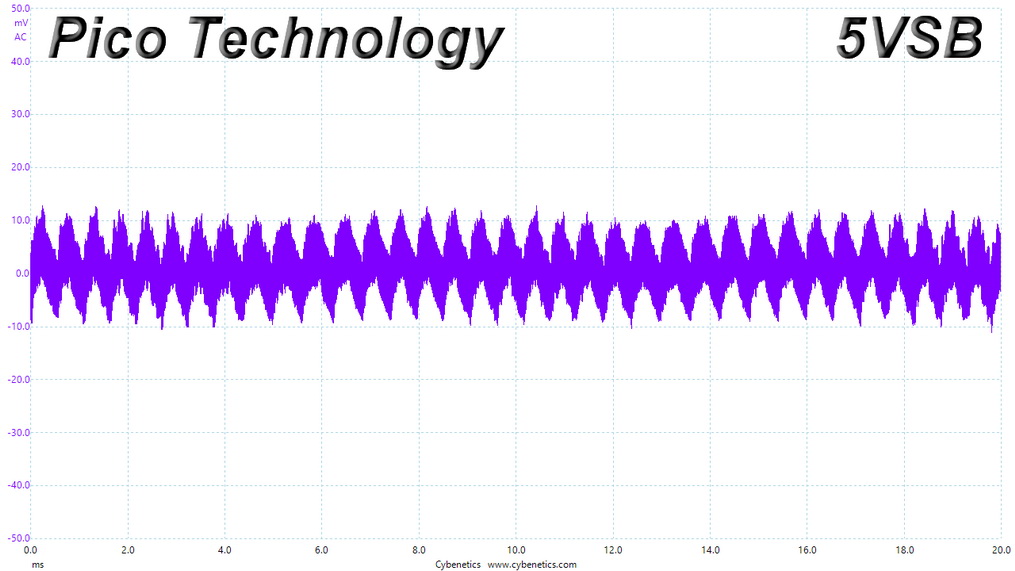
Ripple represents the AC fluctuations (periodic) and noise (random) found in the PSU's DC rails. This phenomenon significantly decreases the capacitors' lifespan because it causes them to run hotter. For example, a 10-degree Celsius increase can reduce a cap's useful life by 50%. Ripple also plays a vital role in overall system stability, especially when overclocking.
According to the ATX specification, the ripple limits are 120mV (+12V) and 50mV (5V, 3.3V, and 5VSB).
| Test | 12V | 5V | 3.3V | 5VSB | Pass/Fail |
| 10% Load | 6.1 mV | 10.2 mV | 7.8 mV | 18.6 mV | Pass |
| 20% Load | 8.2 mV | 11.3 mV | 9.0 mV | 20.0 mV | Pass |
| 30% Load | 21.9 mV | 12.9 mV | 9.4 mV | 21.3 mV | Pass |
| 40% Load | 17.5 mV | 13.0 mV | 10.3 mV | 22.3 mV | Pass |
| 50% Load | 18.1 mV | 14.8 mV | 12.0 mV | 23.4 mV | Pass |
| 60% Load | 18.5 mV | 16.0 mV | 14.3 mV | 23.4 mV | Pass |
| 70% Load | 17.1 mV | 17.2 mV | 16.7 mV | 24.0 mV | Pass |
| 80% Load | 17.7 mV | 20.1 mV | 22.4 mV | 23.8 mV | Pass |
| 90% Load | 18.2 mV | 20.5 mV | 23.5 mV | 24.5 mV | Pass |
| 100% Load | 30.3 mV | 23.1 mV | 26.6 mV | 29.5 mV | Pass |
| 110% Load | 30.8 mV | 24.7 mV | 29.5 mV | 30.9 mV | Pass |
| Crossload 1 | 9.1 mV | 20.7 mV | 28.5 mV | 18.6 mV | Pass |
| Crossload 2 | 7.3 mV | 16.6 mV | 16.7 mV | 16.4 mV | Pass |
| Crossload 3 | 6.0 mV | 14.5 mV | 25.2 mV | 16.6 mV | Pass |
| Crossload 4 | 28.4 mV | 14.8 mV | 9.4 mV | 24.1 mV | Pass |
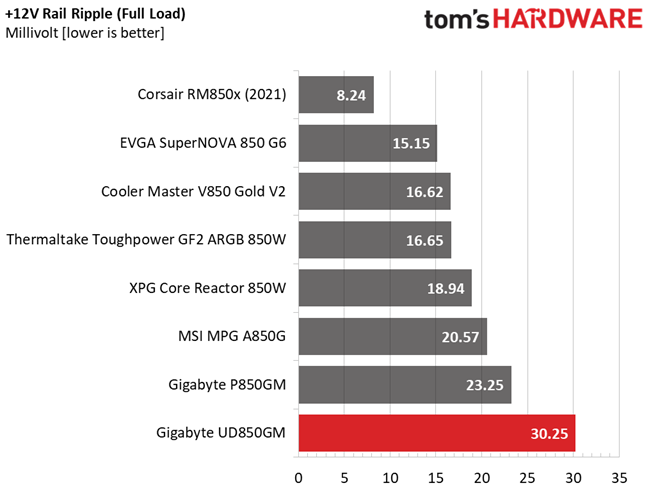
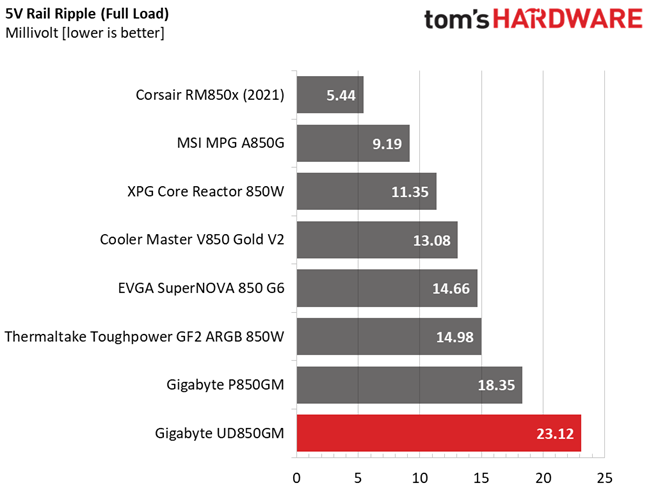
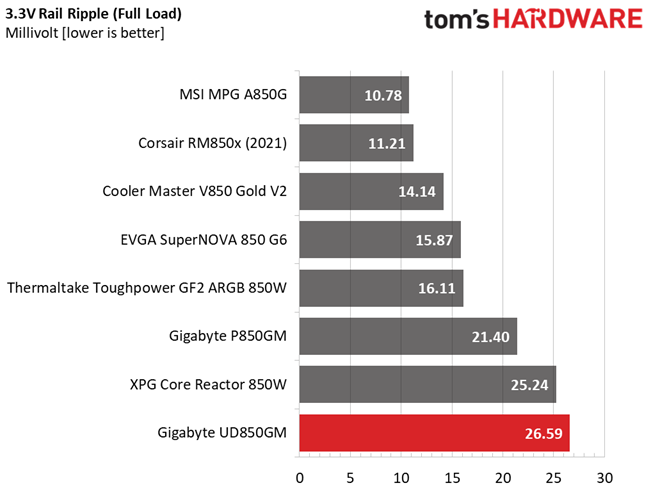
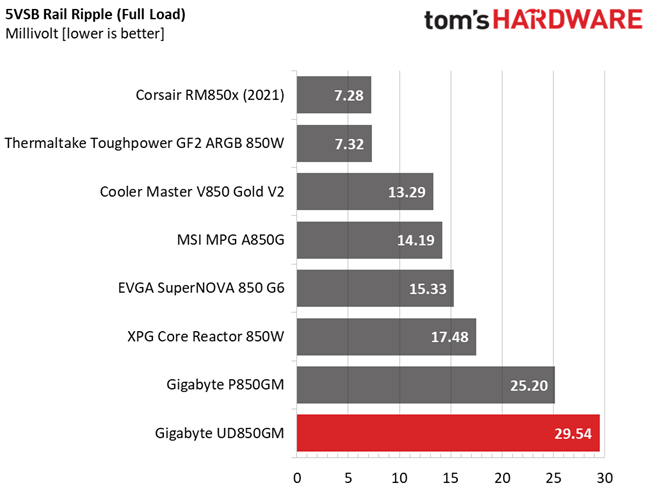
Ripple suppression is good, but the competition is better in this regard. Some PSUs, like the RM850x, have set the bar high in this section.
Ripple At Full Load
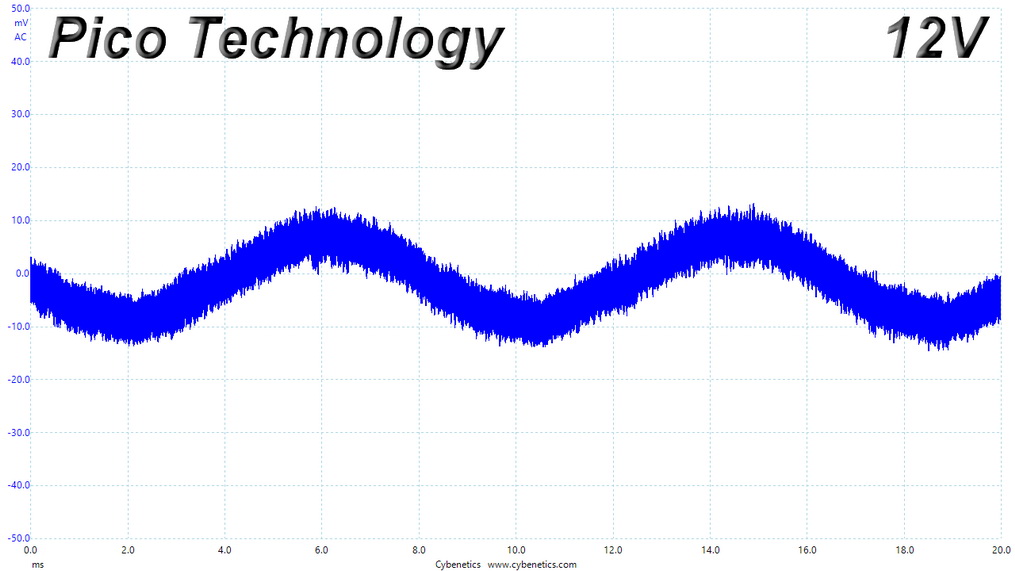
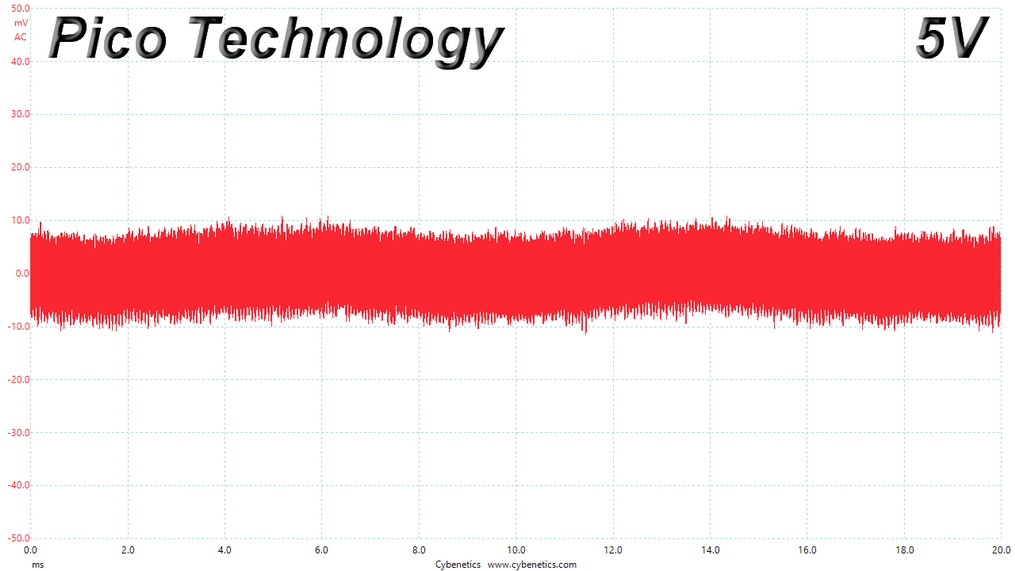
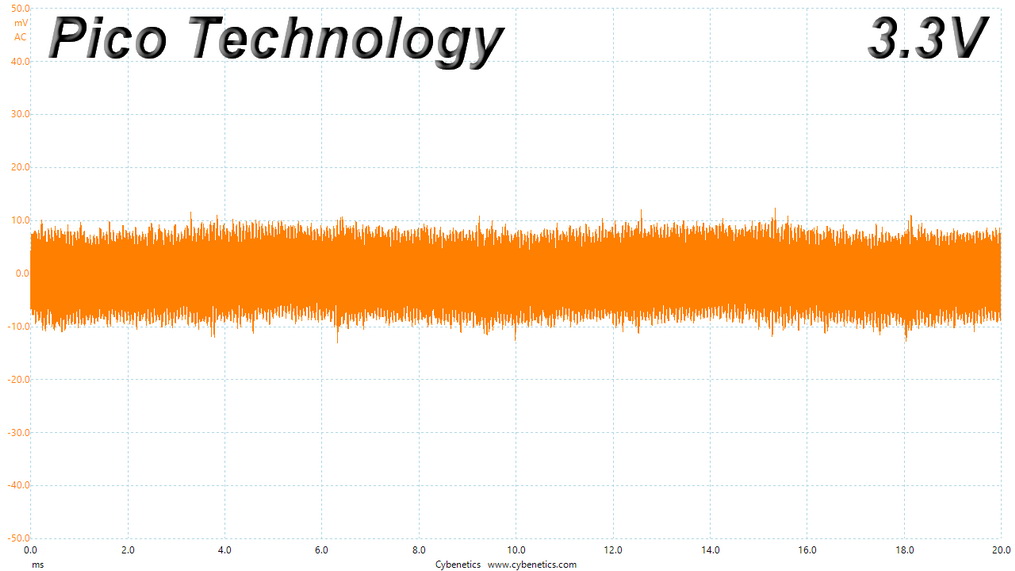
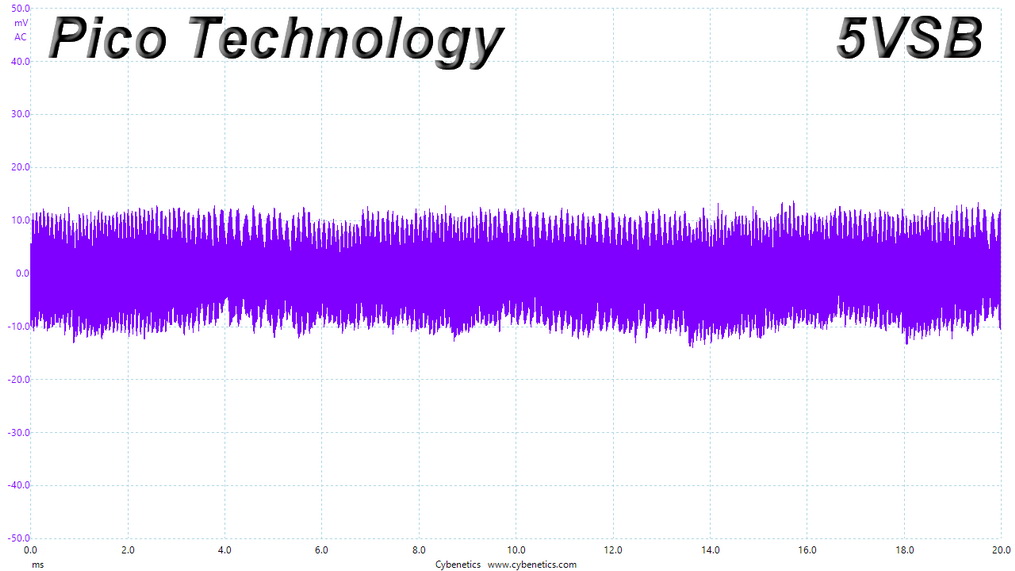
Ripple At 110% Load
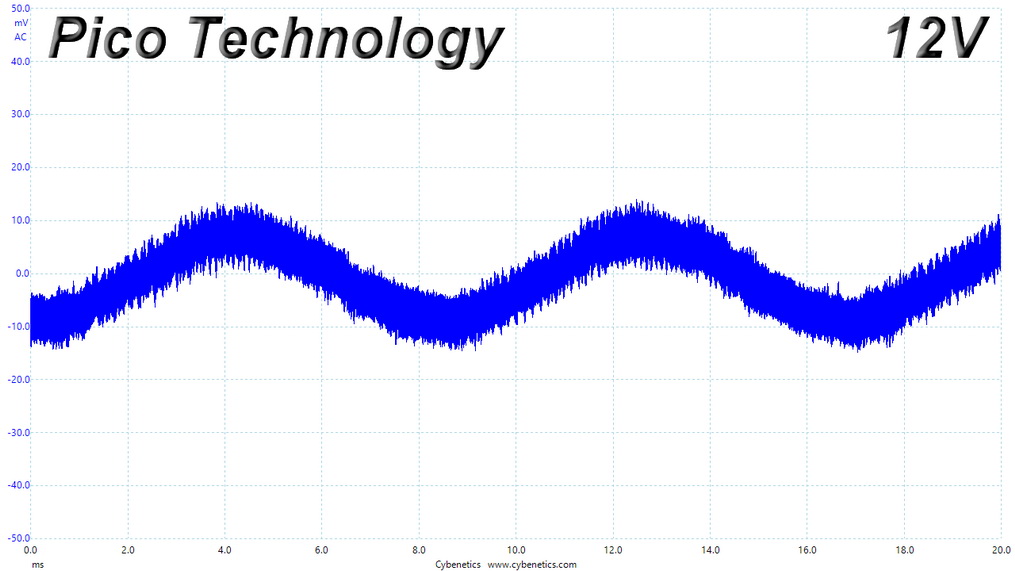
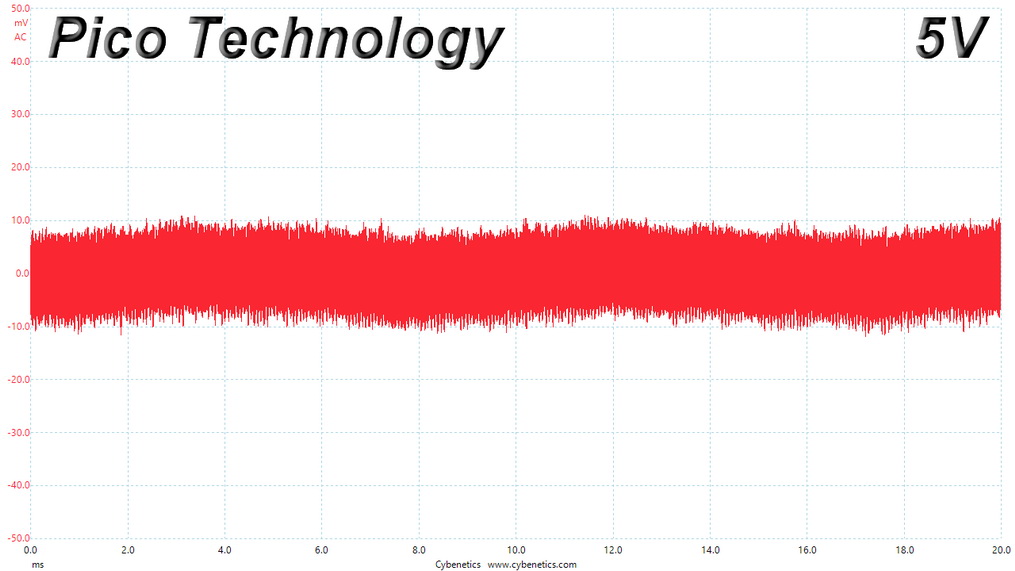
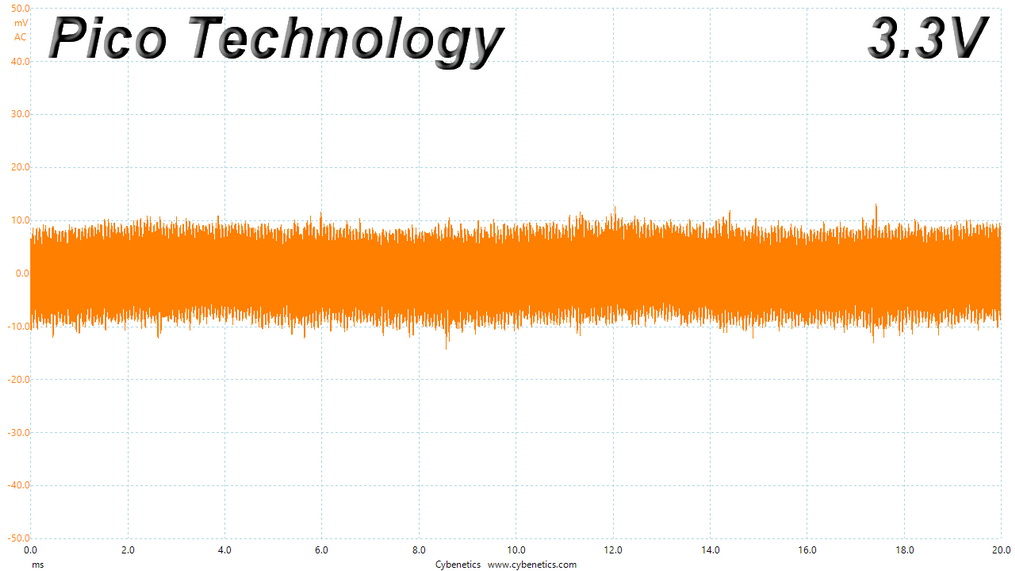
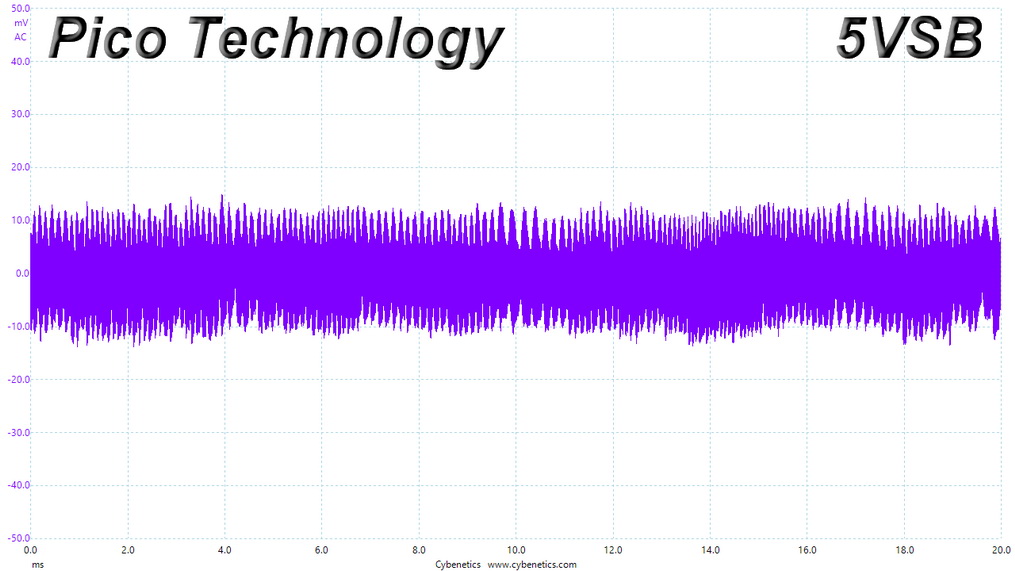
Ripple At Cross-Load 1
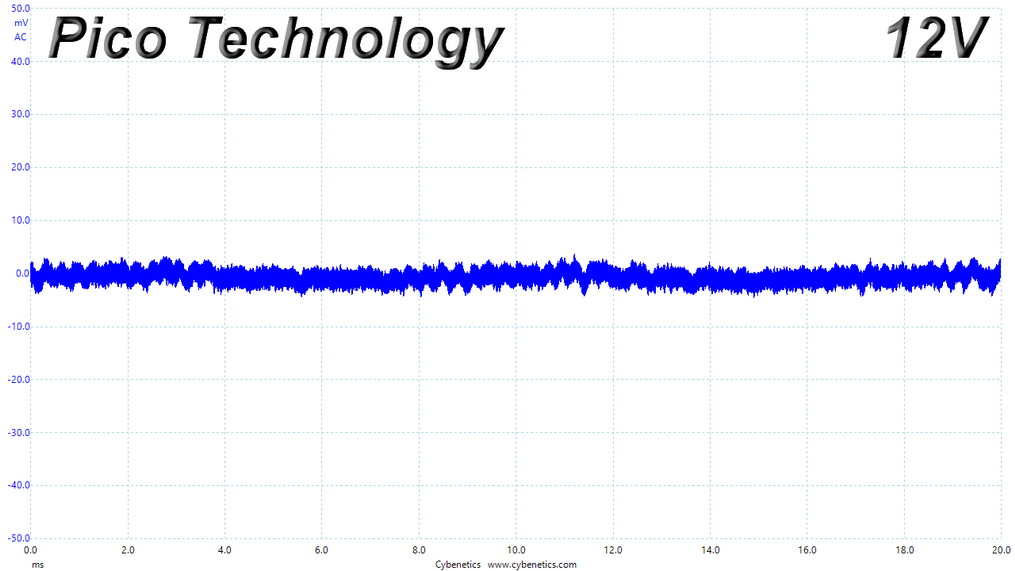
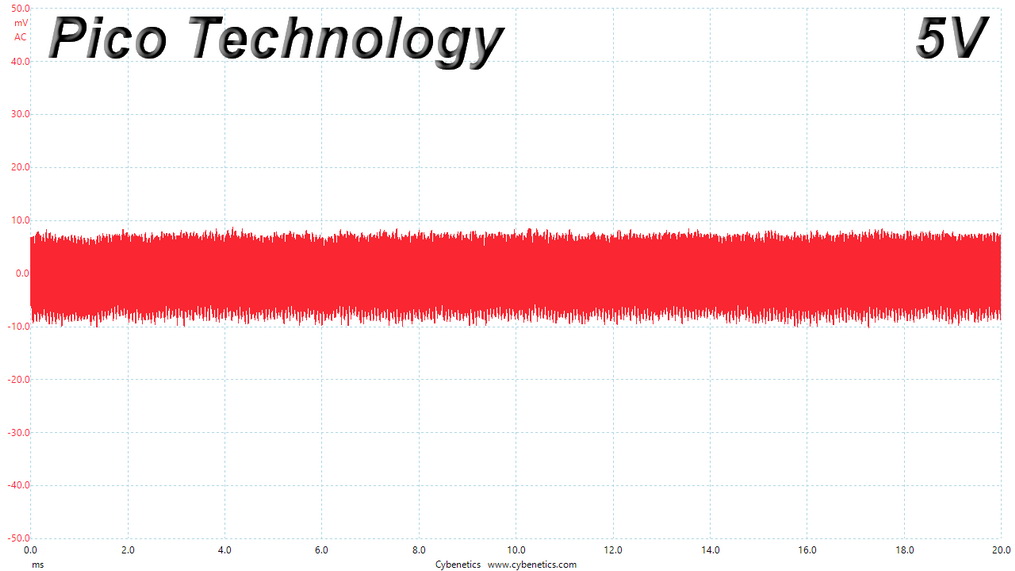
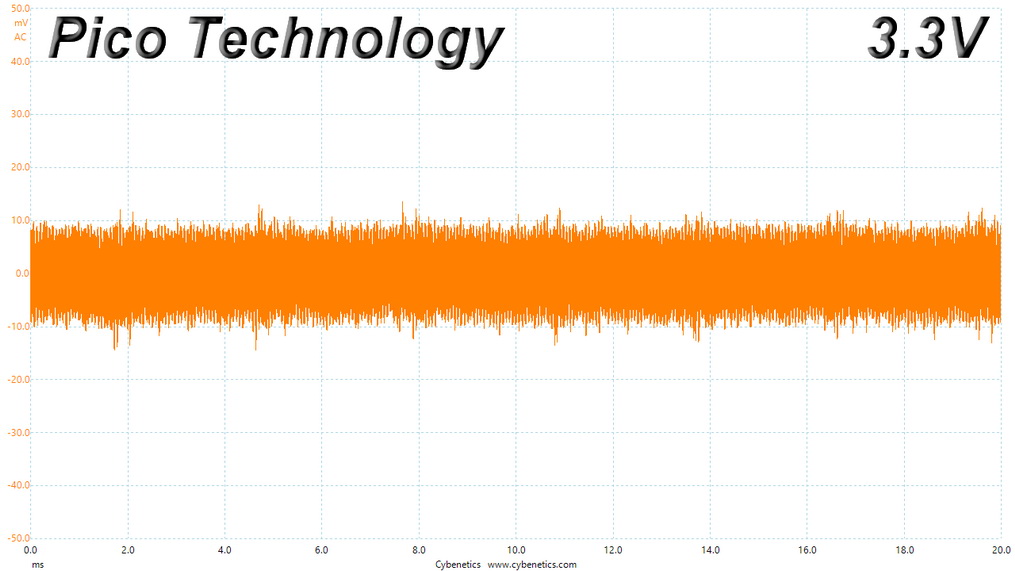
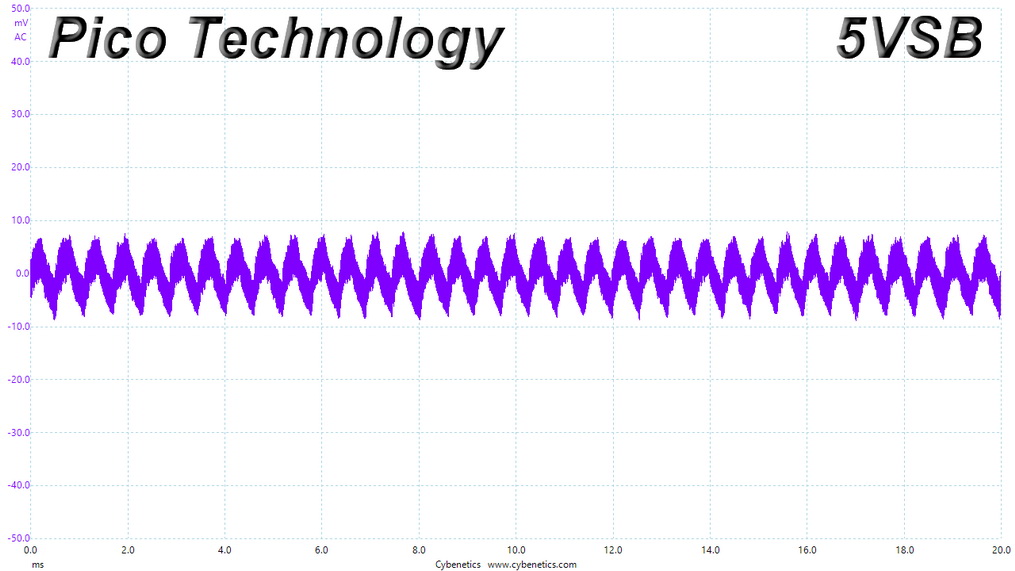
Ripple At Cross-Load 4
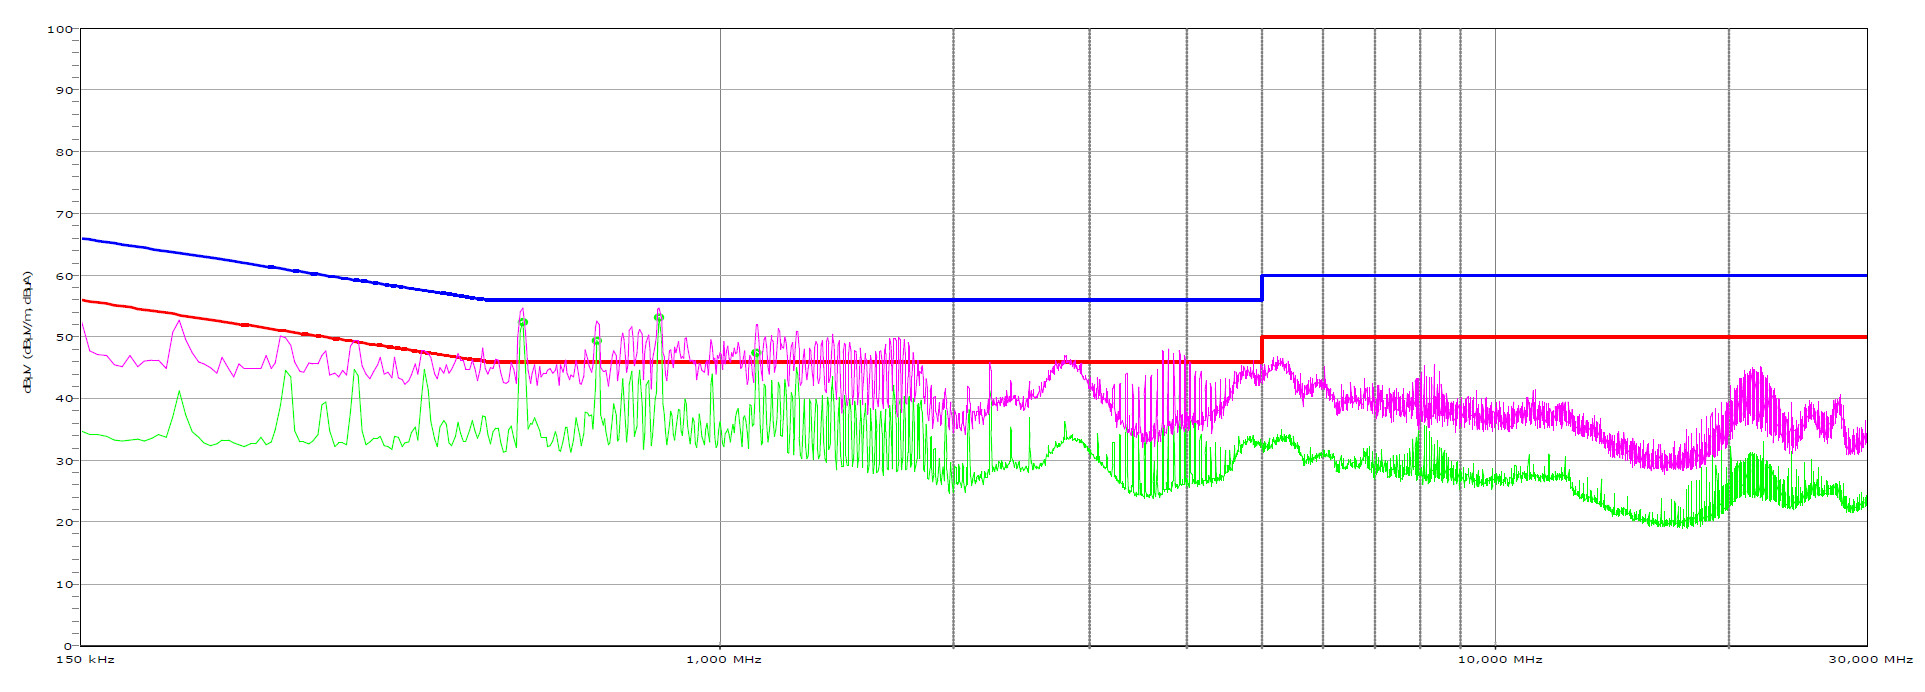
EMC Pre-Compliance Testing – Average & Quasi-Peak EMI Detector Results
Electromagnetic Compatibility (EMC) is the ability of a device to operate correctly in its environment without disrupting the proper operation of other nearby devices.
Electromagnetic Interference (EMI) stands for the electromagnetic energy a device emits, and it can cause problems in other nearby devices if too high. For example, it can cause increased static noise in your headphones or/and speakers.
΅We use TekBox's EMCview to conduct our EMC pre-compliance testing.
Some spurs go over the limit with the average EMI detector, but everything is fine with the peak EMI detector.
MORE: Best Power Supplies
MORE: How We Test Power Supplies
MORE: All Power Supply Content
Current page: Transient Response Tests, Timing Tests, Ripple Measurements and EMC Pre-Compliance Testing
Prev Page Protection Features, DC Power Sequencing, Cross-Load Tests and Infrared Images Next Page Performance, Noise, Efficiency and Power Factor
Aris Mpitziopoulos is a contributing editor at Tom's Hardware, covering PSUs.
