Tom's Hardware Graphics Charts: Performance In 2014
Two years and two graphics card generations have passed since the last major update to our famous graphics card performance charts. It's time to get them back up to speed. We introduce modern benchmarks, new measurement equipment, and fresh methodology.
DiRT 3 And BioShock Infinite
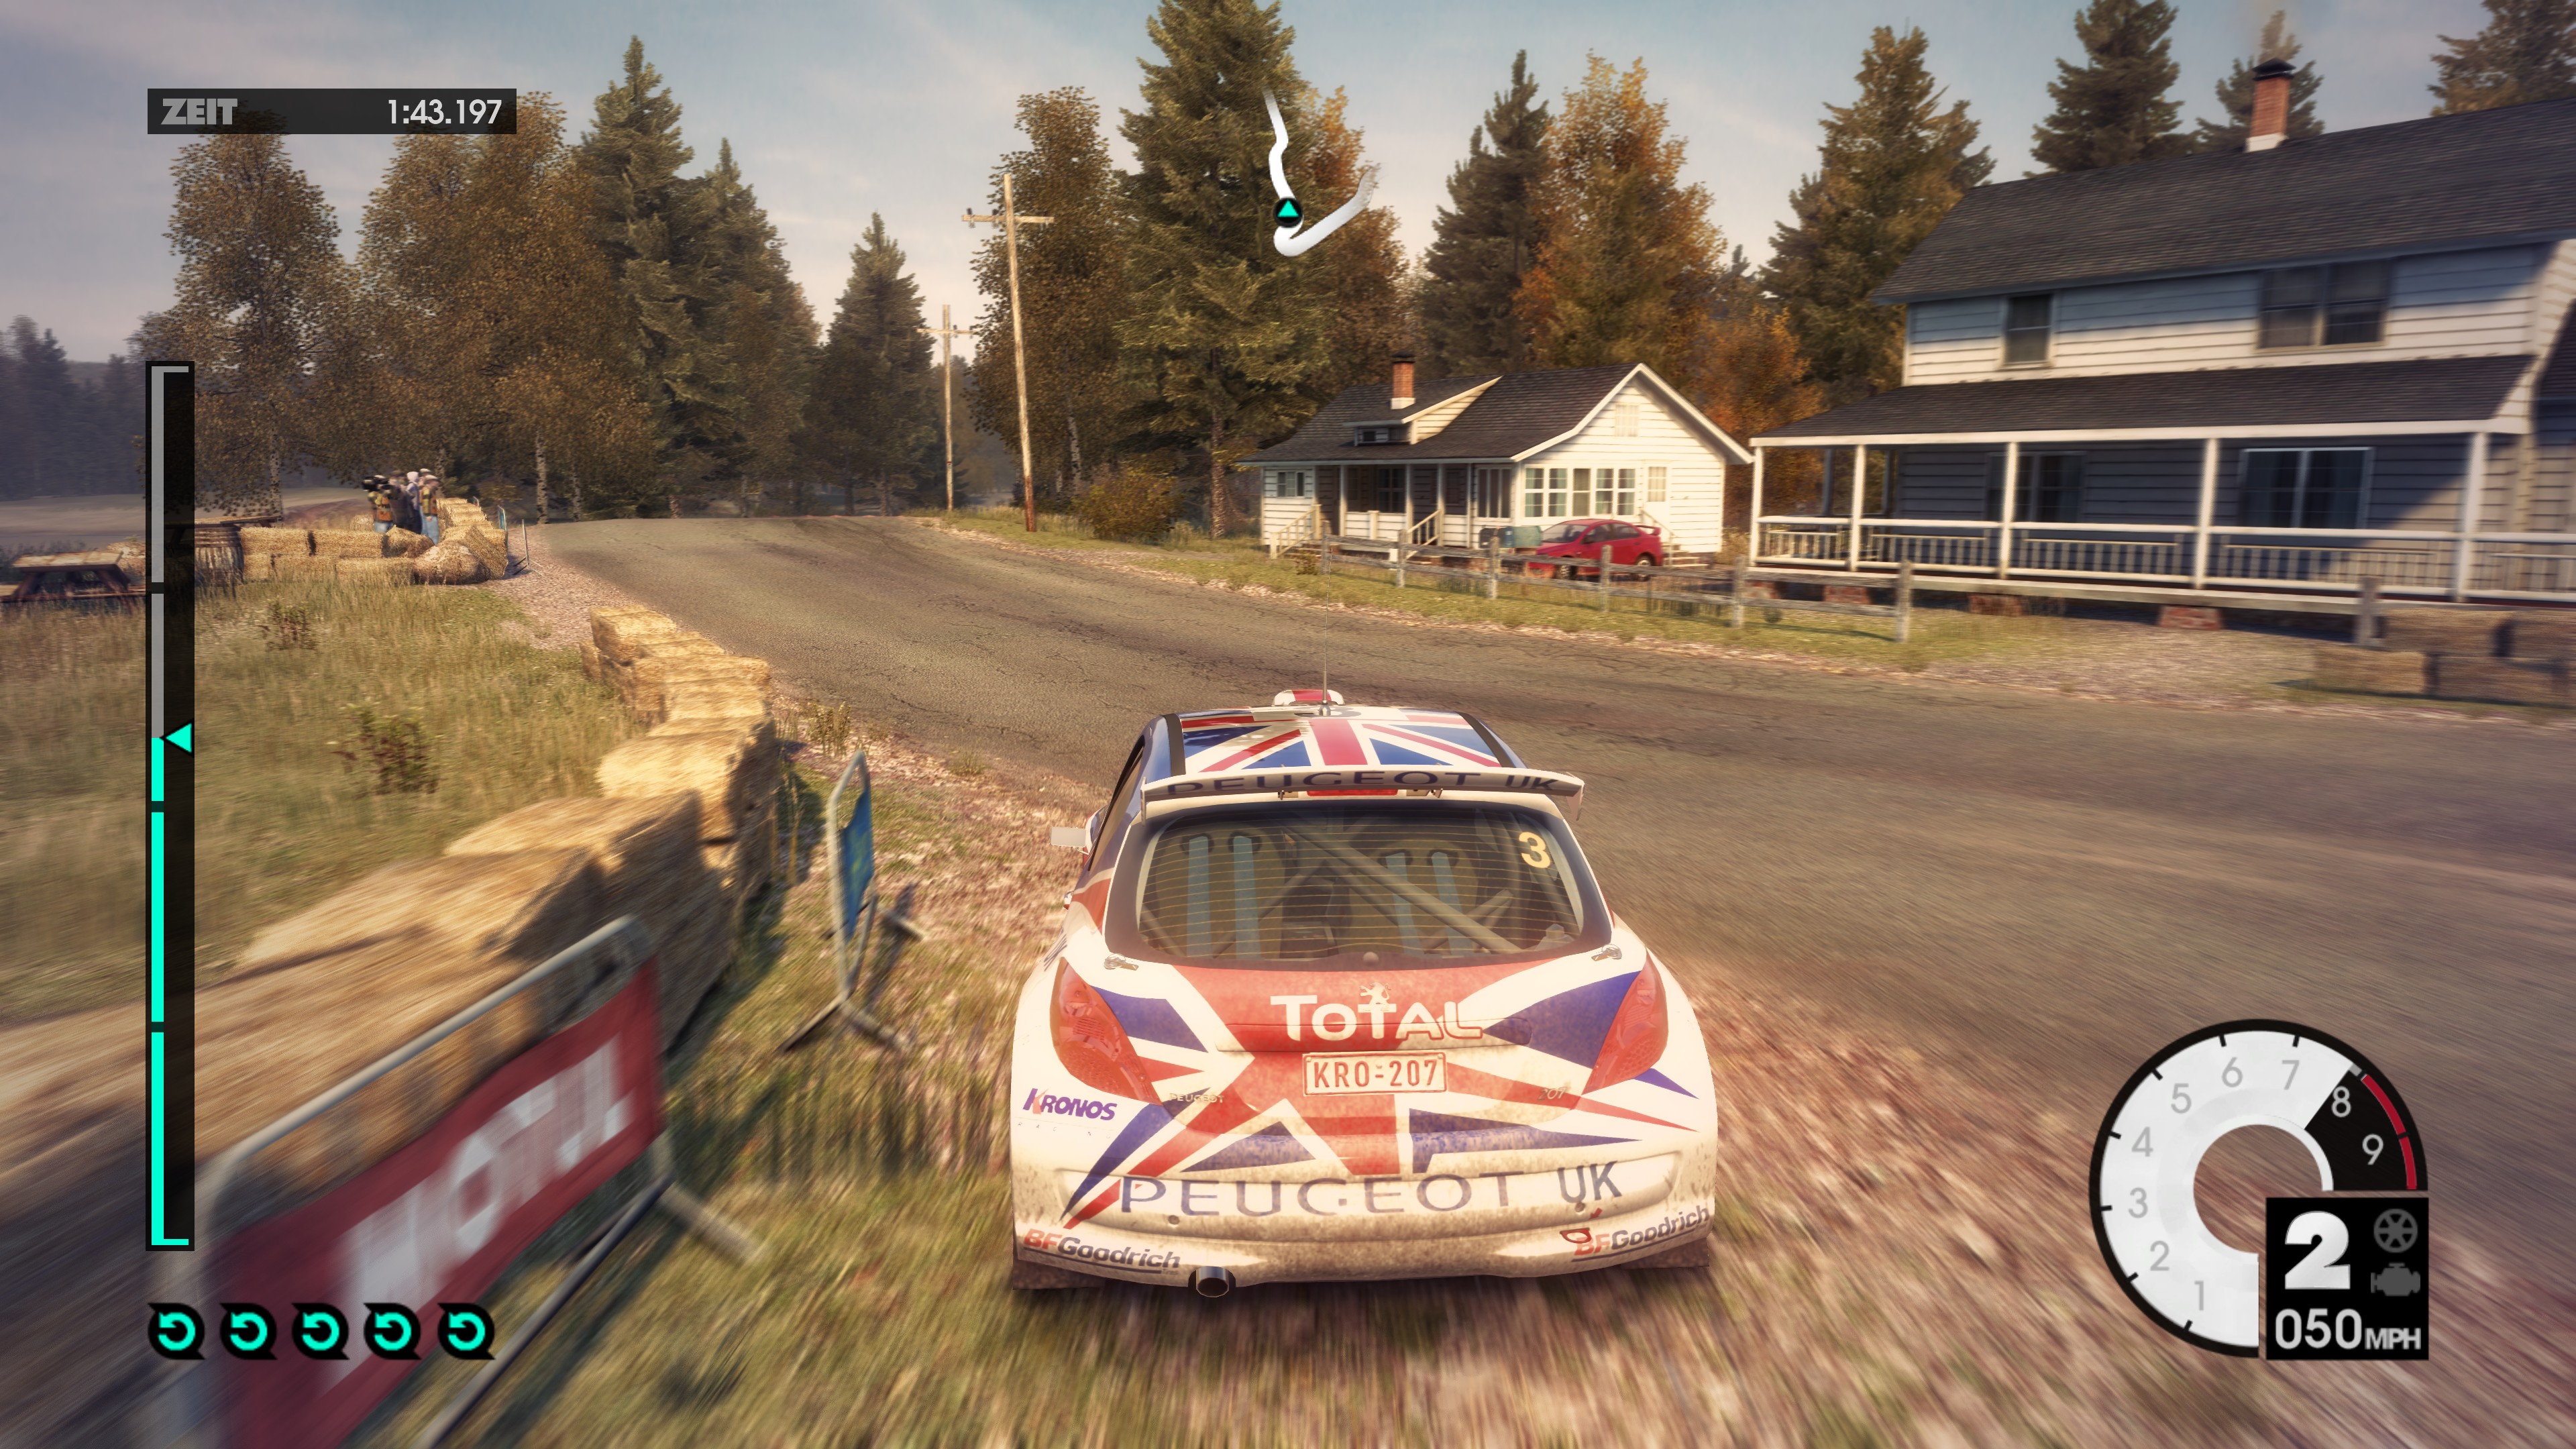
DiRT 3
The following benchmarks aren't as taxing as those on the previous page. That means dealing with much higher frame rates, even at the most demanding quality settings. High-end graphics cards can get CPU-limited pretty easily in titles like these, which is why we went with an overclocked Ivy Bridge-E-based processor.
The following video shows one of the three loops we run per resolution. Once again, we use an average of the last two runs, while the first run gets each GPU up to its operating temperature.
We made a conscious choice to use the most demanding detail settings possible in this game, since even a GeForce GTX 750 Ti cuts right through at 1920x1080. Higher resolutions are needed to push mid-range cards.
| DiRT 3 - Michigan - Route 0 - 1 Car | |
|---|---|
| Run 1 | 1920x1080 (1080p)API: DirectX 11Quality: UltraAnti-aliasing: 8x |
| Run 2 | 3840x2160 (2160p)API: DirectX 11Quality: UltraAnti-aliasing: 8x |
| Loops | Three per resolution; two used for evaluation |
BioShock Infinite
BioShock Infinite is a good title for lower-end graphics cards as well, so we decided to include it. Our performance charts aren’t just meant for the high end, but also for regular users, after all.
We perform three benchmark runs per resolution, the first of which heats each GPU. The other two are averaged together, serving as the result in our charts section. The video shows our benchmark sequence.
And the obligatory settings:
| BioShock Infinite | |
|---|---|
| Run 1 | 1920x1080 (1080p)Texture Detail: UltraAF: 16xDynamic Shadows: UltraPost-processing: AlternateLight Shafts: OnAmbient Occlusion: UltraLoD: Ultra |
| Run 2 | 3840x2160 (2160p)Texture Detail: MediumAF: 16xDynamic Shadows: HighPost-processing: NormalLight Shafts: OnAmbient Occlusion: MediumLoD: High |
| Loops | Three per resolution; two used for evaluation |
Get Tom's Hardware's best news and in-depth reviews, straight to your inbox.
Current page: DiRT 3 And BioShock Infinite
Prev Page Metro: Last Light And Thief Next Page Tomb Raider And Hitman: Absolution
Igor Wallossek wrote a wide variety of hardware articles for Tom's Hardware, with a strong focus on technical analysis and in-depth reviews. His contributions have spanned a broad spectrum of PC components, including GPUs, CPUs, workstations, and PC builds. His insightful articles provide readers with detailed knowledge to make informed decisions in the ever-evolving tech landscape
-
blackmagnum Thank you Tom's team for updating the charts. You're my goto when I'm upgrading my rigs. I'll be waiting... Bring on yesterday's gems.Reply -
tomfreak First thing Tom need is to bench how PCIE 2.0 8x vs 16x perform on a modern top end GPU. Since 290X are passing the bandwidth from crossfire bridge to PCIE, may be is time to check them again? As I recall AMD do not recommend putting 290x XDMA crossfire on PCIE 2.0 8x. Please check this outReply -
cypeq First it's great to see new charts.Reply
I was never a fan of this style of benchmarking. It sure gives clean graph of gpu capabilities which we always needed. I would love to see new bottleneck analysis. Or at least parallel test done on midrange PC.
Everyone should keep mind that these charts represent performance of <1% PC builds out there.
13278215 said:First thing Tom need is to bench how PCIE 2.0 8x vs 16x perform on a modern top end GPU. Since 290X are passing the bandwidth from crossfire bridge to PCIE, may be is time to check them again? As I recall AMD do not recommend putting 290x XDMA crossfire on PCIE 2.0 8x. Please check this out
If I recall correctly we are at this moment at the edge of PCI 2.0 x8 which = PCI 1.0 x16 . Next or following gen will finally outdate PCI 1.0 in single and PCI 2.0 in dual GPU configs as there will finally be noticeable bottle necks. -
mitcoes16 Any Steam OS or GNU/Linux benchmarks?Reply
It would be nice to add any opengl crossplattform game as any ioquake based one or something more modern and test it under MS WOS and under GNU / Linux
Better if it is future Steam OS to let us know the performance at the same game under MS WOS and under GNU/Linux.
Also it would be nice to test at MS WOS with and without antivirus, perhaps avast that is free or any other of your preference.
Last but not least, in opengl or in directx there are version changes and being able to split cards generations by opengl / directx version support would help as a current price / performance index based in your sponsored links prices. -
mitcoes16 No 720p tests?Reply
720p ( 1280x720 píxels = 921.600 píxels) is half 1080p more or less
1080p (1920\00d71080 píxels = 2.073.600 pixels)
And when a game is very demanding or you prefer to play with better graphics playing at 720p is a great option
Of course,latest best GPUs would be able to play at 4k and full graphics, but when we read the benchmarks we want to know also if our actual card CAN play at 720p (1k) or what the best ones can do at 1k to be able to compare
Also even it is not a standard or accurate, for benchmarking purposes calling 720p (1k) 1080p (2k) and 2160p (4K) wouldbeeasier to understand in a fast sight than UHD FHD and HDR, that can be used too UHD (4k) FHD (2k) HDR (1k) -
InvalidError Reply
720p does not stress most reasonably decent GPUs much and how many people would drop resolution to 720p these days with all the re-scaling artifacts that might add? In most cases, it would make more sense to stick with native resolution and tweak some of the more GPU/memory-intensive settings down a notch or two - at least I know I greatly prefer cleaner images over "details" that get blurred by the lower resolution and re-scaling that further distorts it.13278758 said:No 720p tests?
Considering how you can get 1080p displays for $100, I would call standardizing the GPU chart on 1080p fair enough: the people who can only afford a $100 display won't care much about enabling every bell and whistle and the people who want to max everything out likely won't be playing on $100 displays and $100 GPUs either. -
2Be_or_Not2Be I really like to see the charts on how much noise a video card's cooling fans make. That makes more of a difference to me as limiting something distracting that I hear every time I game versus getting a louder card with 10 fps more.Reply
I also like seeing how current cards stack up performance-wise to previous generations. That really helps when you're deciding whether to upgrade or not.

