How We Test Network Switches
Testing Suite And Methodology
Our testing suite is split into four different benchmarks: Point to Point, Bi-Directional, Mesh Interference and Response Time. Tests are conducted using Ixia's IxChariot software to measure throughput and response time between systems.
Before the switches are tested, an Ixia endpoint agent is installed on our three client systems (the server is already running IxChariot and does not need another endpoint). Downloadable from the Ixia website, the agent uses a preconfigured script to measure and report the results we're looking to generate via IxChariot's interface.
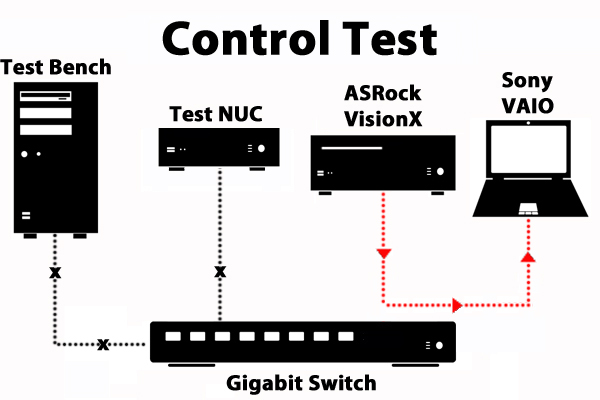
A control is a test in which the subject is not influenced by variables. In this case, our control is a straight cable test; no Ethernet switch is involved. Throughput is measured from point to point between the ASRock VisionX and Sony Vaio.
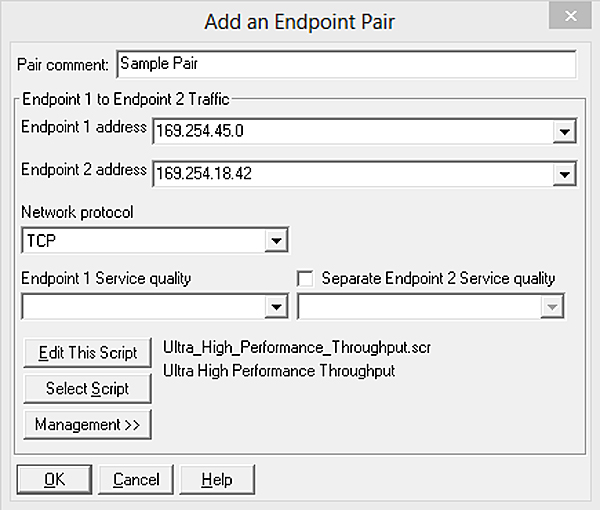
Using IxChariot and each computer' IP address, we created an endpoint pair, designating our ASRock Vision X server as Endpoint 1 and our Sony VAIO as Endpoint 2. We chose a script aimed at measuring throughput over Gigabit Ethernet; the same script was used for our Point to Point, Bi-Directional and Interference tests. All other settings remained the same.
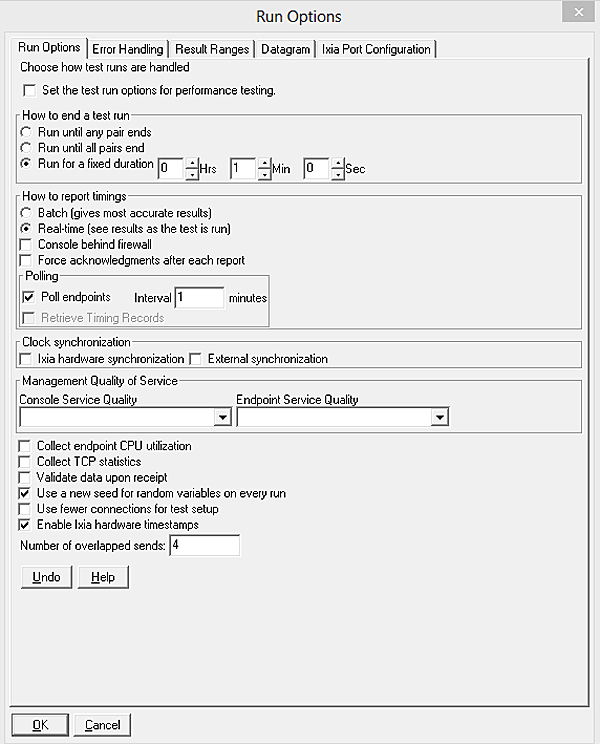
Under Run Options, "Run for a fixed duration" is set to one minute. The control test and all subsequent tests are conducted under a one-minute cap.
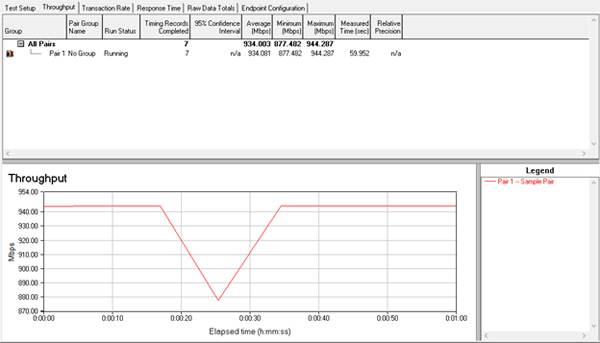
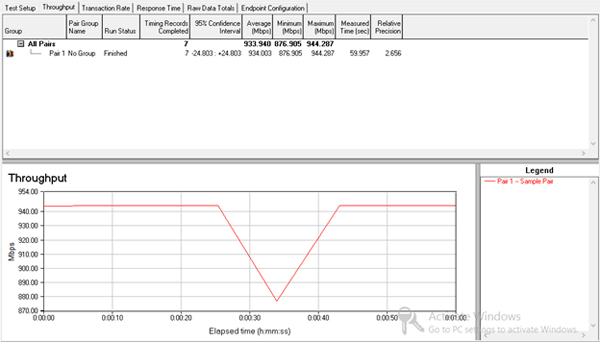
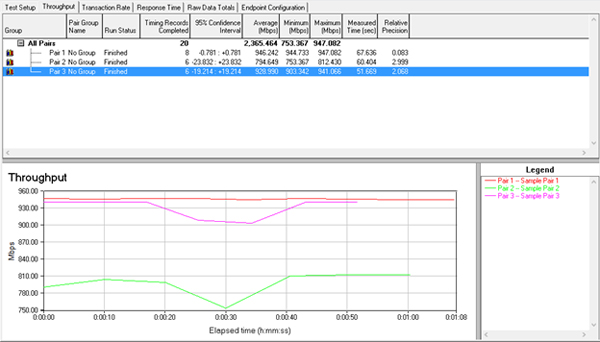
Once the test is complete, the Throughput tab illustrates the minimum, maximum and average speeds. The line graph below illustrates performance at each point in time. We'll be comparing this data to the results from our Point to Point, Bi-Directional and Mesh Interference tests later.
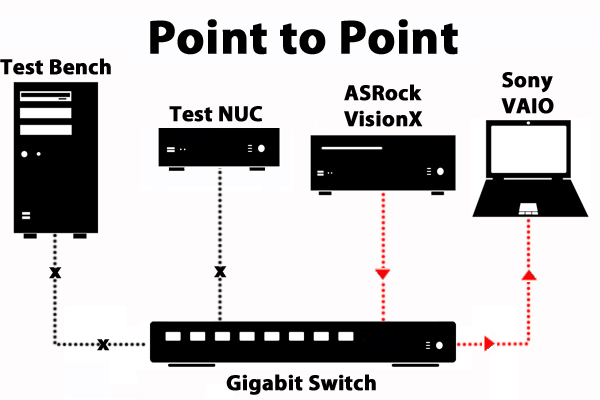
Our first variable metric is the Point-to-Point TCP Throughput Test, which measures the throughput from one endpoint to another. The process is exactly the same as the Control Test, but it runs through our network switches. As in the Control Test, the active members are the ASRock VisionX and Sony VAIO laptop; the other two computers are offline.
Get Tom's Hardware's best news and in-depth reviews, straight to your inbox.
The image above shows how IxChariot charts its results. In this Point-to-Point Throughput Test, you can see a slight but evident difference between the Control Test and Network Switch runs. The delta isn't particularly noteworthy; after all, adding a switch simply introduces a bridge for information from the server to travel through—a lone traveler on an empty bridge should not encounter much resistance on its journey. Likewise, our stream of benchmark data is not obstructed.
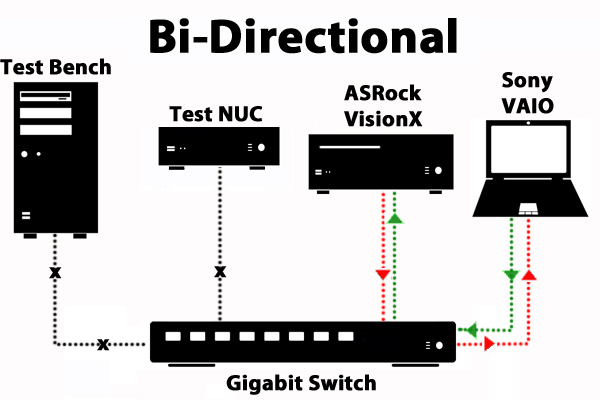
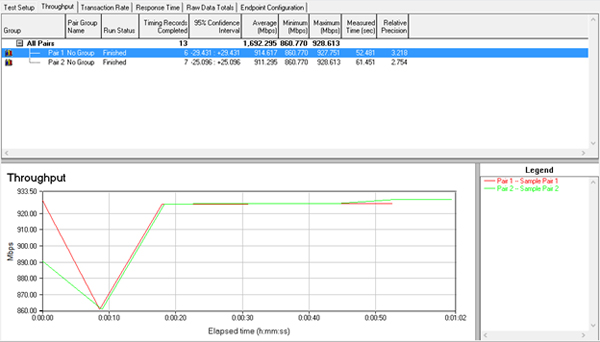
Testing throughput from the server to the laptop (and vice versa) over a network switch introduces more network traffic and produces lower average throughput. As with the previous benchmark, one pair designates the server as Endpoint 1 and the laptop as Endpoint 2. A second pair is created in IxChariot with the laptop as Endpoint 1 and the ASRock VisionX as Endpoint 2.
This chart shows the effect of driving more traffic through a network switch, demonstrating lower throughput across the board. In our bridge allegory, the traffic would be two travelers crossing the same bridge. Depending on how wide and well-built the bridge is, they might bump into each other, brush shoulders or walk past each other effortlessly.
The Mesh/Interference Test generates even more traffic through the switch. The results from the Mesh Test will suggest the performance level you might expect in a practical setting. After all, network switches are meant to have multiple devices connected to them. We want to stress each switch by flooding it with increasing amounts of data. Adding traffic in measured increments gives us an idea of how well the switch performs with two, three, four or more clients attached.
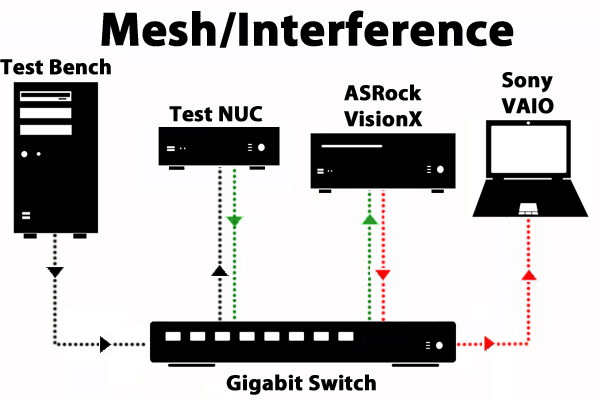
This test splits connections into three pairs: test bench to the NUC, NUC to the server, and server to the laptop.
In this example, more travelers with different destinations use the bridge, and contact with other travelers slows them down. Adding more connections to the switch diminishes overall throughput. Certain pairings, such as that of our Intel NUC to the server, delivered lower average, minimum and maximum throughput in multiple tests. If our bridge were bigger and sturdier, there would be less interference. A business-class switch, for example, is meant to handle high levels of traffic with numerous systems connected.
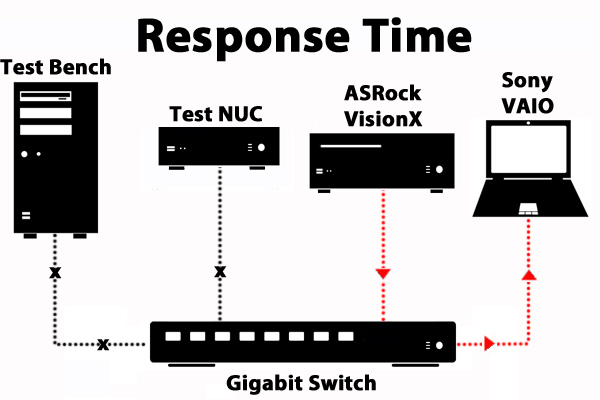
Response Time Tests are a little bit different. The same procedure for creating a Point-to-Point Test is used—a pairing between the ASRock VisionX and Sony VAIO laptop is created, and the run duration is set to one minute. But we use a different script tailored to measuring the response time of the switch.
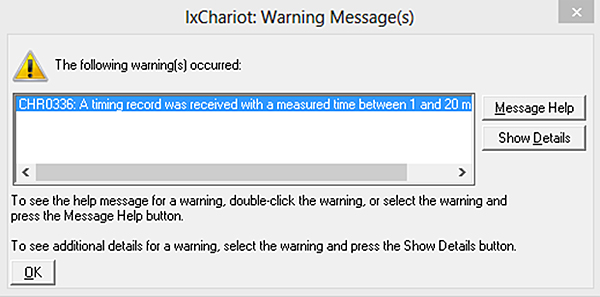
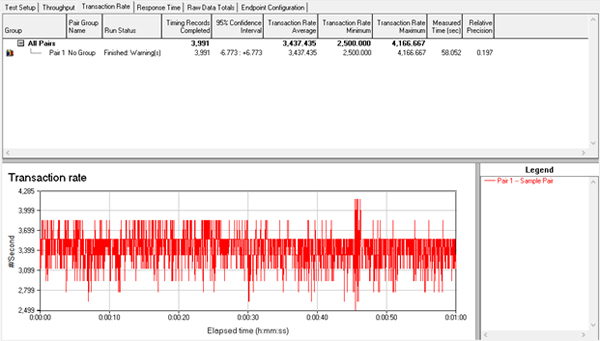
After the test is completed, this error message should appear: "IxChariot cannot show the response time if the results are below 20 milliseconds." To find the results of the test, switch to the Transaction Rate tab rather than the Response Time tab. There, you find the Transaction Rate average. To find the response time, use the following equation: 1/Average Transaction Rate x 1000 = Response Time
The lower the number, the faster the response time.
In this sample, the Transaction Rate average is 3437.435. Divide 1 by 3437.435, and multiply the result by 1000. The response time is rounded to 0.291 milliseconds.
Response times slightly from switch to switch. And at under one millisecond, you won't notice a difference from one model to another. But knowing exactly how fast switches perform may help you get the best value for your dollar.
Current page: Testing Suite And Methodology
Prev Page Test System Specifications Next Page Final ThoughtsTom's Hardware is the leading destination for hardcore computer enthusiasts. We cover everything from processors to 3D printers, single-board computers, SSDs and high-end gaming rigs, empowering readers to make the most of the tech they love, keep up on the latest developments and buy the right gear. Our staff has more than 100 years of combined experience covering news, solving tech problems and reviewing components and systems.
-
zodiacfml Nice but can we get something interesting or controversial when reviewing network switches? Increase the difficulty. Challenge yourselves; review various Wi-Fi routers especially the MU-MIMO capable.Reply -
Rancifer7 I like it, can't wait to see this put to good use on some network switches with mixed wireless too.Reply -
blackmagnum While you're busy with this, please consider testing the different brands of lan cables as well. I've heard that the monster cables are the market benchmark.Reply -
jacklongley Reply17199397 said:quick question what testing software is it?
It's IxChariot by Ixia (formerly by NetIQ). Frankly, not the best of testing solutions, but beggars can't be choosers. -
jacklongley Reply17200787 said:While you're busy with this, please consider testing the different brands of lan cables as well. I've heard that the monster cables are the market benchmark.
None of the tests presented will demostrate a difference with network cabling, insomuch as any cabling certified at Cat5E or above will allow the devices to operate at 1Gbps (or lower, for those devices using FastE instead).
Cabling benchmarks are more around the available transmission headroom, i.e. which Ethernet standard will it support. You can already ascertain these from the category of cabling, e.g. Cat7 vs. Cat5. -
jacklongley Personally, I'm not impressed with the lackluster approach to testing that Tom's Hardware demonstrates for network devices. These types of tests should follow the testing methodologies laid out years ago in RFC2544. In fact, IxChariot should already have RFC2544 options available by default.Reply
Perhaps Tom's should leave network testing and articles to the big boys. -
VTOLfreak I'm more upset about the hardware they are using than the software. You'd expect someone running network tests to at least bring server class network cards to the table. What are you testing here guys? The switch in question or your crappy network cards?Reply -
irongnome I have a few metrics that I would be very interested in seeing measured.Reply
A. Does the switch have adequate buffers/properly implemented flow control. This comes in to play when you mix FastEthernet and Gigabit on the same network.
B. Full Line Rate and Latency Test using a snake topology. Eg. Ports 1 and 2 on VLAN 1, Ports 3 and 4 on VLAN 2, Ports 5 and 6 on VLAN 3, etc. With a patch cable bridge 2 and 3, 4 and 5, etc. Connect the test machines to the first and last port. This will load the switch to its absolute capacity while only requiring two endpoints.
C. Power consumption. -
DrakeFS ReplyWhile you're busy with this, please consider testing the different brands of lan cables as well. I've heard that the monster cables are the market benchmark.
I truly hope you are being sarcastic, as networking is a digital signal. As a previous poster stated, if the cable is rated at 5e or above, it will serve up to 1Gbs of bandwidth. 6 and 6a will serve up to 10Gbs of bandwidth. The only thing that a Monster cable may have better than your average 5e ethernet cable, is that they may be terminated within tighter specifications. Still, this will not affect most consumers as the bottle neck will be your ISP speeds(unless you are one of the lucky ones with >= 1Gbs service). If you need to do a lot of cabling (or some really long cables), I suggest purchasing a 1000ft roll of 5e or 6a, some RJ45 terminators and a crimping tool. You will save $$$ in the end.
