Intel Optane Memory H10 M.2 NVMe SSD Review: QLC Flash Meets Optane Caching
Why you can trust Tom's Hardware
512GB Performance Results
Comparison Products
We couldn't use our standard storage test rig for this review. Instead, we turned to a 2019 13-inch HP Spectre x360 for our tests. We tested the Intel H10 and all of our comparison drives in this same system. We also included the 500GB-class Intel SSD 760p, Samsung 970 EVO Plus, and MyDigitalSSD BPX Pro.
To measure the advantages and disadvantages of Optane caching, we tested the Optane H10 in three modes: the full Optane caching implementation, as an Optane-only device, and as a QLC-only device.
Game Scene Loading - Final Fantasy XIV
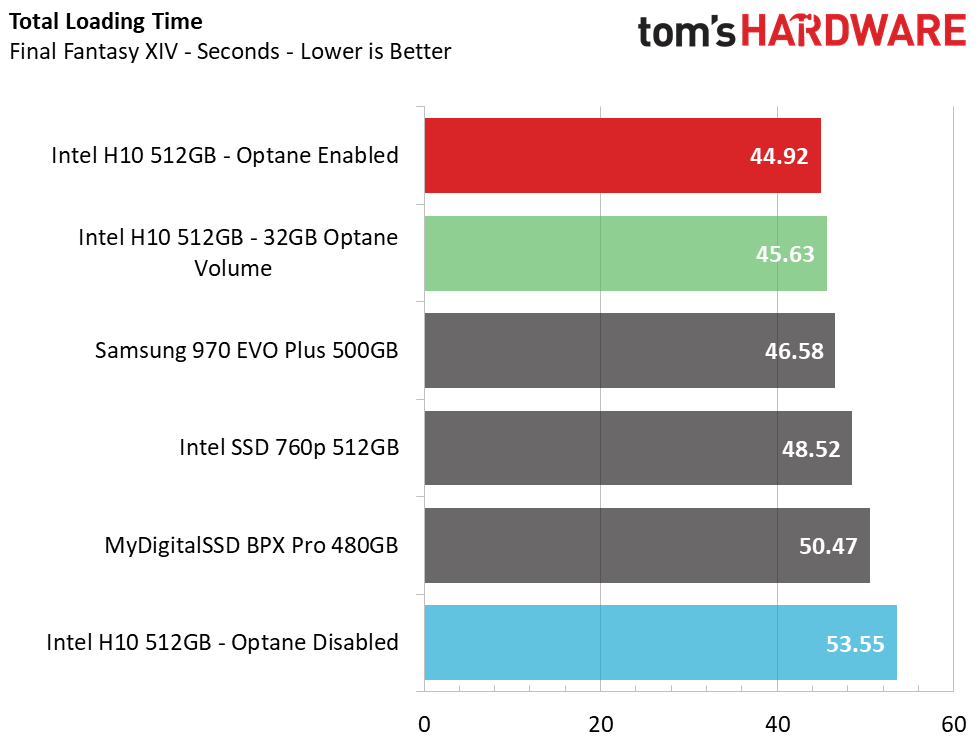
The Final Fantasy XIV StormBlood benchmark is a free real-world game benchmark that easily and accurately compares game load times without the inaccuracy of using a stopwatch.
The Optane cache provided much faster Final Fantasy load times compared to using the drive as a QLC-only device. The H10 loaded the scenes in just under 45 seconds while other drives, including some of the fastest NVMe SSDs on the market, trailed it by 2-5 seconds.
Trace Testing – PCMark 8 Storage Test 2.0
PCMark 8 is a trace-based benchmark that uses Microsoft Office, Adobe Creative Suite, World of Warcraft, and Battlefield 3 to measure the performance of storage devices in real-world scenarios.
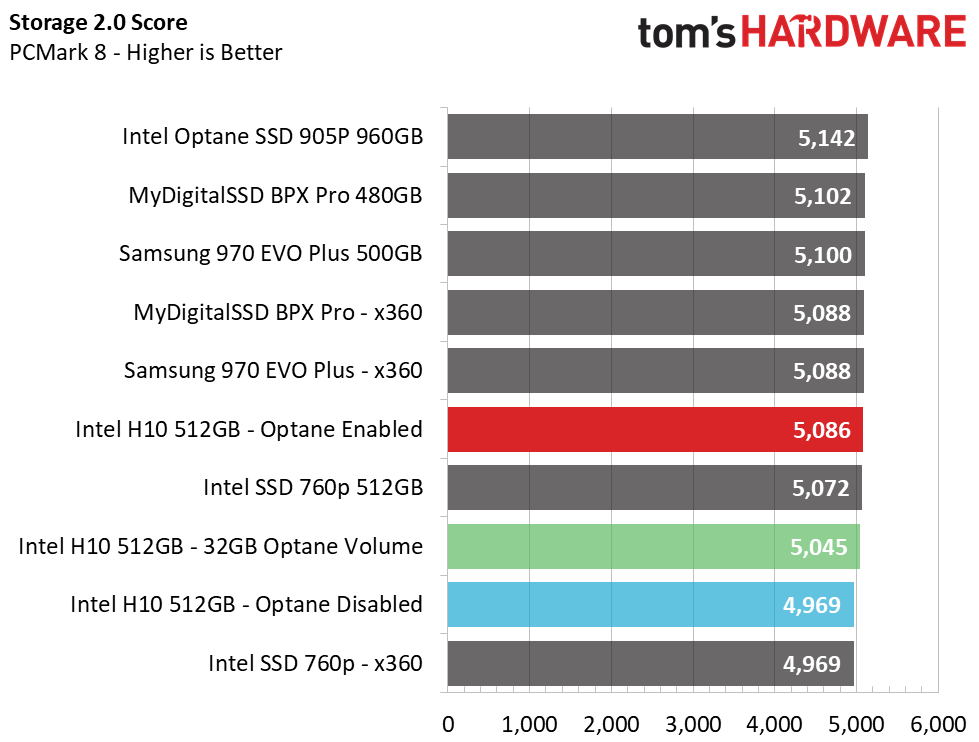
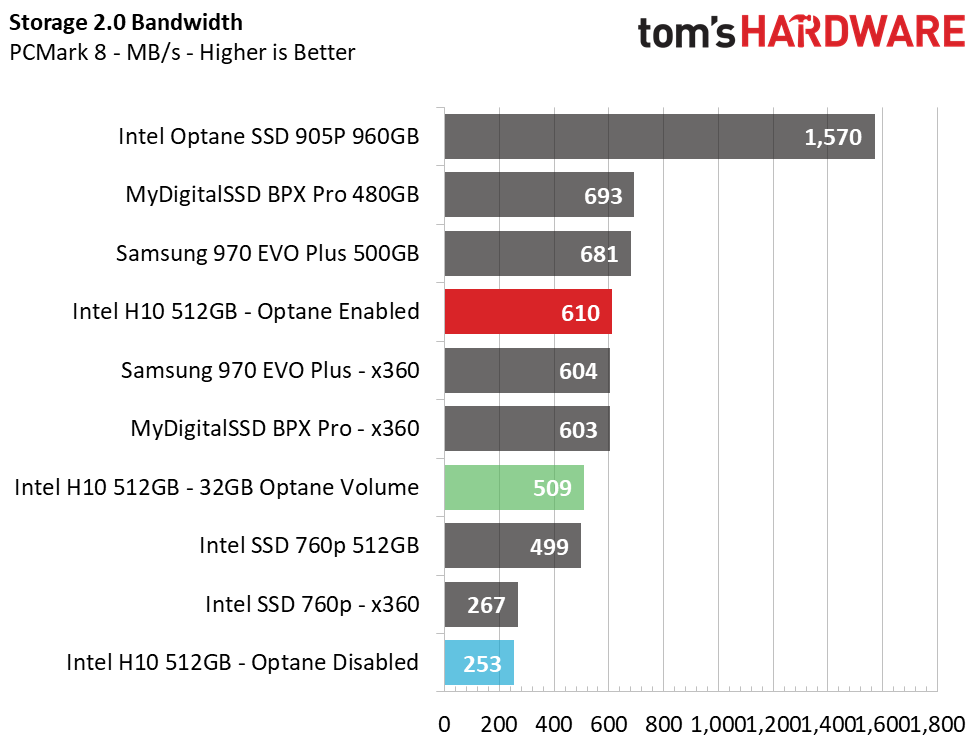
In PCMark 8, Intel’s Optane Memory H10 did quite well with Optane caching enabled. Its score of 5086 points and average bandwidth of 610MB/s matched the BPX Pro and 970 EVO Plus.
Surprisingly, Intel’s higher-performance 760p didn’t do as well in the HP Spectre x360, scoring a fairly-low average throughput of just 267MB/s. We even did a clean reinstall of Windows and tested multiple times on another 760p drive we had on hand to verify this low score. In either case, the 760p was faster than the H10 with its Optane cache disabled.
Get Tom's Hardware's best news and in-depth reviews, straight to your inbox.
Transfer Rates – DiskBench
We use the DiskBench storage benchmarking tool to test file transfer performance with our own custom 50GB block of data. Our data set includes 31,227 files of various types, like pictures, PDFs, and videos. We copy the files to a new folder and then follow up with a read test of a newly-written 6 GB file.
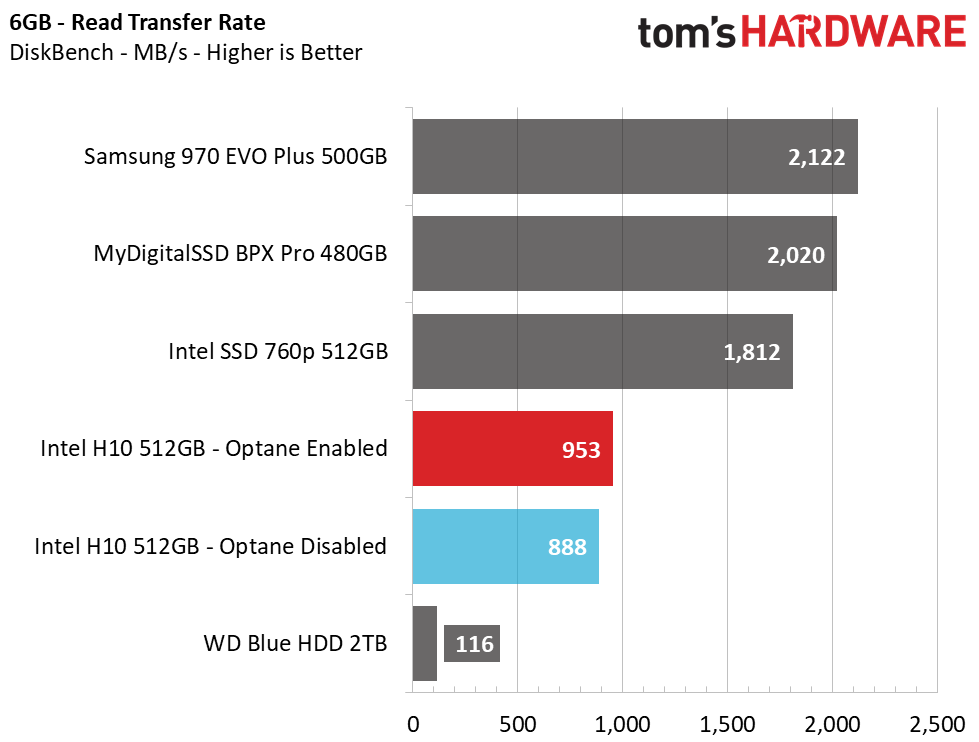
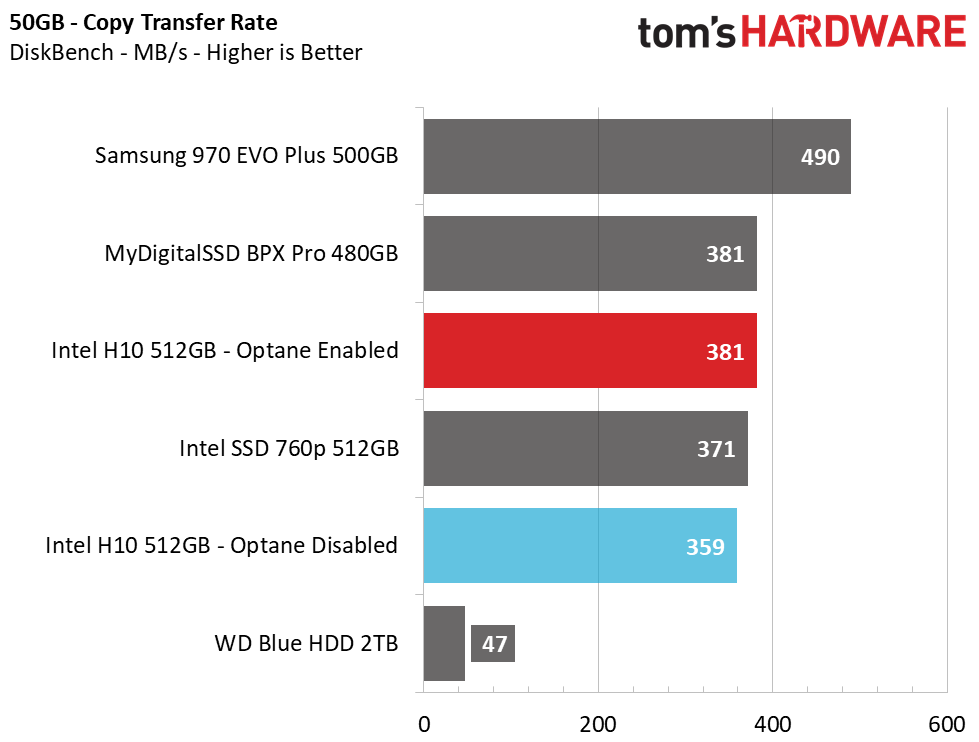
With caching, normally the first iteration of a workload doesn't see any improvement, but that’s where the H10 is different. In our 50GB file transfer test, we were able to improve performance just by enabling Optane caching. Our file read test also improved a bit too, thanks to Intel's controller aggregation that allows both drives to operate simultaneously. In either case, higher-end NVMe SSDs provided quite a bit more performance.
System Image Restoration – Macrium Reflect
System backup is an important task that many tend to forget, but a system restore can become a time-consuming task with slow storage devices like HDDs, especially if you've backed up a lot of data.
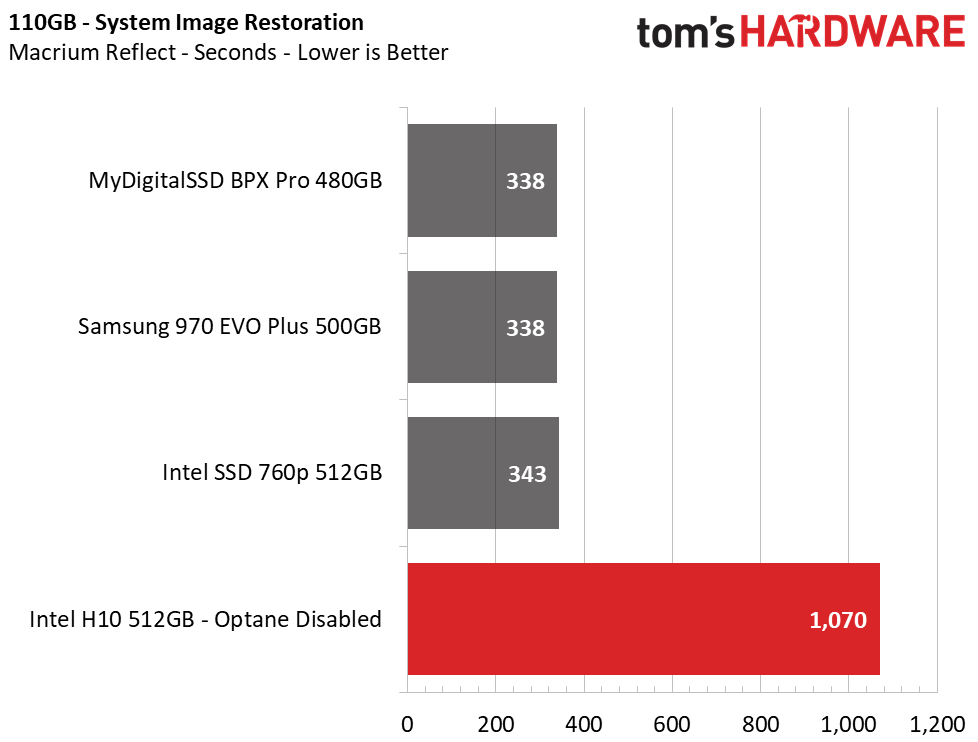
To ensure repeatable results, we secure erased each SSD to ensure the SLC cache was empty before we restored an average-sized 110GB system image.
Intel’s H10 has decent write performance on paper, but that doesn’t mean it applies to all workloads. The QLC flash also has its own SLC cache, and SLC cache capacity and the drive's performance after it is full are important during long sustained write workloads. Optane caching speeds up the operating system, but once the workload spills outside of the cache, the QLC NAND is all on its own.
During our image restoration, the BPX Pro, 970 EVO Plus, and 760p all finished within five minutes and ~40 seconds. The H10, on the other hand, required 17 minutes and 50 seconds. This is mainly due to QLC's slow write speed of 40-50MB/s after the SLC cache fills. After about 5 minutes, or roughly 70GB into the image restoration, the time remaining counter shot from just two minutes remaining to 12 minutes remaining, which is a byproduct of a full SLC cache.
System Boot Time
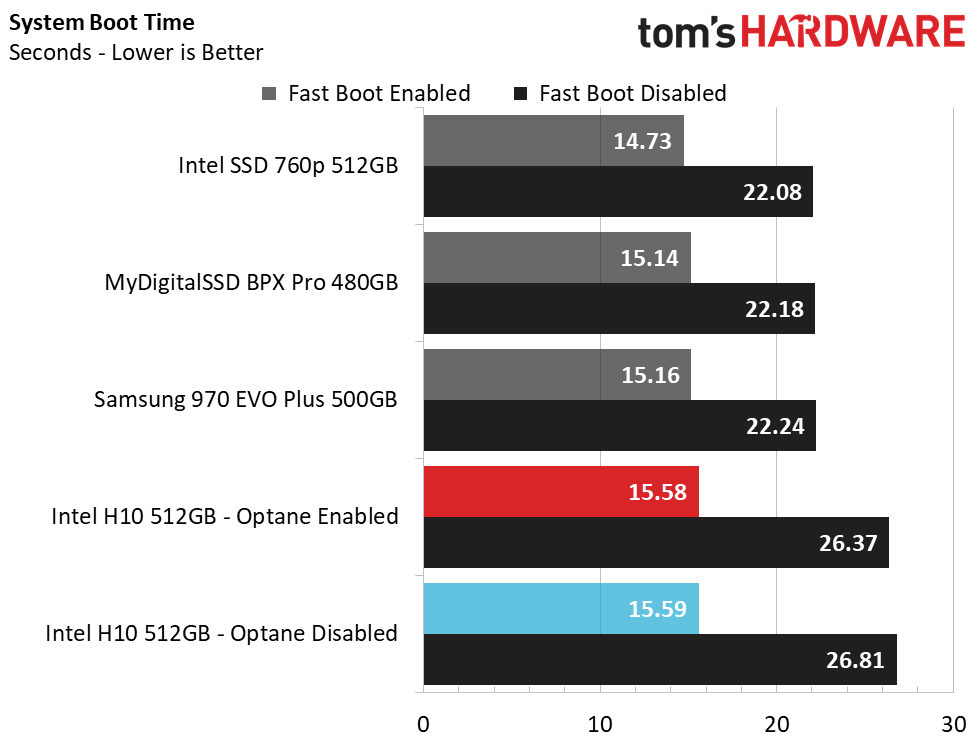
System boot was once a long and daunting task, but with the introduction of flash media, boot times now fly by. We rebooted our system multiple times to find the average boot time. We tested with Windows 10’s fast boot feature both enabled and disabled (five second POST delay in the UEFI).
As with most SSDs, boot time doesn’t vary much. The Intel 760p proved to be the fastest-booting device, trailed by the BPX Pro and Samsung 970 EVO Plus. Compared to the other drives, Intel’s H10 booted a little over a half a second slower with fast boot enabled, and about four seconds slower with the feature disabled.
Application Installation Times
To model a real-world workload, we timed how long it takes to install both GIMP and MS Office 2013 after we restored the system image.
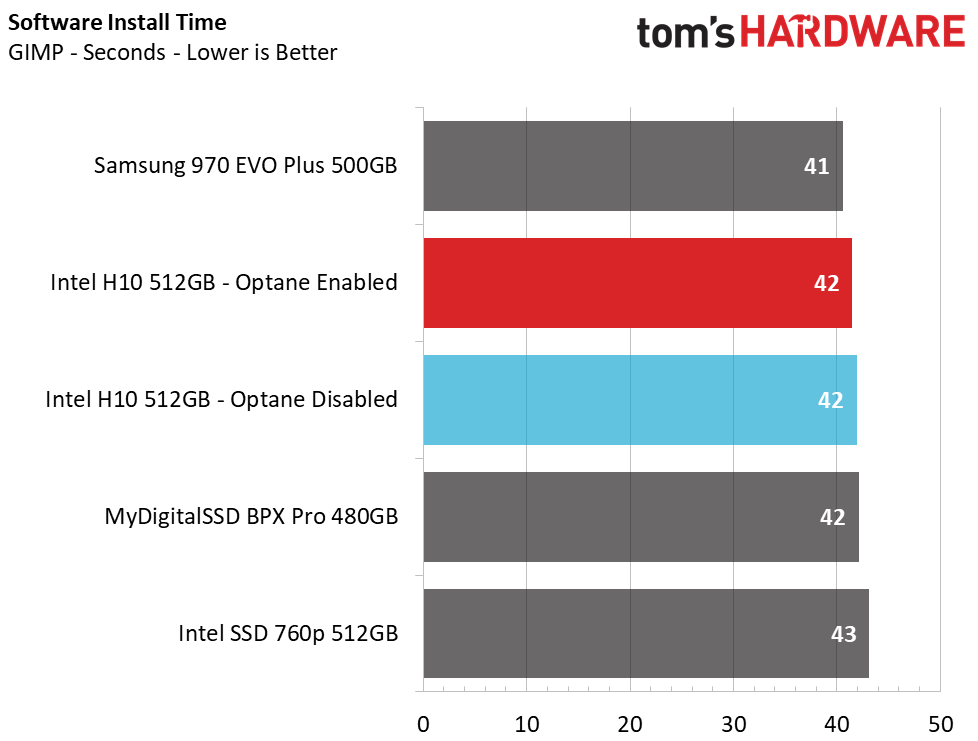
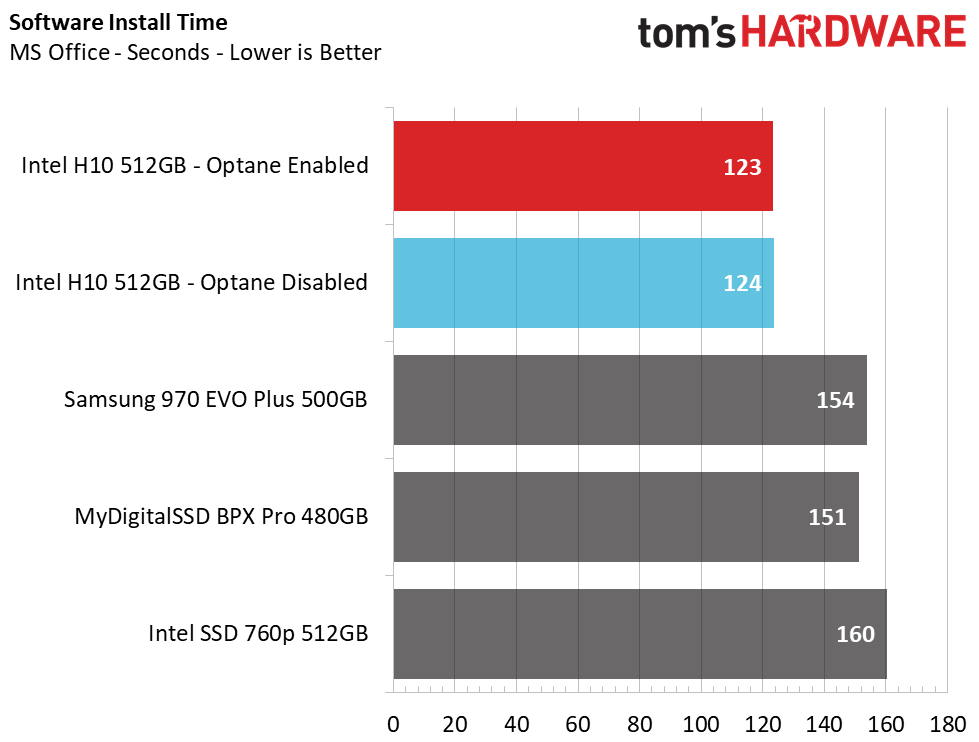
Intel’s H10 delivered some interesting results. To our surprise, the H10's Microsoft Office installation was about 30 seconds faster than any other drive in our test pool. Additionally, install times for both GIMP and Microsoft Office were about the same with Optane enabled or disabled.
File Load Times – AppTimer
Synthetic performance numbers are great, but nothing speaks to the end user like performance with real work files. Therefore, we used a handy little tool called AppTimer to help us time how long various test files take to load in Excel (60MB), PowerPoint (15MB), Word (8MB), and GIMP (87MB). We also added a second round of testing with a large video transfer running in the background at the same time as read requests are being issued.
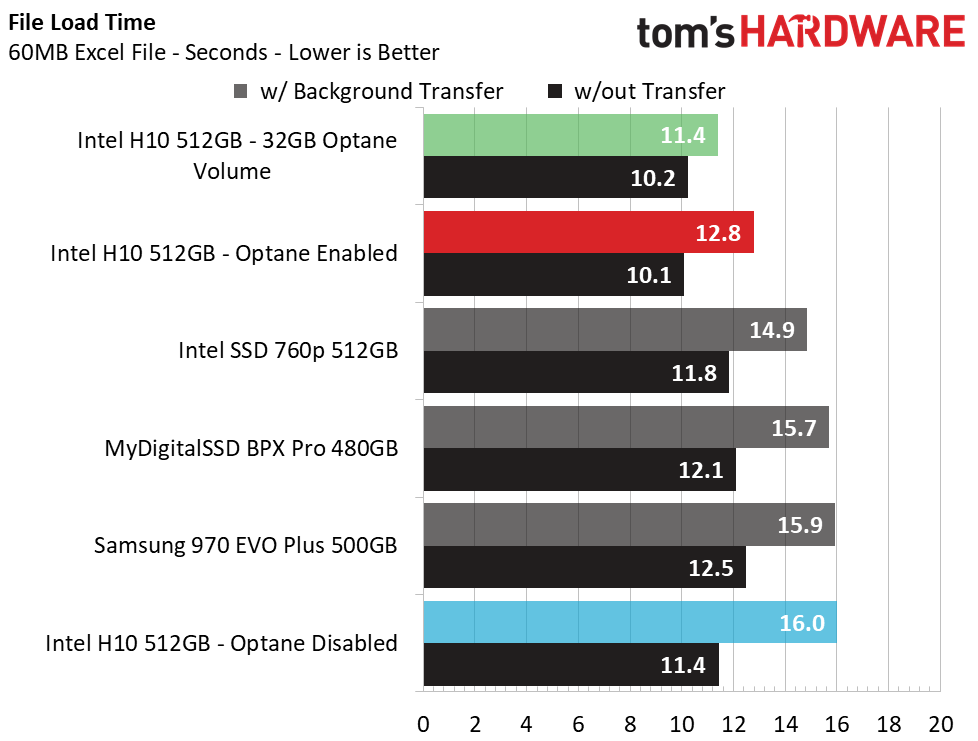
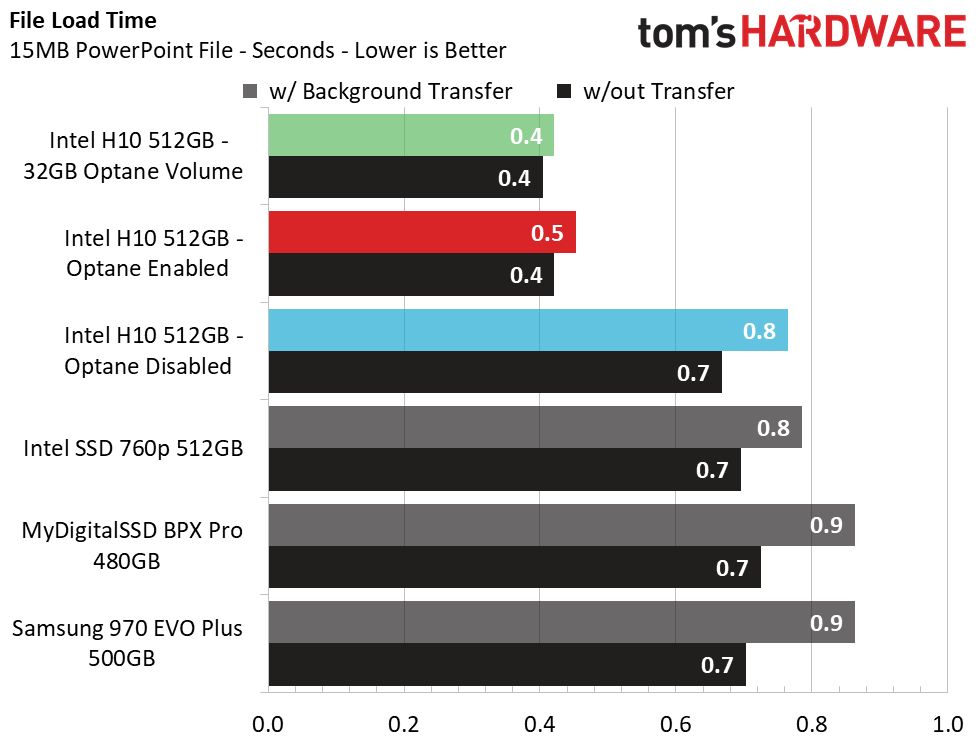
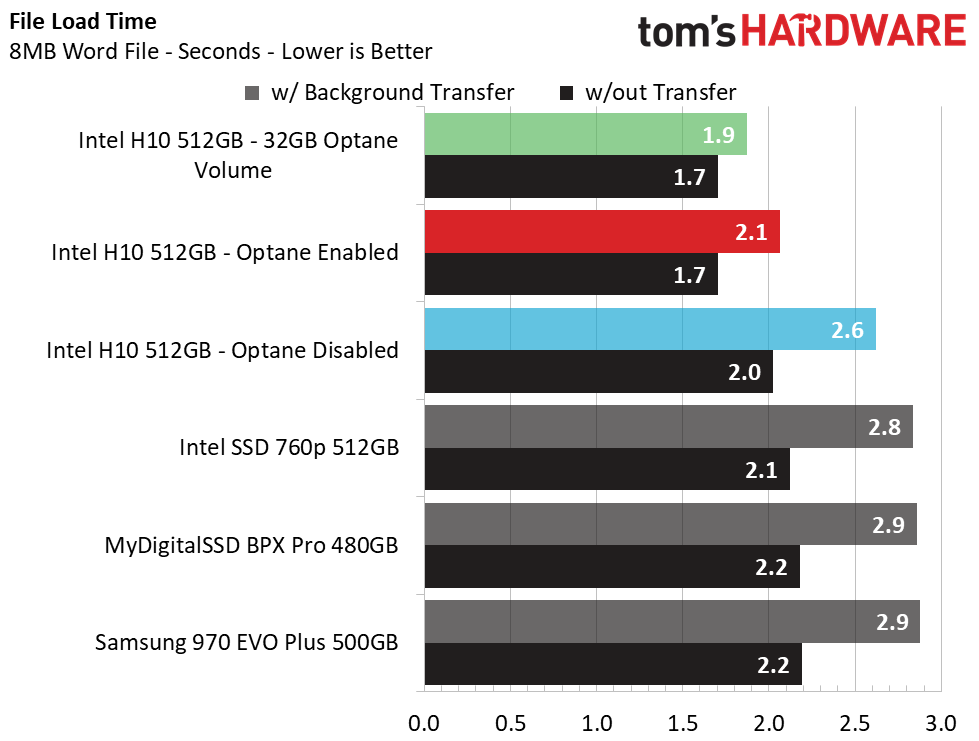
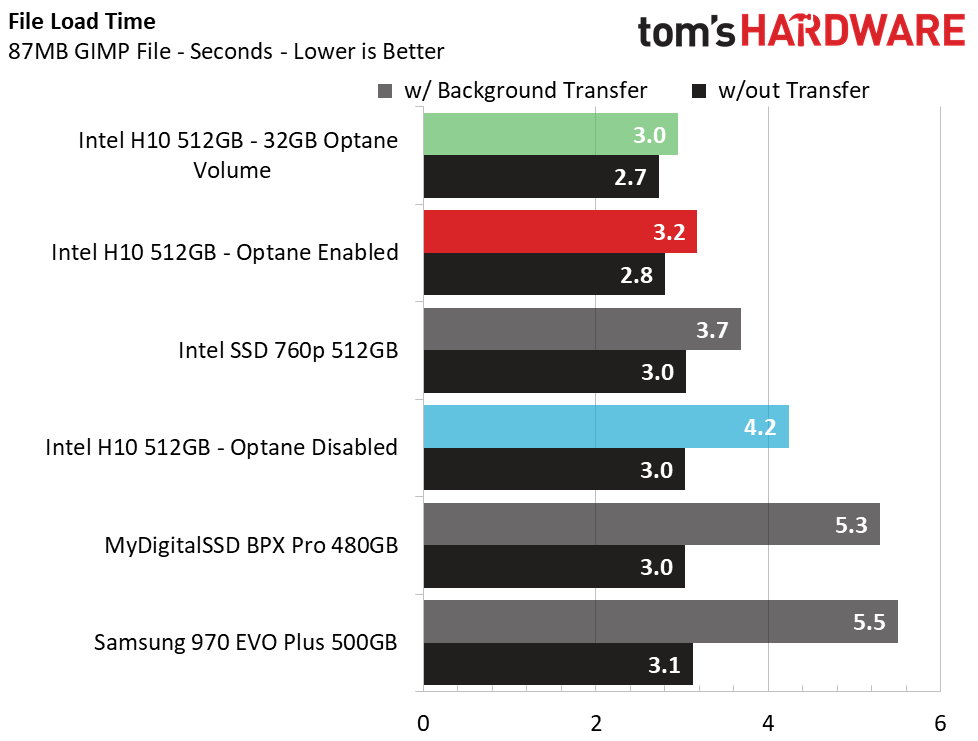
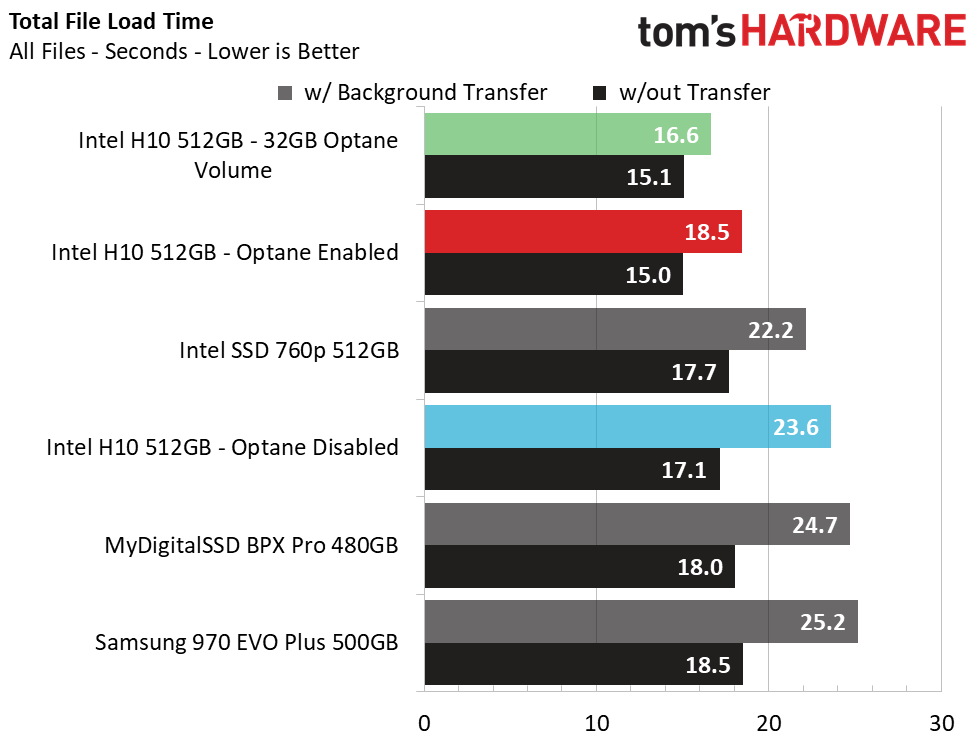
There wasn’t much variation between drives during our standard file loading tests. Overall, just a second to two, at most, separated the drives in the most extreme cases. The H10’s Optane volume provided the fastest read performance. The H10 with Optane caching enabled came in a close second, but it still beat the rest of the flash-based drives.
We can see that the H10’s Optane caching not only helps to speed up application and file load times, it also does a better job than TLC SSDs when other background activities are executing in the background.
ATTO
ATTO is a simple and free application that SSD vendors commonly use to assign sequential performance specifications to their products. It also gives us insight into how the device handles different file sizes.
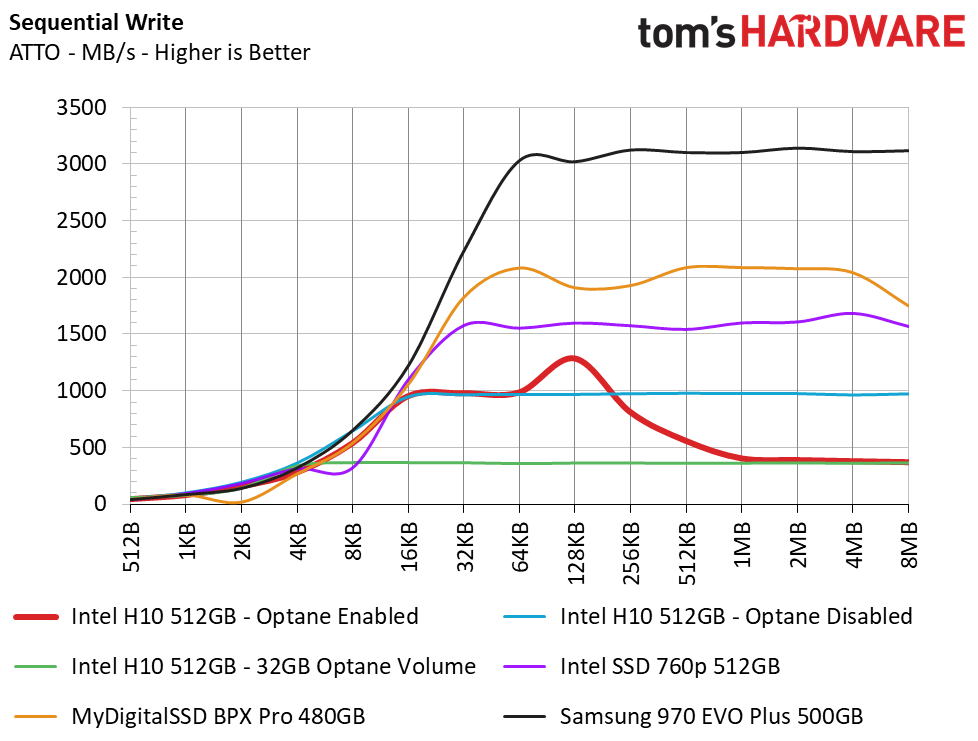
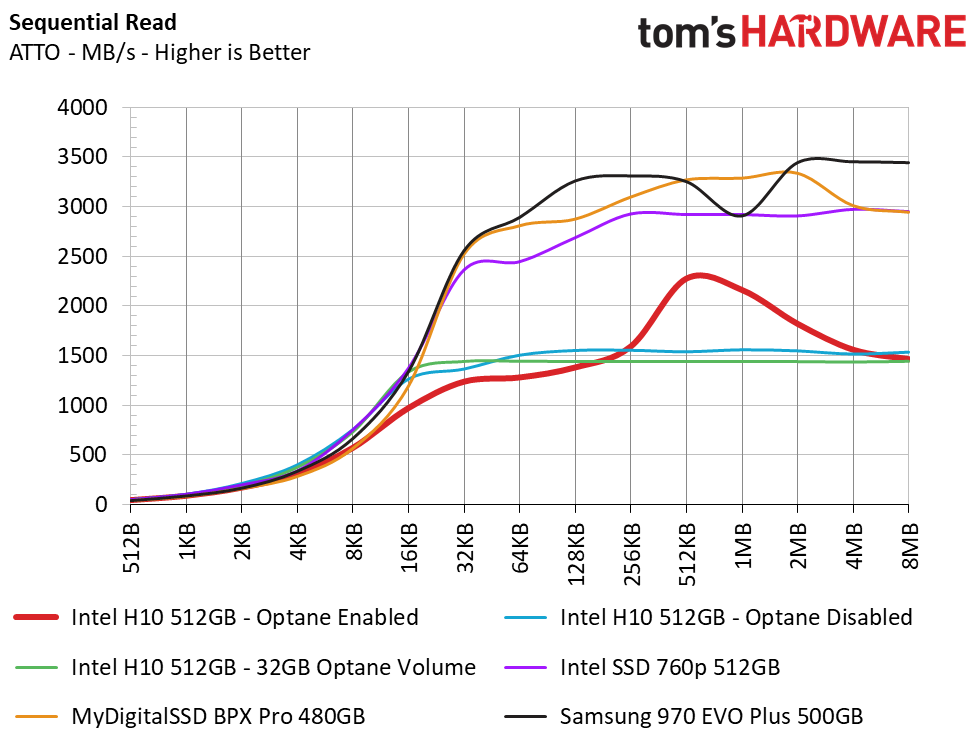
In ATTO, our results look a bit strange with Optane enabled, but this is due to how the benchmark works versus how real data is actually read and written. In this test, the H10 hit its rated sequential read speed of 2.4 GB/s. We measured the peak write speed at 1.3 GB/s.
CrystalDiskMark
CrystalDiskMark (CDM) is a simple and easy to use file size benchmarking tool.
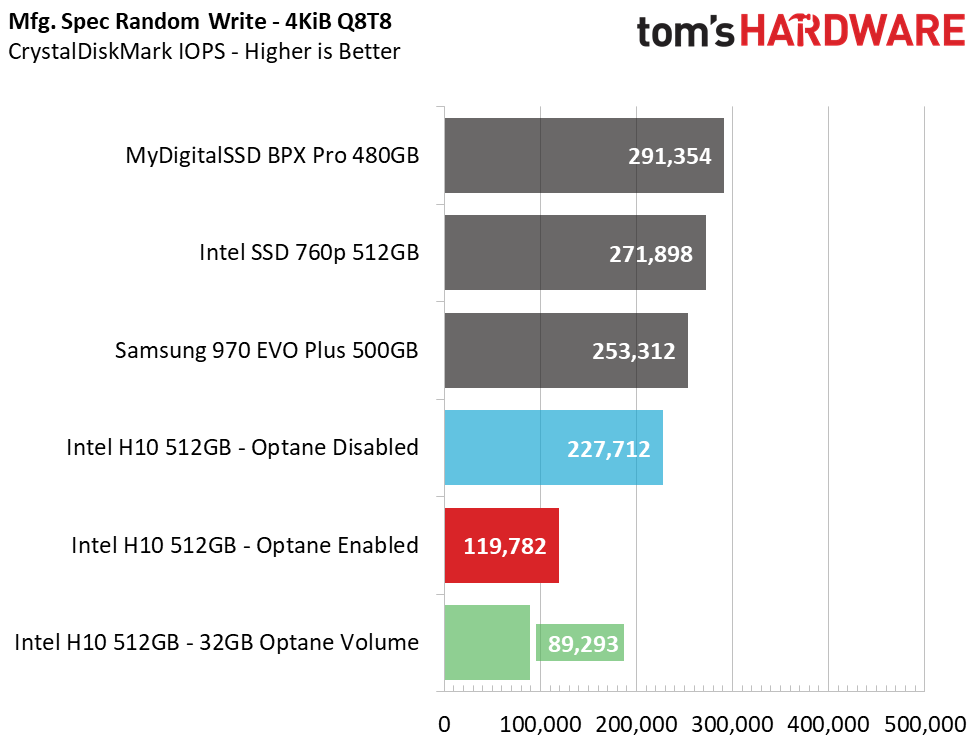
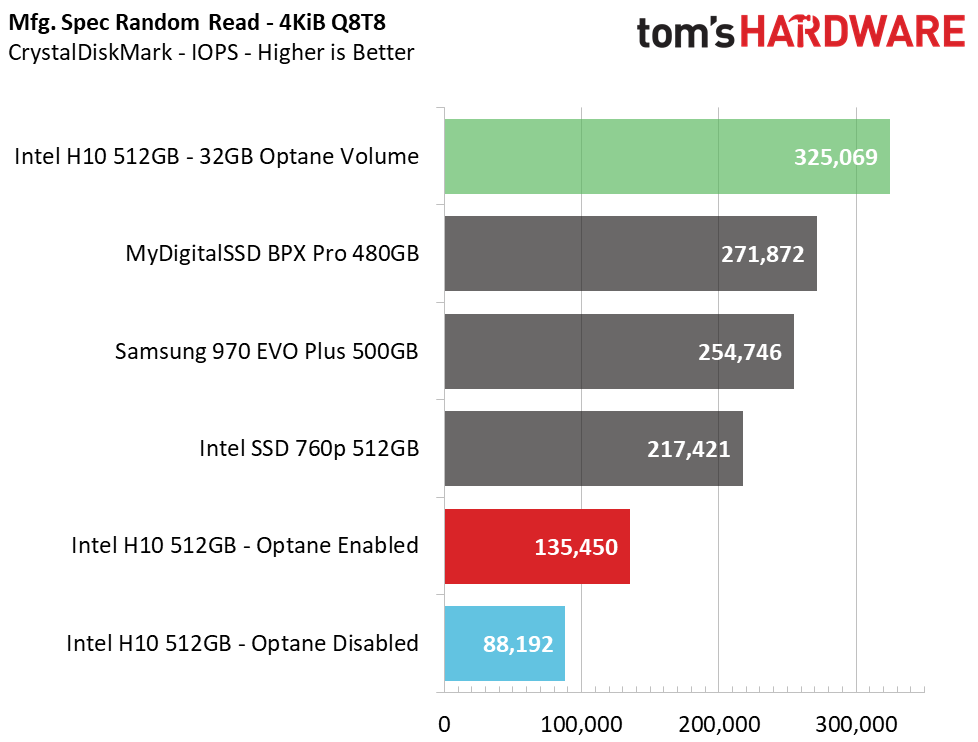
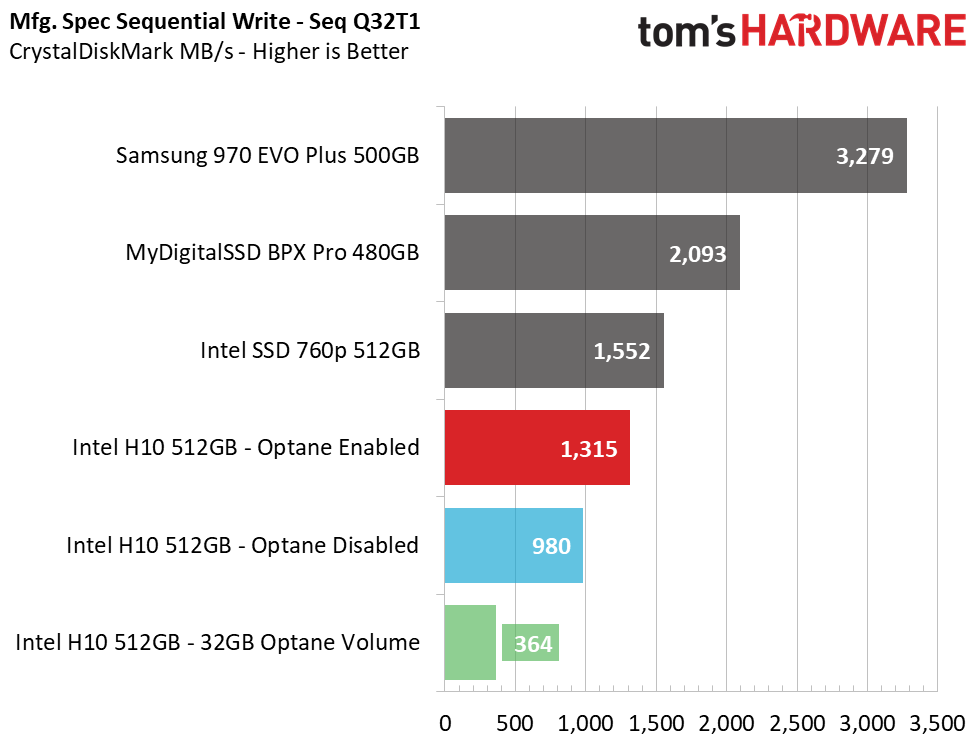
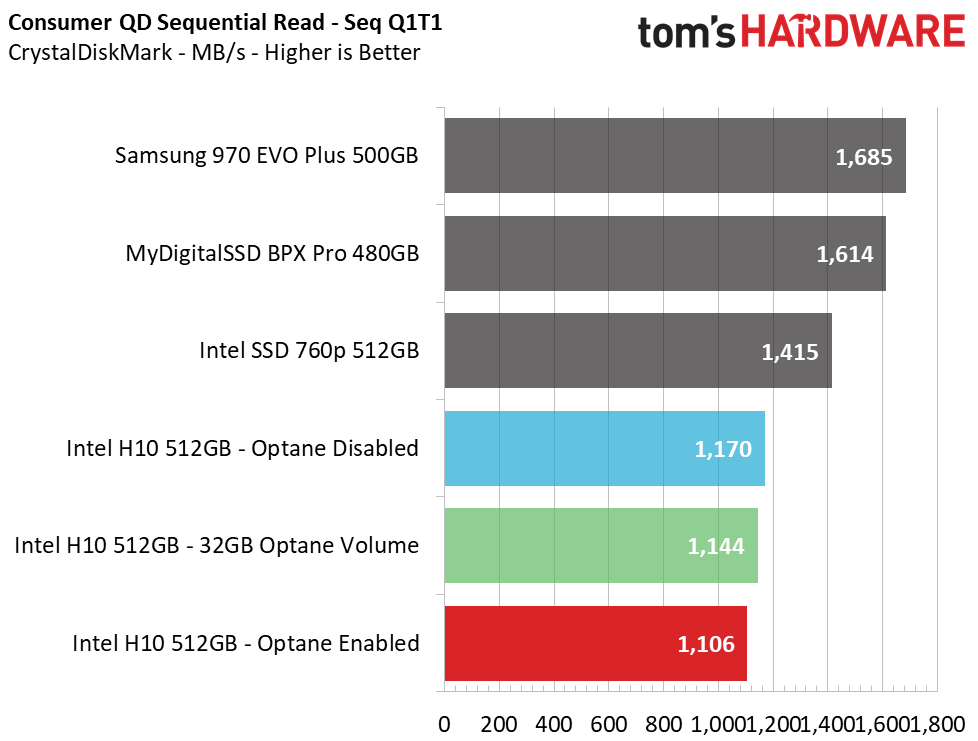
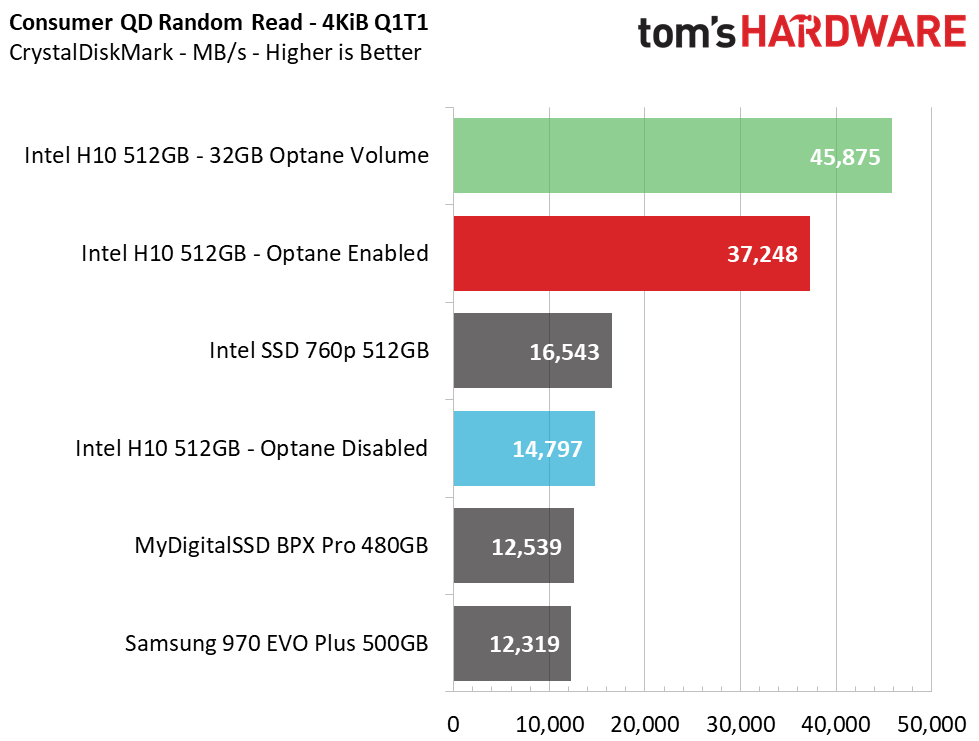
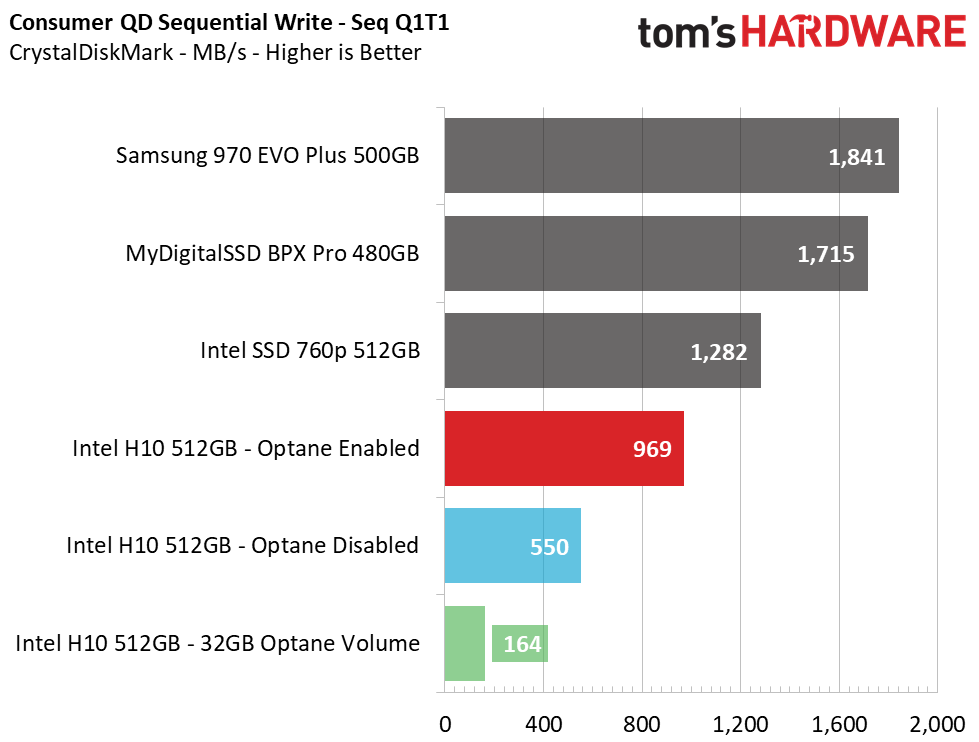
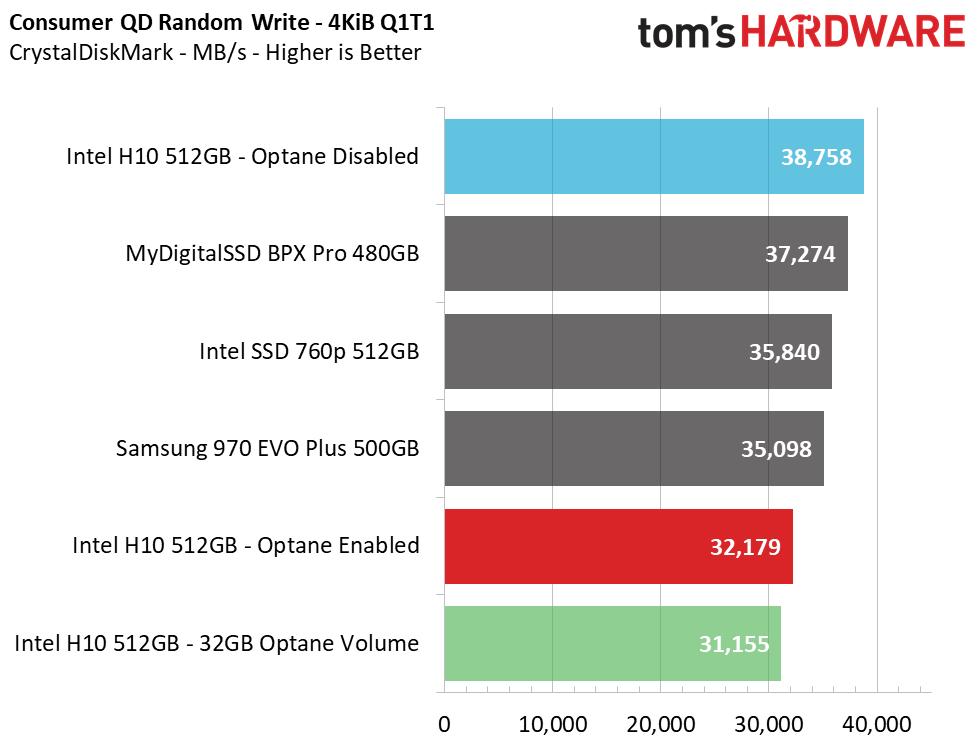
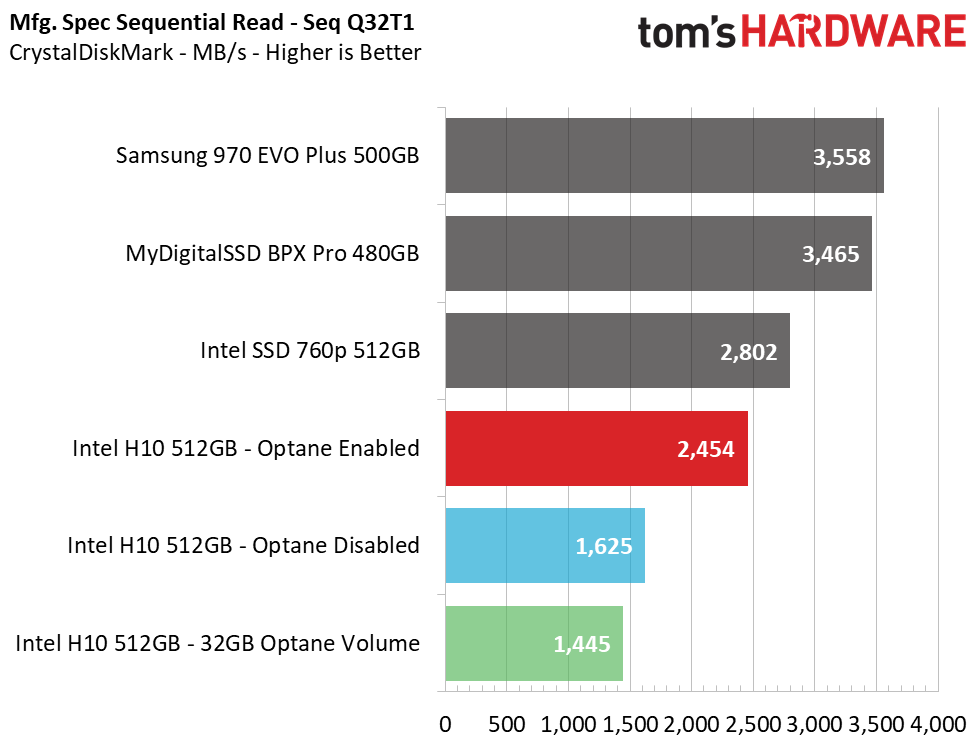
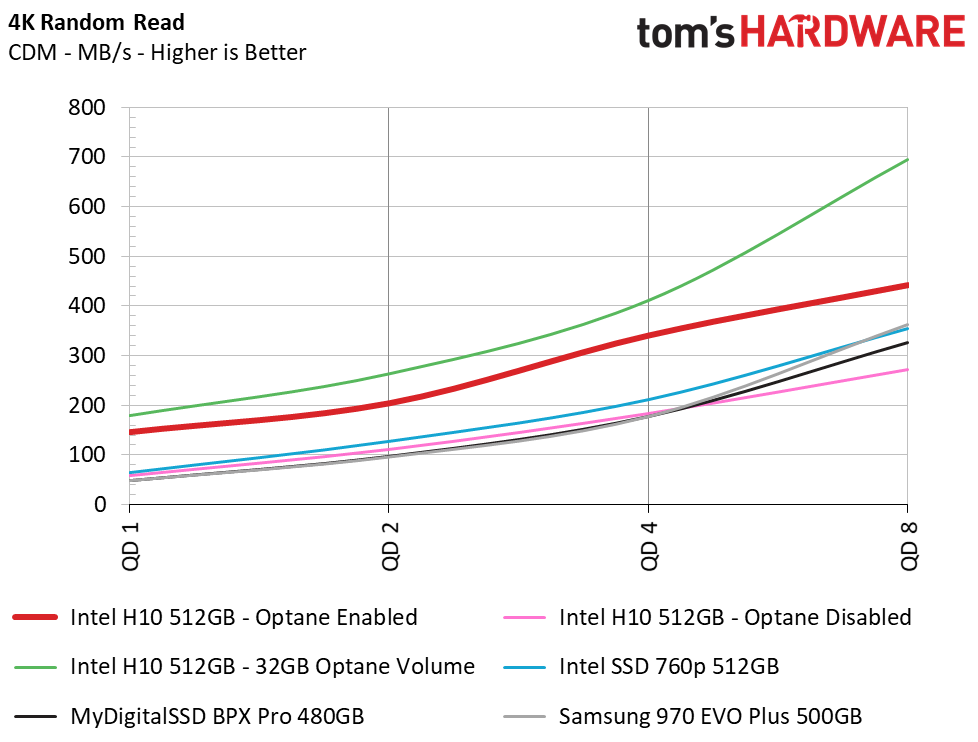
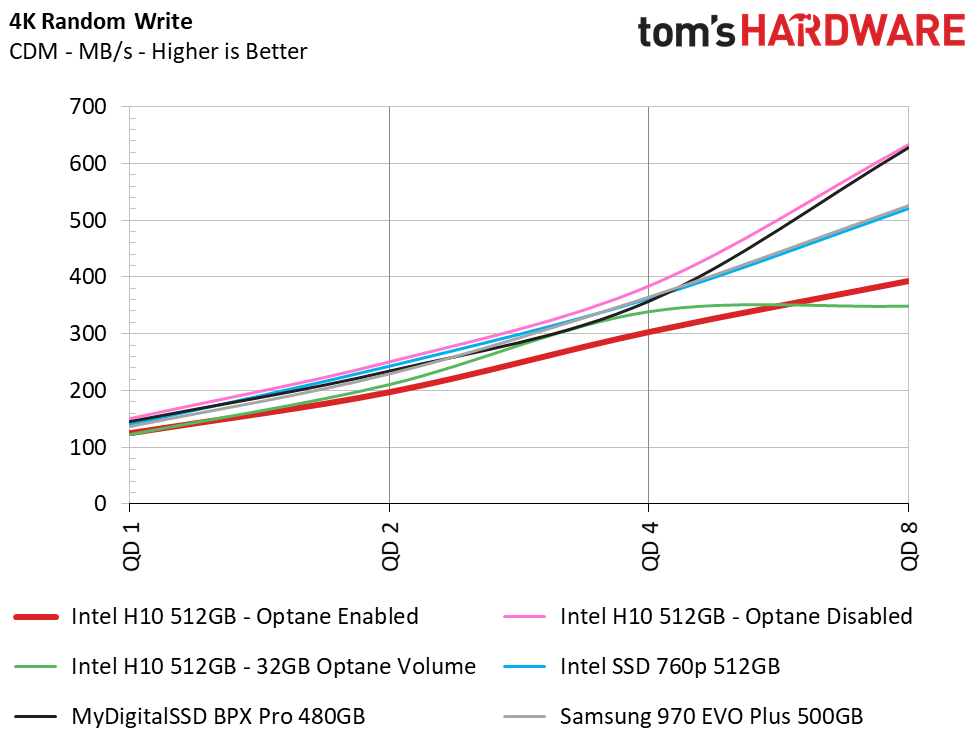
With CrystalDiskMark, we recorded similar sequential performance of up to 2.4/1.3 GB/s read/write. At a queue depth of 1 (QD1), the most important measure of real-world snappiness, the Optane H10 read at 1.1 GB/s and wrote at almost 1 GB/s.
Like ATTO, CrystalDiskMark doesn’t issue commands exactly like real workloads, so these results aren’t entirely representative of real world usage. During light random reads and writes at QD1, the H10 exceeded it's rated 32,000/30,000 read/write IOPS specification.
Power Consumption
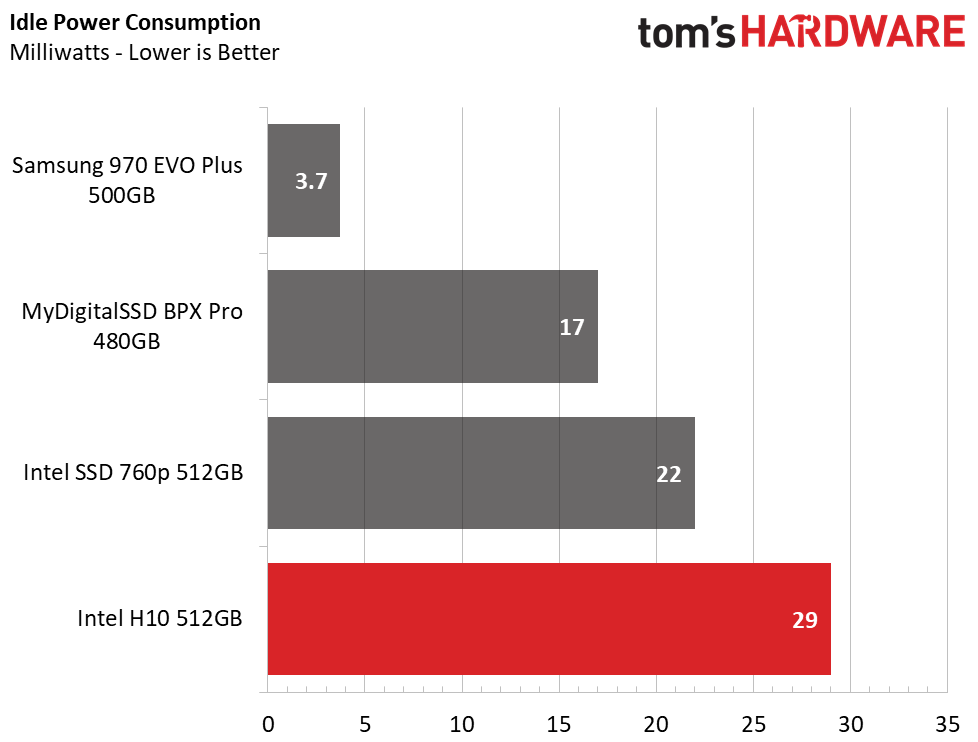
We use the Quarch HD Programmable Power Module to gain a deeper understanding of power characteristics. Idle power consumption is a very important aspect to consider, especially if you're looking for a new drive for your laptop. Some SSDs can consume watts of power at idle while better-suited ones sip just milliwatts. Average workload power consumption and max consumption are two other aspects of power consumption, but performance-per-watt is more important. A drive might consume more power during any given workload, but accomplishing a task faster allows the drive to drop into an idle state faster, which ultimately saves power.
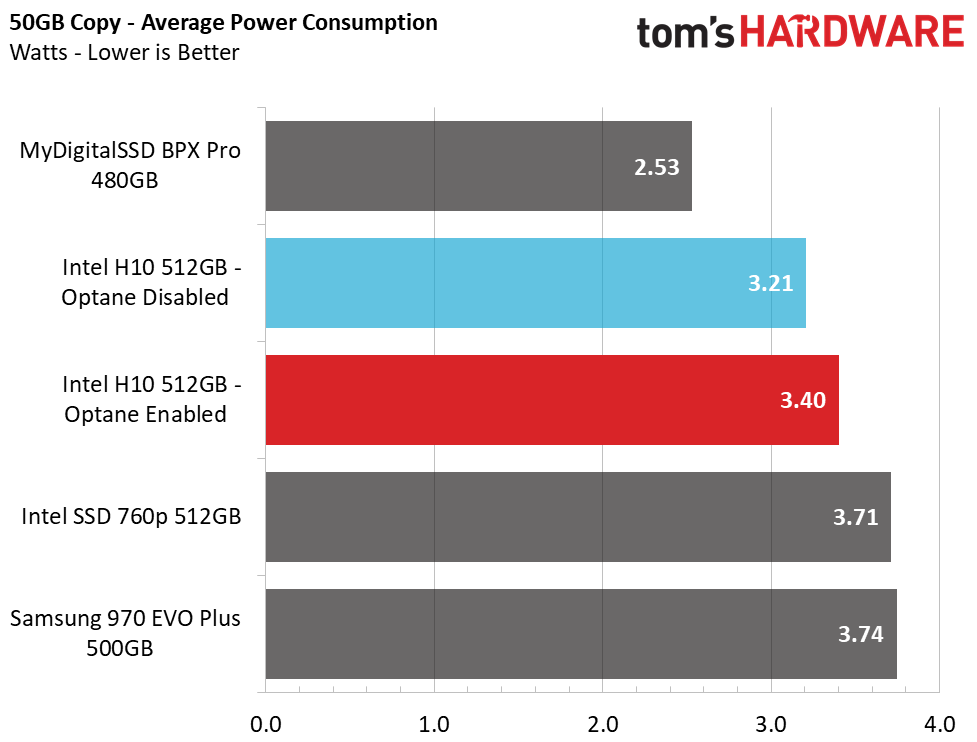
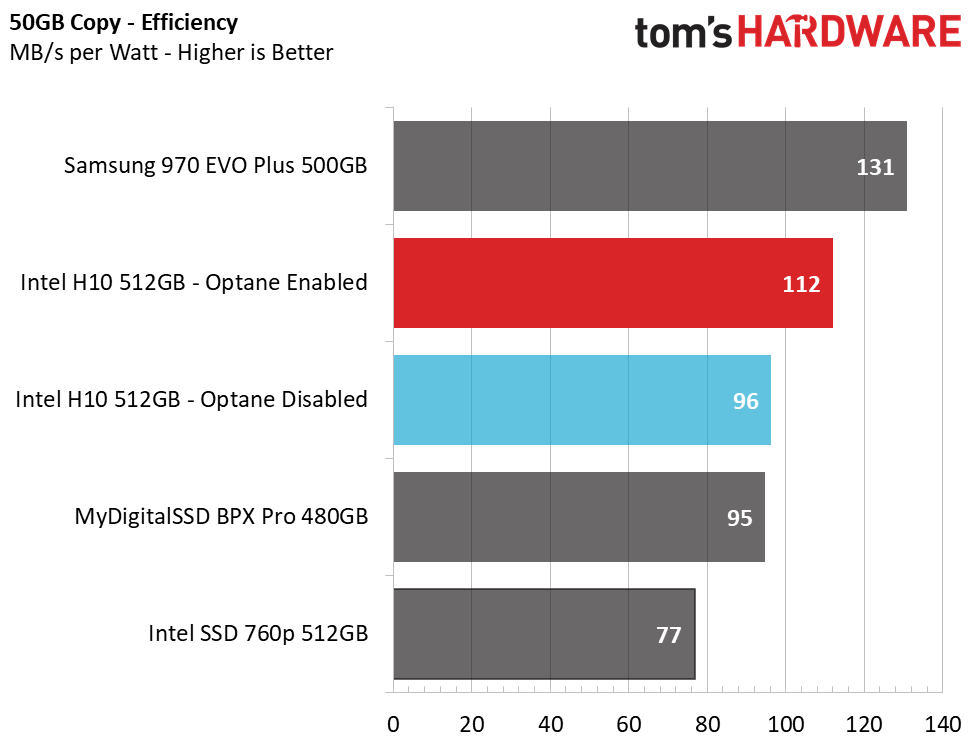
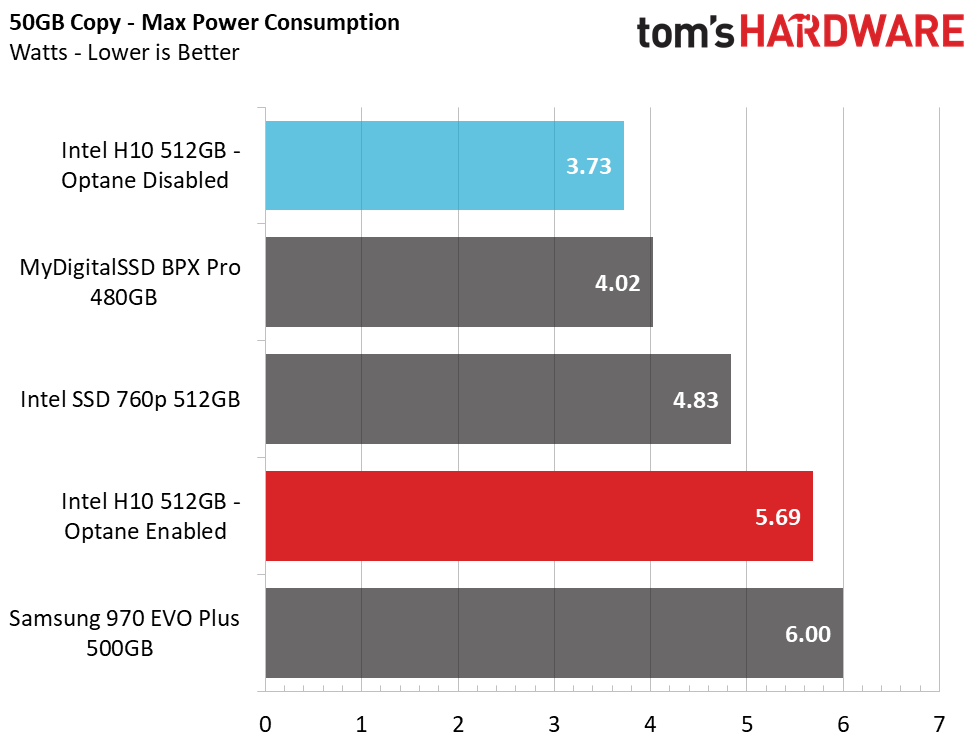
Intel’s H10 is not only peppy, but it is also pretty power efficient with Optane caching enabled. It provided 112 MB/s of performance per watt during our 50GB file transfer, which is a little bit behind the 970 EVO Plus. Even with Optane caching disabled, the H10 outperformed the 760p and BPX Pro.
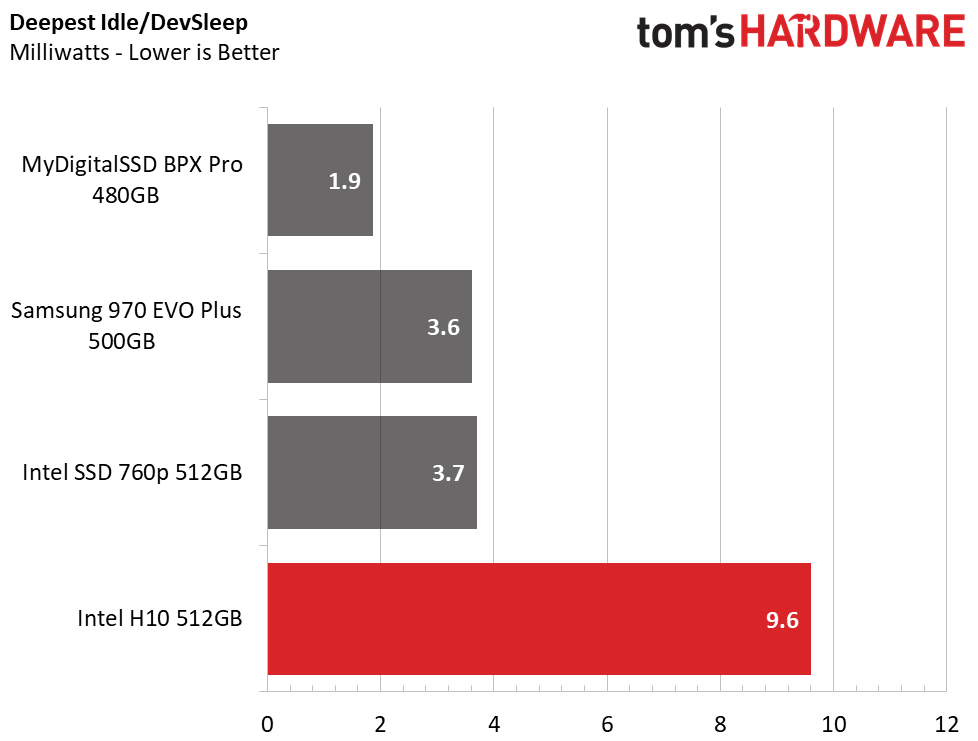
SSDs fall into their two lowest power states when the system is idle. Most of the time the drives switch between active and idle power states (DevSleep), but the Samsung 970 EVO skipped directly to DevSleep as soon as it began idling. Intel’s 760p stayed at its second-lowest power state at 25mW for longer than any of the other SSDs before it fell into DevSleep. But after enough time (8-10 minutes), all the drives fell into the lowest power state.
The Intel H10 consumed 9.6mW in DevSleep, which is under the official rating of <15mW. While this is great considering it has two separate controllers onboard, competing drives still consumed less idle power. The Phison E12-powered BPX Pro consumed the least at just 1.9mW.
MORE: Best SSDs
MORE: How We Test HDDs And SSDs
MORE: All SSD Content
Current page: 512GB Performance Results
Prev Page Optane Memory to Speed Up QLC NAND Next Page Conclusion
Sean is a Contributing Editor at Tom’s Hardware US, covering storage hardware.


