Intel Kaby Lake Core i7-7700K, i7-7700, i5-7600K, i5-7600 Review
Results: Rendering And Office Applications
Benchmark Selection and Practical Aspects
We could have just taken the easy route and used synthetic benchmarks. However, they would have primarily shown just one thing, which is that there’s nothing to show.
Comparing equivalent models of Skylake and Kaby Lake at the same clock rate shouldn’t yield different results. Intel’s saying that there are a few small upgrades, but it’s questionable if they're enough for a measurable performance gain in real-world applications.
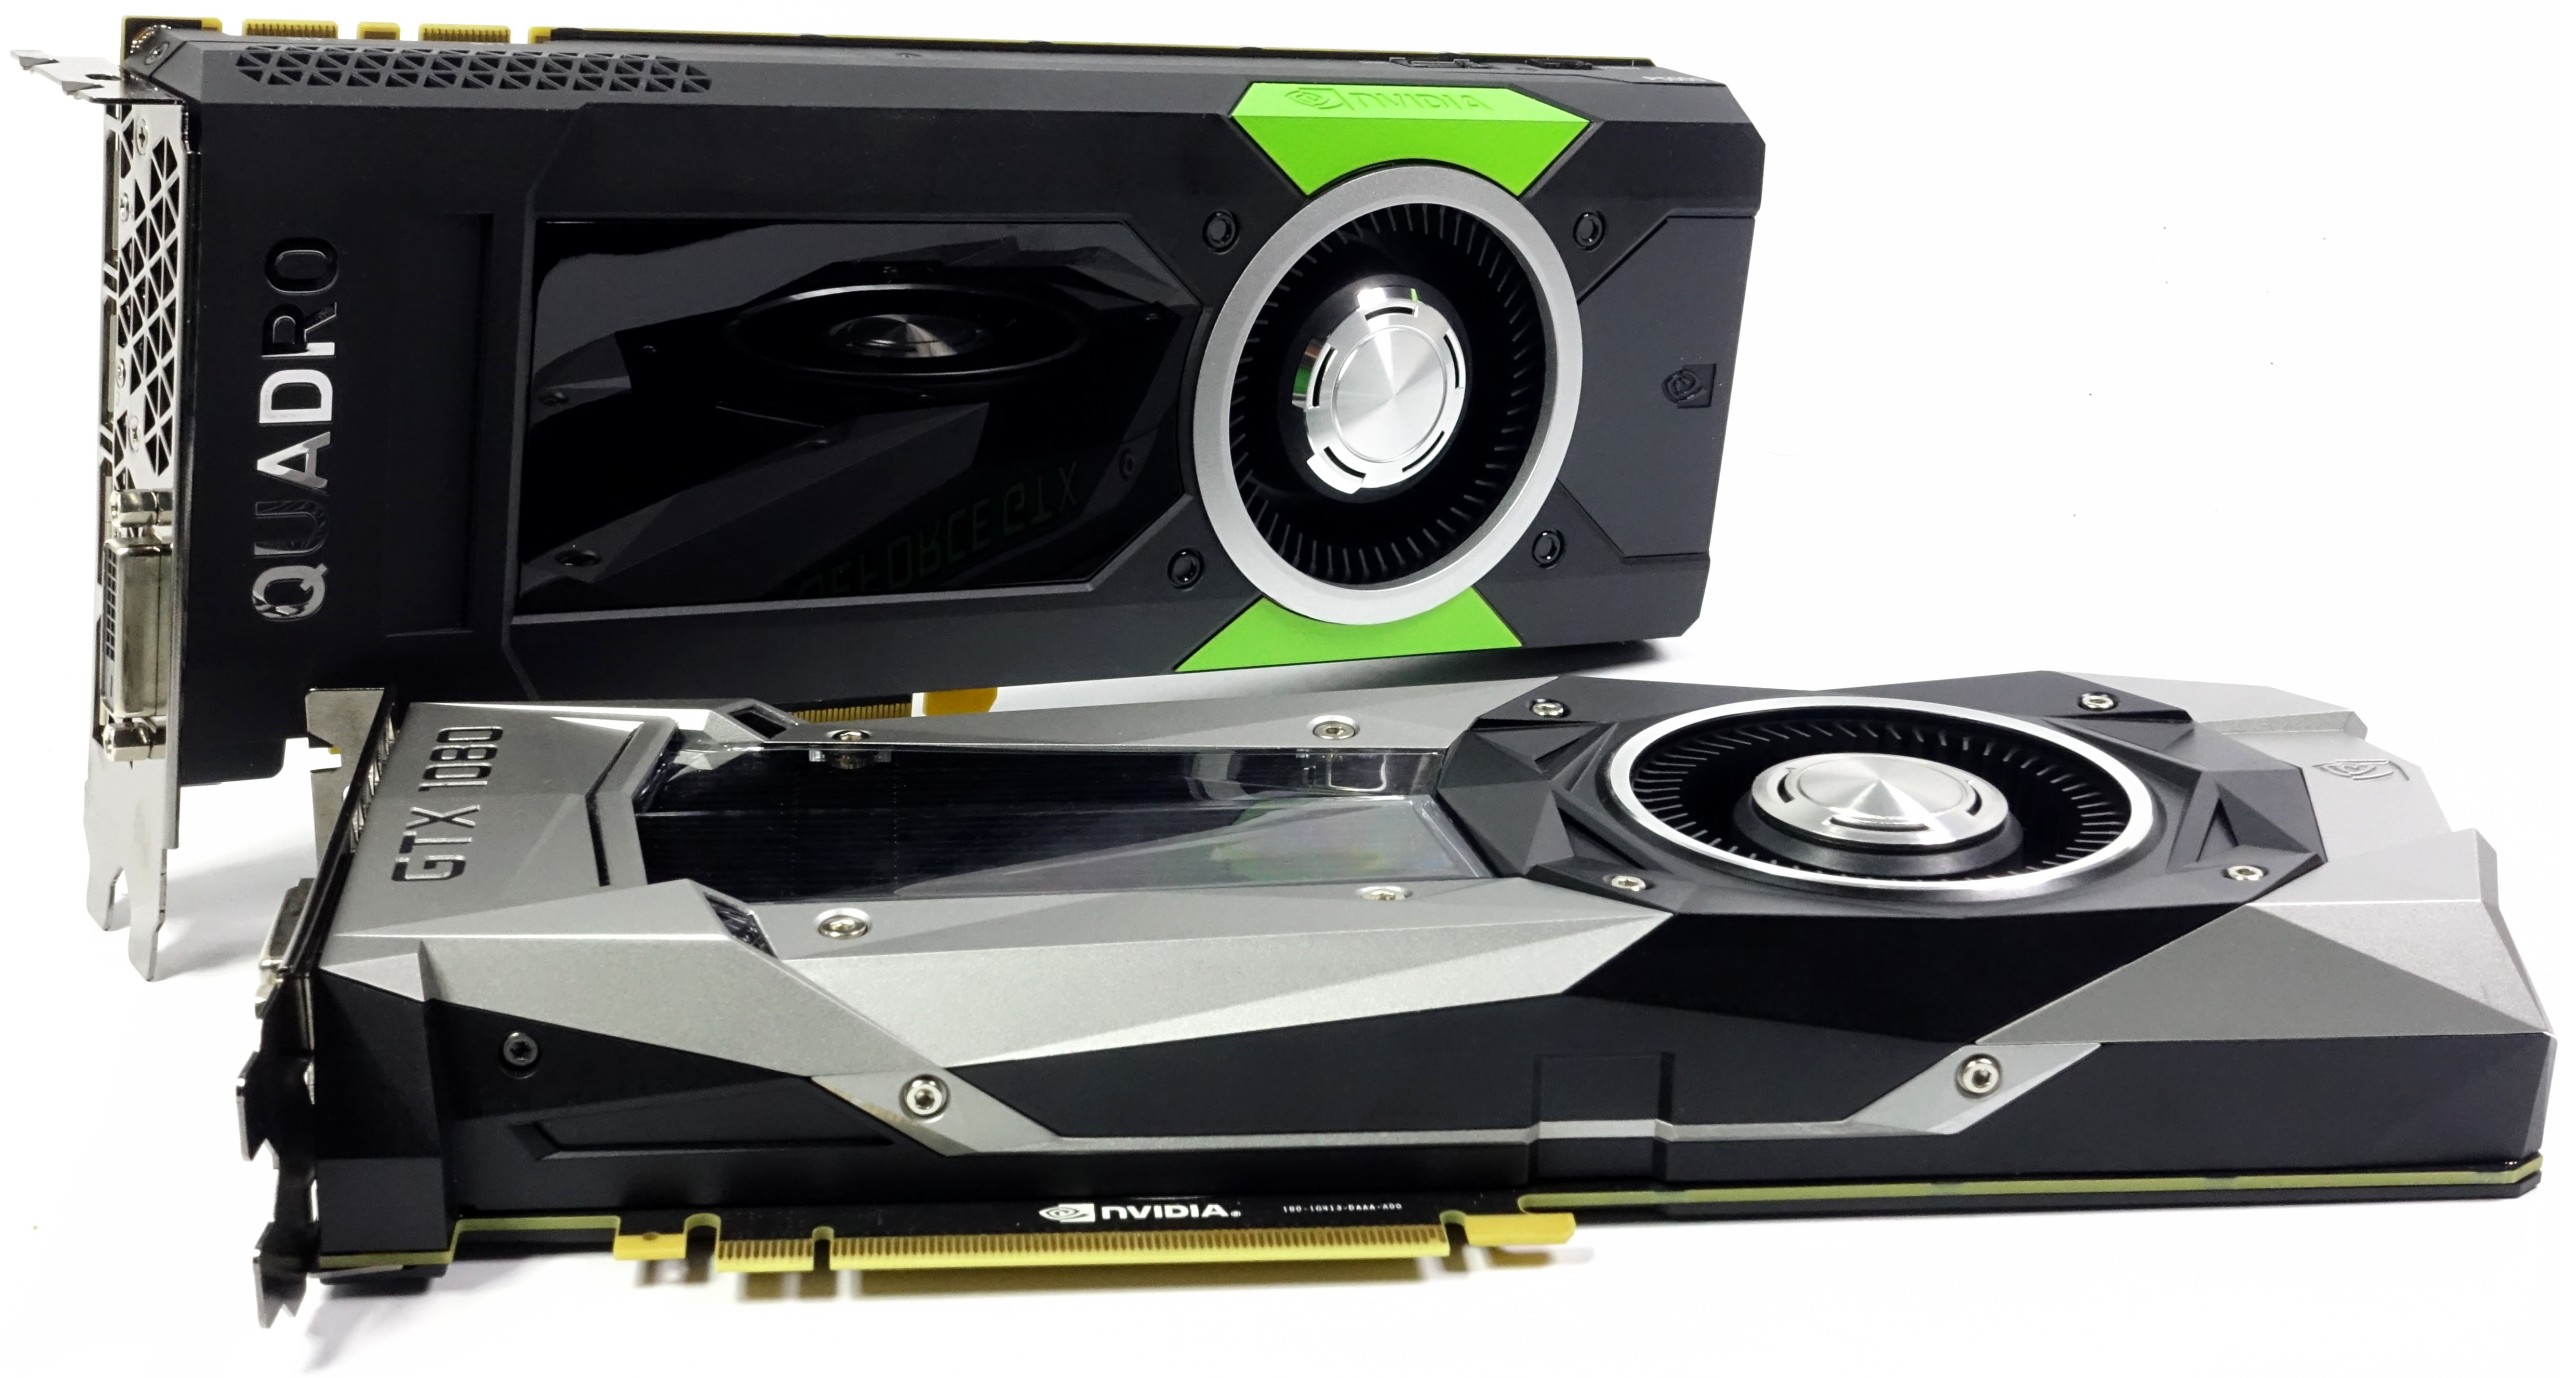
We used several gaming benchmarks and high-end workstation applications. For those titles with a 3D output, we also needed a graphics card that wouldn't limit the CPUs we're testing. Consequently, we settled on the similar-performing GeForce GTX 1080 FE and Quadro P5000, switching back and forth between them since some software requires certified drivers.
There’s a reason that we like using applications that represent the industry standard. This way, we get results that are representative of actual performance. These tests generally run for a long time and across several different iterations, which makes their results much more reliable.
We tested the four larger Kaby Lake CPUs and their predecessors from Intel’s Skylake family. All of the latter were tested twice: at stock clock rates and then overclocked to their Kaby Lake counterparts’ frequencies. Intel’s Core i7-4790K and AMD’s current flagship, the FX-9790, rounded out the field. It will become clear from the graphs that adding more CPUs at the bottom end would have been pointless.
Rendering: Blender and the “Ryzen” Workload
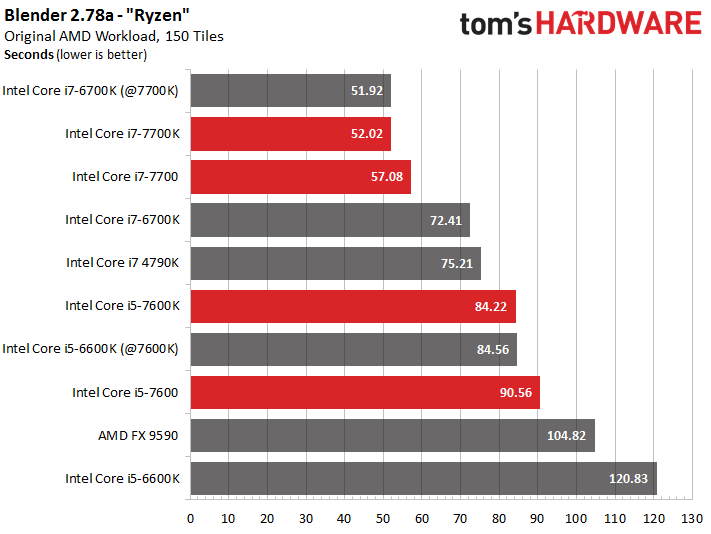
It’s too bad that Ryzen’s not out yet, since it would have given AMD a boost in this competition. The company did publish an official benchmark, though. In it, a Ryzen CPU at 3.4 GHz (without Turbo) should be as fast as an Intel Core i7-6900K. We followed AMD’s lead and used Blender Version 2.78a and the company's render project with the corrected 150 tiles. AMD provides the latter as a free download.
The maximum number of concurrent threads running at the highest possible frequency is the key to success in this benchmark.
Get Tom's Hardware's best news and in-depth reviews, straight to your inbox.
It’s plain to see that the Kaby Lake and Skylake CPUs perform similarly as long as their clock rates are the same. Any performance gains observed using the new generation are due to their higher frequencies, and not due to architectural changes.
Rendering: Cinebench R15
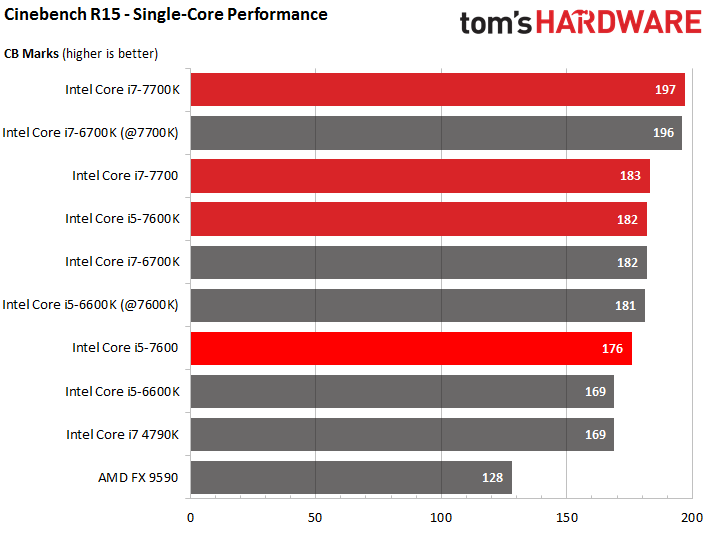
Cinebench R15 by Maxon’s another great benchmark for comparing your own results to ours. It’s nice that this benchmark provides both multi-core and single-core performance results.
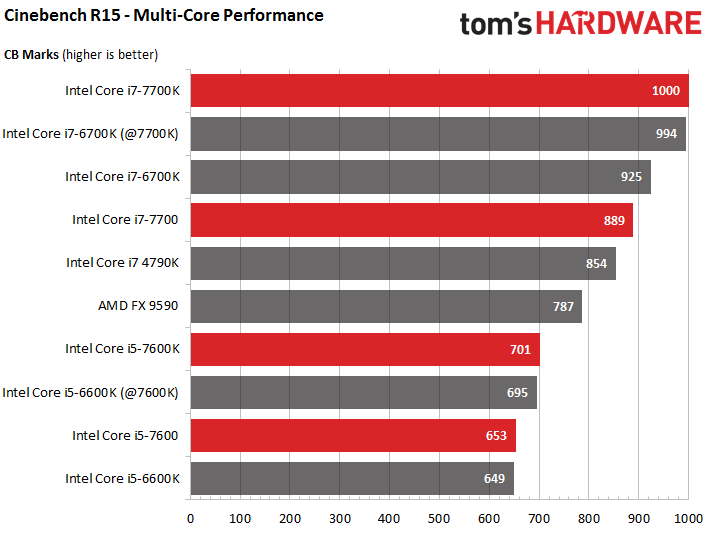
The multi-core results turn out as expected, with the maximum number of concurrent threads running at the highest clock rate winning the competition. AMD’s FX-9590 ends up in the middle of the pack, even though a lot of power is needed to get there.
Interestingly, Cinebench R15’s one of the few benchmarks in which the overclocked Skylake-based Core i5 beats the Kaby Lake equivalent. This isn’t due to measurement error. We ran the benchmark several times just to be sure.
Switching to a single-threaded workload changes the game quite a bit. AMD’s FX-9590 and Intel’s Core i7-4790K Haswell-refresh suffer massive losses compared to the competition. The small but noticeable difference between Kaby Lake and Skylake is still there.
Microsoft Office 2016
No desktop benchmark suite is complete without Microsoft’s popular Office suite. We’re leaving control over the workloads (as well as computing and reporting the geometrical mean of the three runs per application) to PCMark 8 Professional.
Some might say that benchmarking Microsoft Office 2016 is just about as exciting as watching paint dry. However, many of our readers spend a lot of time with the applications in this package. It'll be interesting to see if Kaby Lake saves us any time in Office.
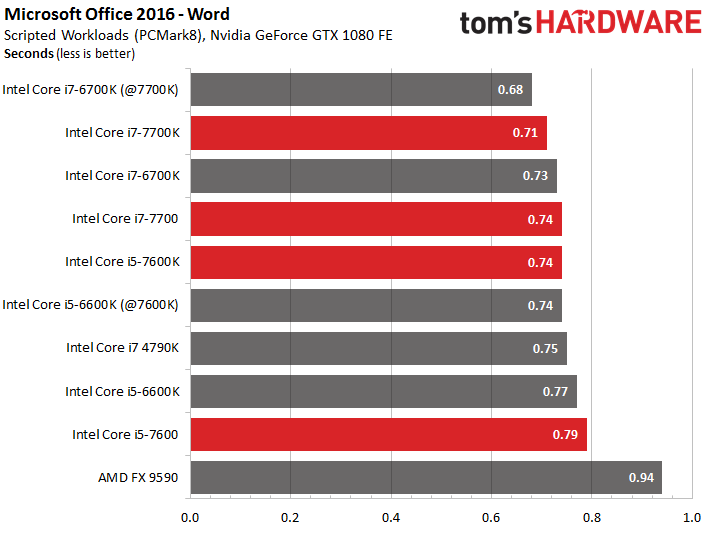
We start with Microsoft Word, which only responds to clock rate. Expensive CPUs with features like SMT aren’t necessary.
| Header Cell - Column 0 | File Size | Pages | Words | Pictures |
|---|---|---|---|---|
| Source Document | 3.25MB | 77 | 17,987 | 5 |
| Target Document | 57MB | 138 | 30,800 | 10 |
| Actions | - Start Application and Open Document - Open Target Document in New Window - Copy Large Part of Original Document to Target Document - Save Target Document with New File Name - Expand Target Document's Window - Cut and Paste Large Part of Target Document - Save Target Document Again - Text Input with Simulated Delay - Save Target Document Again - Insert Pictures in Target Document - Save Target Document Again and Close Application |
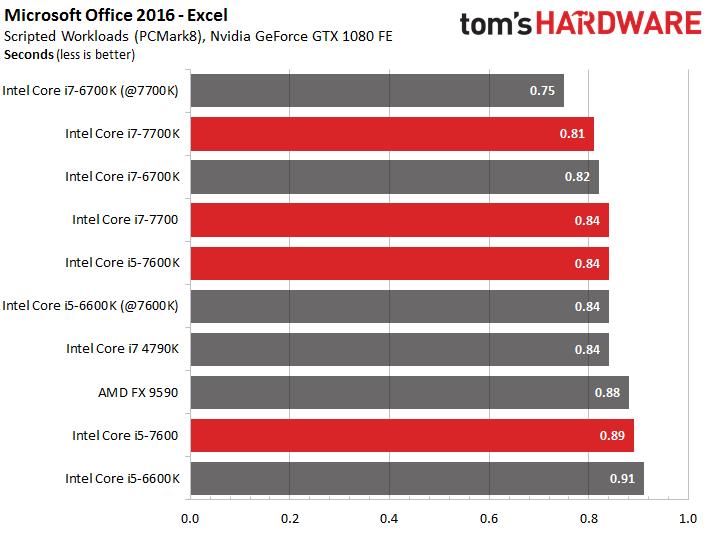
Microsoft Excel is a bit pickier. In larger workloads, performance doesn’t just depend on frequency, but also on the number of threads. Even a dinosaur like AMD’s FX-9590 does a bit better in this benchmark.
| Header Cell - Column 0 | File Size | Worksheets | Active Cells |
|---|---|---|---|
| Source Files | 4.62MB2.33MB | 4 | 240,800 |
| Target File | 4.18 MB | 2 | 10,930 |
| Actions | - Start Application and Open All Three Worksheets - Open All Workbooks - Expand Application Window - Copy Data from Original to Target Workbook with Formula Evaluation - Copy Data from Original to Target Workbook without Formula Evaluation - Copy From Cells with Formulas - Copy More Data to Cells with Formula Evaluation - Insert Specific Values in Three Cells with Formula Evaluation - Save Target Document and Close Application |
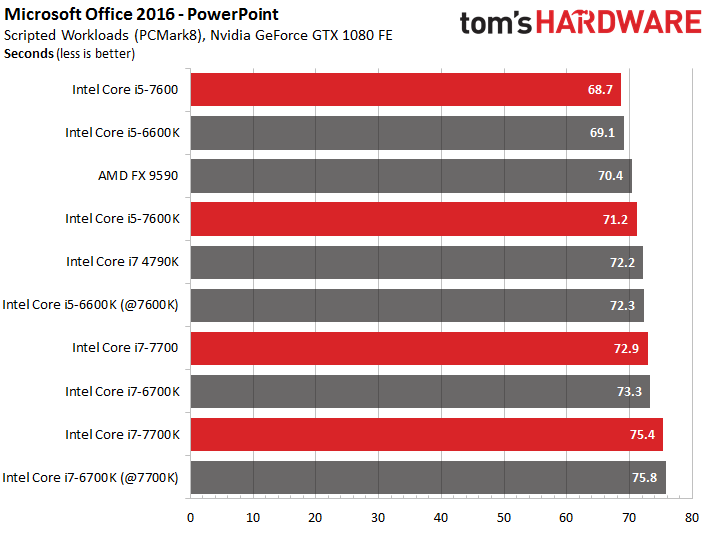
Microsoft PowerPoint provides completely different results. No matter what we did, the finishing order stayed the same, which is to say that it practically reversed compared to what we saw before. Intel’s newer Core i7s seem to be at a disadvantage due to SMT, of all things. Microsoft PowerPoint can’t make use of multiple cores and ends up having nothing but problems with the new setup.
Disabling SMT actually gives the Core i7-7700K a performance boost. Still, even the higher clock rate isn’t enough to propel it to the top. We think that the lower core-to-core latencies of the lower-clocked models might be the reason for their advantage. It also looks like Kaby Lake’s able to inch out the older competition at the same clock rates. The differences are tiny, though.
| Header Cell - Column 0 | File Size | Slides | Pictures |
|---|---|---|---|
| Source File | 27.1MB | 15 | 12 |
| PDF Export | 2.83MB | 16 | 13 |
| Actions | - Start Application and Open Presentation - Expand Application Window - Browse Slides (Looking at Them Simulated with Pauses) - Add New Slide - Insert and Cut Picture - Insert Text - Save Document - Export to PDF and Close the Application |
Our Microsoft Office benchmarks turned out to be more eventful than using the suite during a normal workday. However, practically speaking, lower-end CPUs cost most Office users less money without negatively affecting their productivity.
Current page: Results: Rendering And Office Applications
Prev Page Test Setup Next Page Results: Workstation Applications
Igor Wallossek wrote a wide variety of hardware articles for Tom's Hardware, with a strong focus on technical analysis and in-depth reviews. His contributions have spanned a broad spectrum of PC components, including GPUs, CPUs, workstations, and PC builds. His insightful articles provide readers with detailed knowledge to make informed decisions in the ever-evolving tech landscape
-
Based on our initial testing, we can confirm that HD Graphics 630 does not function correctly under Windows 7 and 8.1. Both operating systems install generic drivers for the display adapter, even after applying the latest drivers and updates, so many core features remain unavailable. We also experienced stability issues with Windows 7 that might even negate using an add-in GPU as a workaround.Reply
Not true, i setup Kaby Lake in my lab and everything works fine under Windows 7. Did you guys even try to apply drivers for HD Graphic 630? -
adgjlsfhk It would have been kind of nice to see igpu vs gtx 750 and other low end discrete graphics cards, but other than that, great review.Reply -
cknobman Boooooooooooooooooring.Reply
Bring on the new AMD cpu's!!!
Oh, nice review the boring is not Toms fault ;) -
Jim90 "Intel’s slow cadence of incremental upgrades hasn’t done much to distance its products from AMD's.Reply
"...Obviously we need a competitive AMD to help reinvigorate the desktop PC space."
Without real competition the only risk Intel takes with the Desktop market is to loose sight of (i.e. actively ignore) the performance jump the consumer expects in a new release. Continual and lengthy minor incremental updates (pretty much what we've seen since the 2000 series) may well lead to consumer apathy. I certainly haven't upgraded 'as much as I could!' recently. Absolutely no justifiable need.
Then again, perhaps we've all had access to enough power we need? We used to talk about 'killer apps/software' to drive consumers into making a purchase. This certainly did work. Maybe new tech (currently available) isn't killer enough? We need another '3dfx Voodoo' experience?
VR is certainly (definite?) a potential driver...here's hoping for speedy and significant updates here. -
Paul Alcorn Reply19098433 said:Based on our initial testing, we can confirm that HD Graphics 630 does not function correctly under Windows 7 and 8.1. Both operating systems install generic drivers for the display adapter, even after applying the latest drivers and updates, so many core features remain unavailable. We also experienced stability issues with Windows 7 that might even negate using an add-in GPU as a workaround.
Not true, i setup Kaby Lake in my lab and everything works fine under Windows 7. Did you guys even try to apply drivers for HD Graphic 630?
Hello, yes we did test and attempt to install the HD Graphics 630 drivers. We are working with early BIOS revisions, so it is possible that we encountered a platform-specific issue. Can you share which motherboard you used for your testing? Any feedback is welcome.
-
ohim Why are they even releasing this ? It makes absolutely no sense to release such a product ...Reply -
redgarl Reply19098782 said:Why are they even releasing this ? It makes absolutely no sense to release such a product ...
Probably to make a statement of some kind.
-
FormatC Reply
You really have drivers for the Z270 chipset with official support of Windows 7 from intel and Microsoft? I tried it also and was not able to run KL with all features on a W7 installation. It runs, somehow. :)19098433 said:Not true, i setup Kaby Lake in my lab and everything works fine under Windows 7. Did you guys even try to apply drivers for HD Graphic 630? -
valeman2012 Just notice that people that are using these CPU you need Windows 10 to have everything working 100%.Reply
