Intel SSD 540s Review - Our First Look At The SM2258
Intel scored SMI's new SM2258 controller under an exclusive contract and paired it with SK hynix 16nm TLC flash for the new SSD 540s. Intel geared the 540s to attack the low-cost segment, but performance is always a key issue, so let's put it to the test.
Why you can trust Tom's Hardware
Benchmarks And Comparisons
Comparison Products
The price of the Intel SSD 540s falls in line with mainstream products, but the performance specifications match entry-level SSDs. That stated, we chose to use the entry-level performance test pool for this performance comparison. The mainstream SSD market has shrunk over the last year. TLC flash prices are in a free-fall, but MLC prices are increasing simultaneously as production shifts to high-capacity, instead of high performance, NAND.
The Adata SP550 uses the previous generation SMI SM2256 controller paired with SK Hynix TLC flash. The drive closely resembles the Intel SSD 540s we're testing. It joins the Crucial BX200, MyDigitalSSD BP5e and OCZ Trion 150 (now officially called TR150) in the entry-level comparison group.
The Mushkin Reactor and Samsung 850 EVO are the two mainstream SSDs on the list that we compare to the Intel SSD 540s.
To read about our storage tests in-depth, please check out How We Test HDDs And SSDs. Four-corner testing is covered on page six of our How We Test guide.
Sequential Read Performance
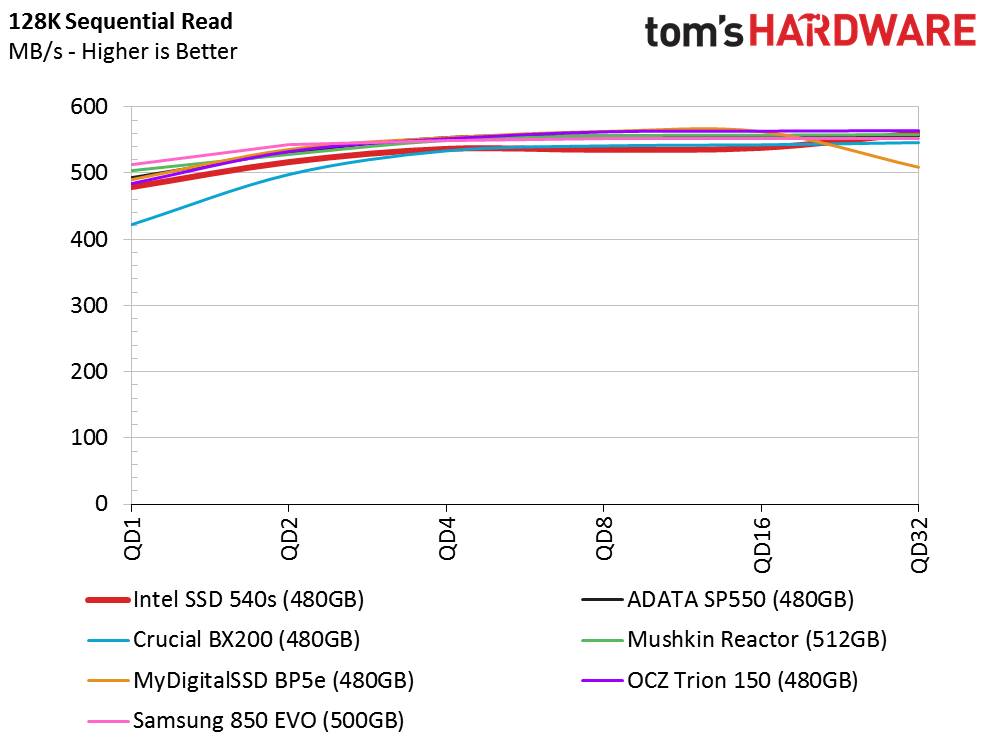
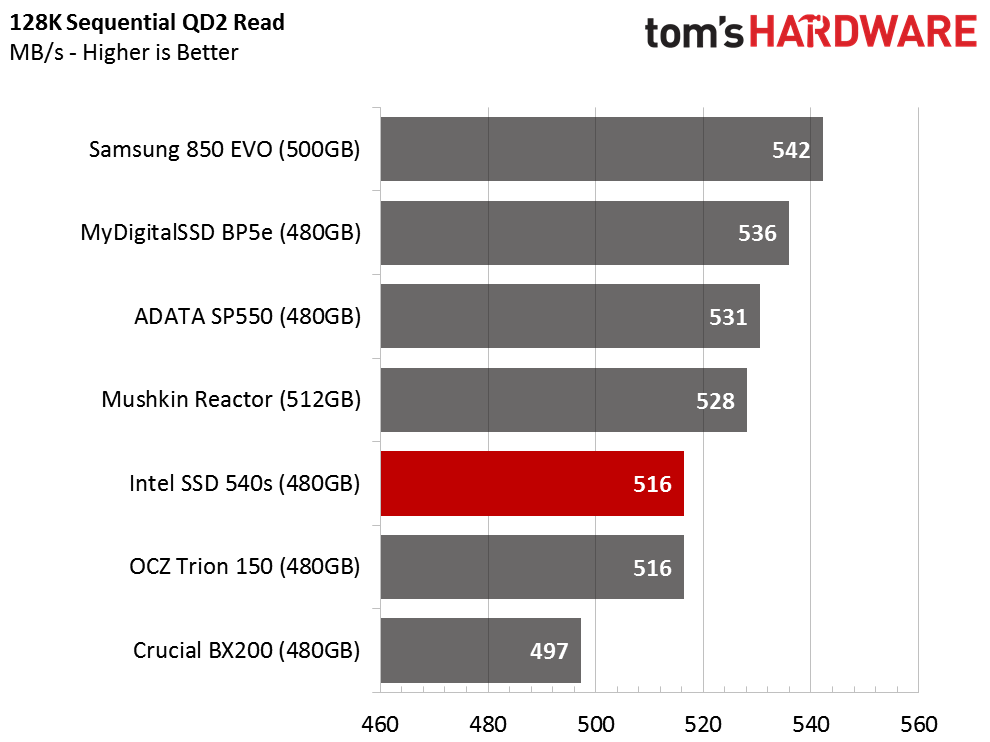
Reading data sequentially from the flash is one of the easiest tasks for an SSD. All of the devices perform well at high queue depths, but we find variation at the lighter queue depths, which is where desktop and notebook operating systems perform most of the read operations. We isolated queue depth 2 performance and found that nearly all of the products achieve over 500 MB/s at this key threshold. The Intel SSD 540s landed near the bottom of the chart with 516 MB/s.
Sequential Write Performance
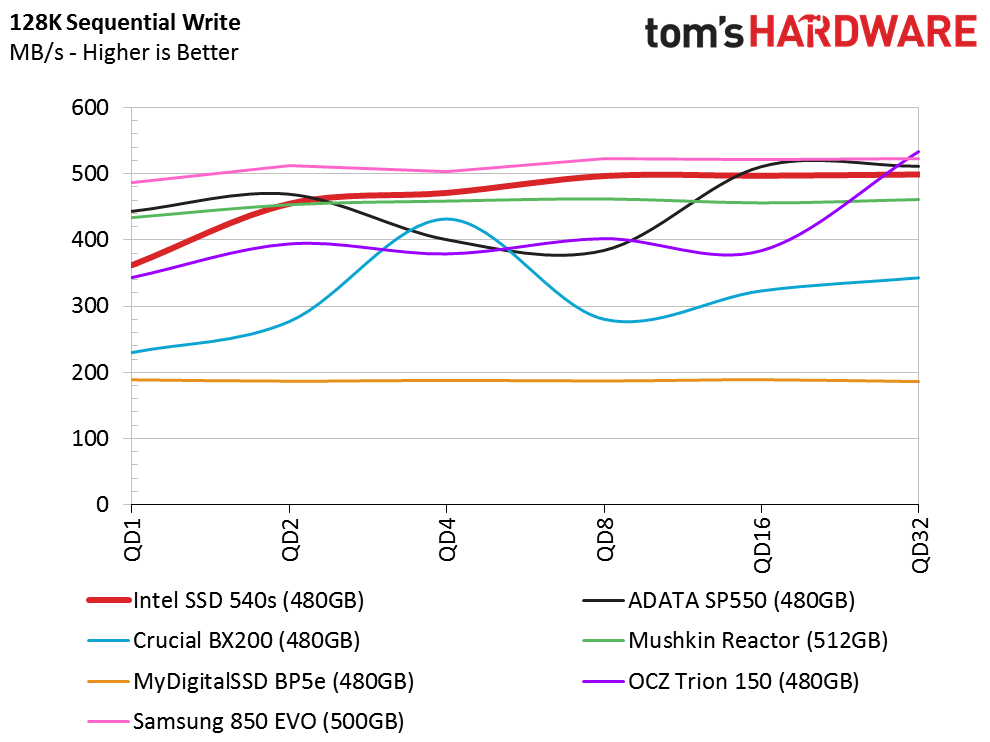
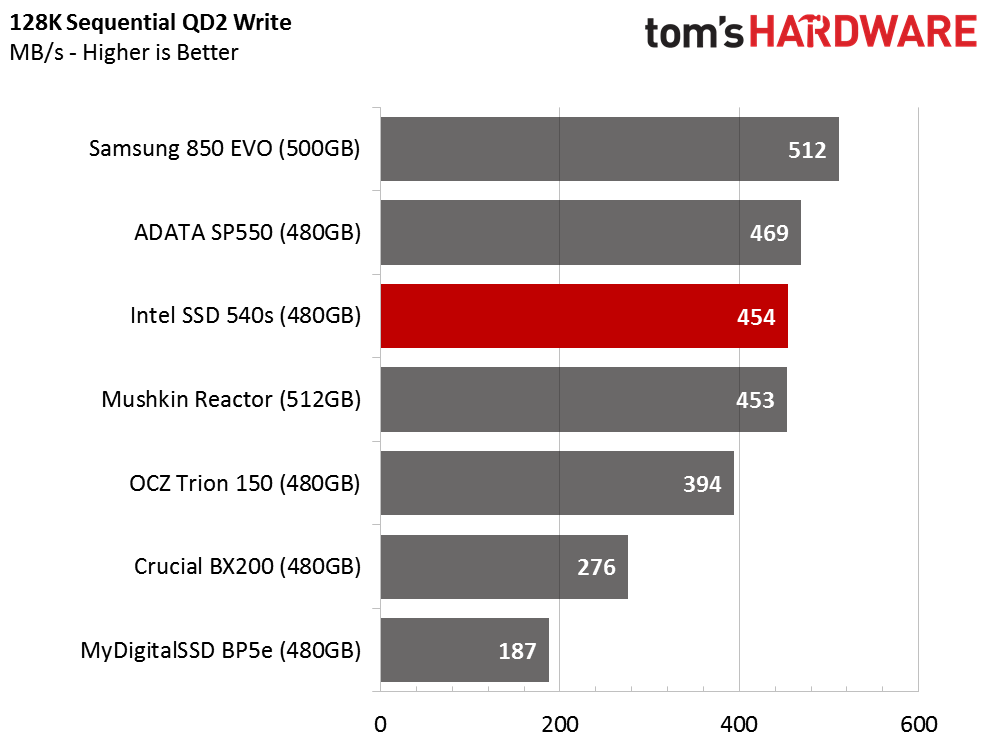
We see much more performance variation during the sequential write test. Many of the drives on the chart utilize a two-tier approach for storing incoming write data. The SSD has a small SLC buffer area of the flash that operates in one-bit-per-cell mode. The SSD writes data to this area first, which increases write performance. Unfortunately, the SLC buffer consumes three times more capacity compared to TLC flash, so SSD vendors limit the size of the buffer. The SSD migrates the data from SLC to the slower three-bit per cell (TLC) NAND when it depletes the SLC portion of the flash. Users do not notice the transition if the SLC buffer is large enough.
Each company uses a different algorithm. Phison innovated a new direct-to-die write system for writing data directly to the TLC area. This MyDigitalSSD BP5e and OCZ Trion 150 use this technique.
Get Tom's Hardware's best news and in-depth reviews, straight to your inbox.
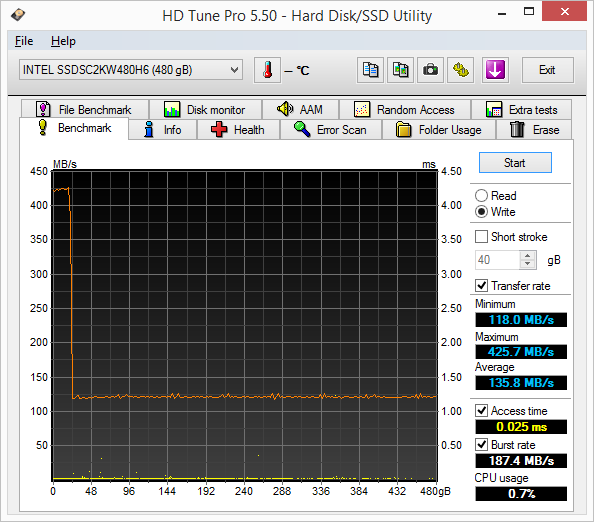
Here we see a test that writes 128 KB sequential data to the full user space of the Intel SSD 540s. The native TLC transfer performance, which occurs outside of the SLC buffer, measures around 135 MB/s. The performance is high enough to accept a file transfer at full speed over a gigabit Ethernet connection.
Random Read Performance
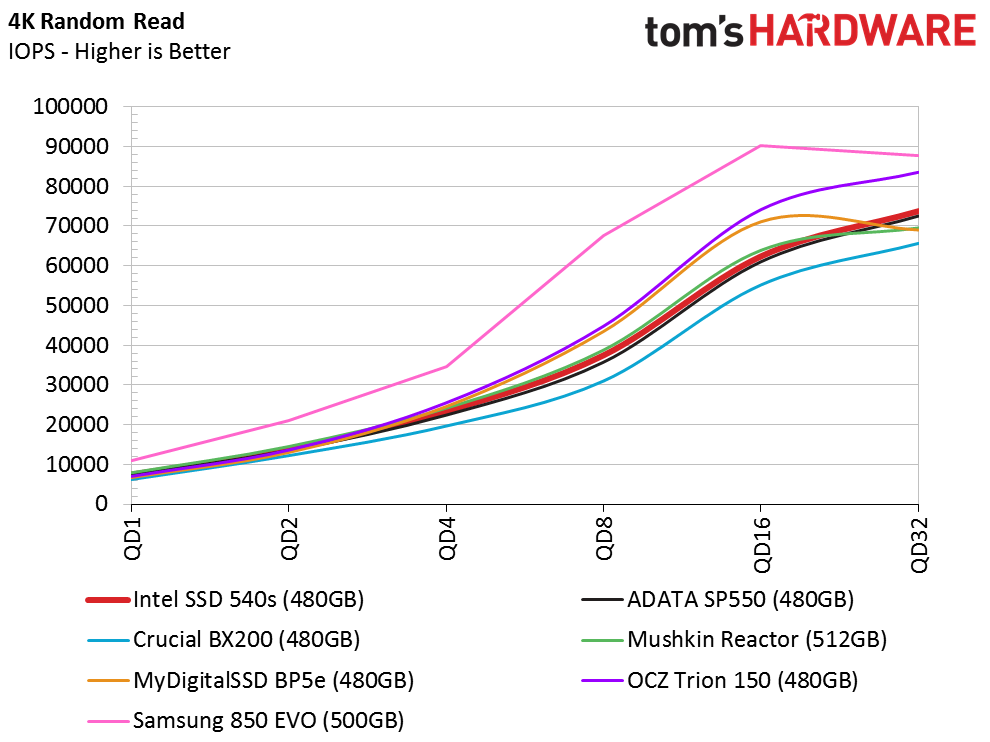
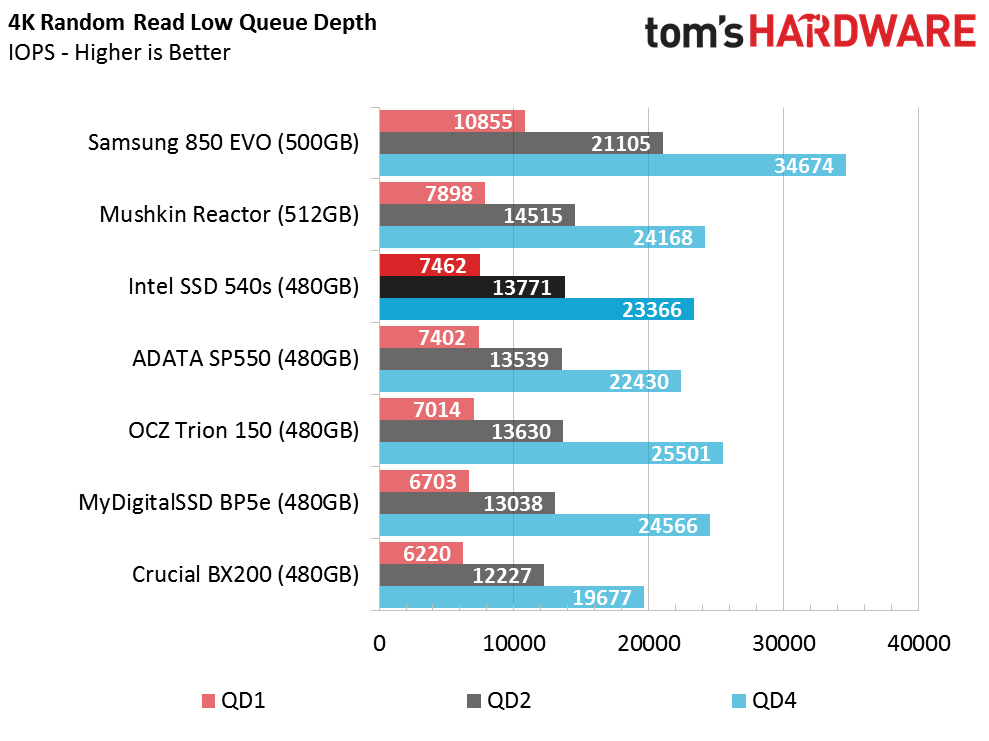
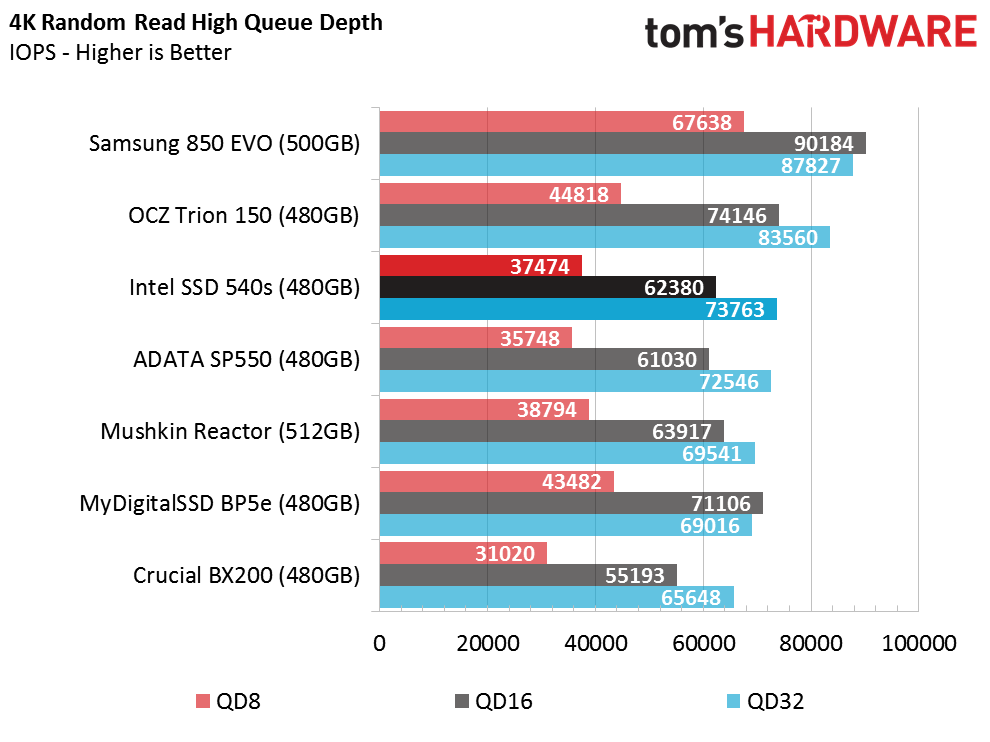
There is very little separation during random reads at low queue depths, with the exception of the Samsung 850 EVO 500 GB. The Intel SSD 540s is the fastest non-Samsung SSD using three-bit per cell flash, and it sits just behind the performance of the MLC-powered Mushkin Reactor 512 GB at a queue depth of one. The 540s scales well as the queue depth increases, but it fails to reach the 850 EVO's performance.
Random Write Performance
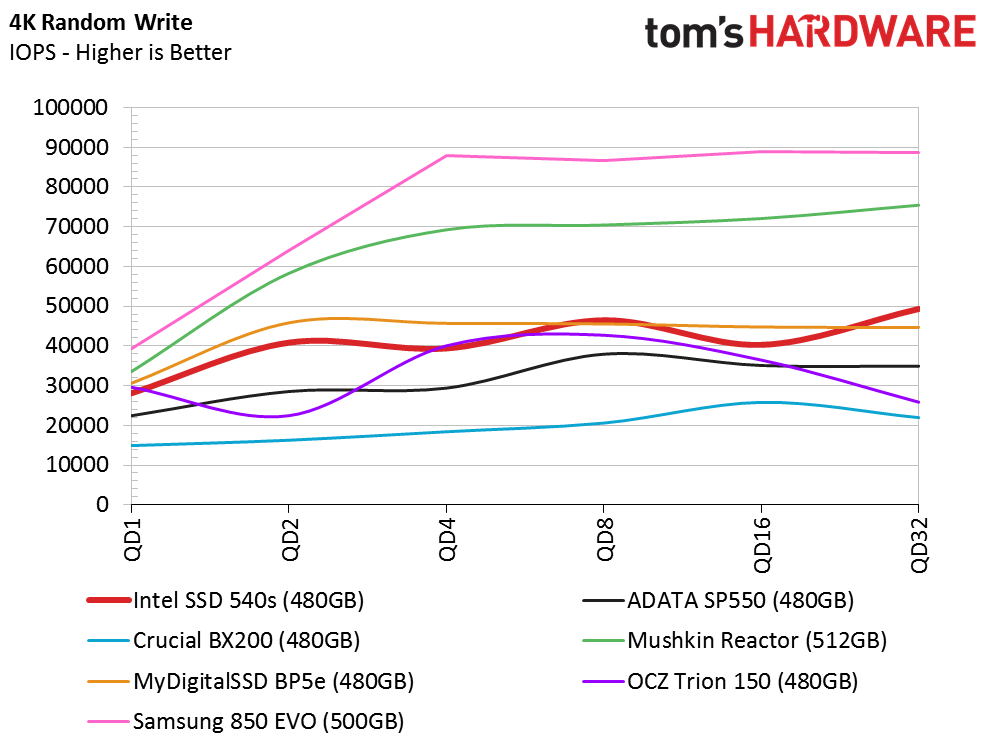
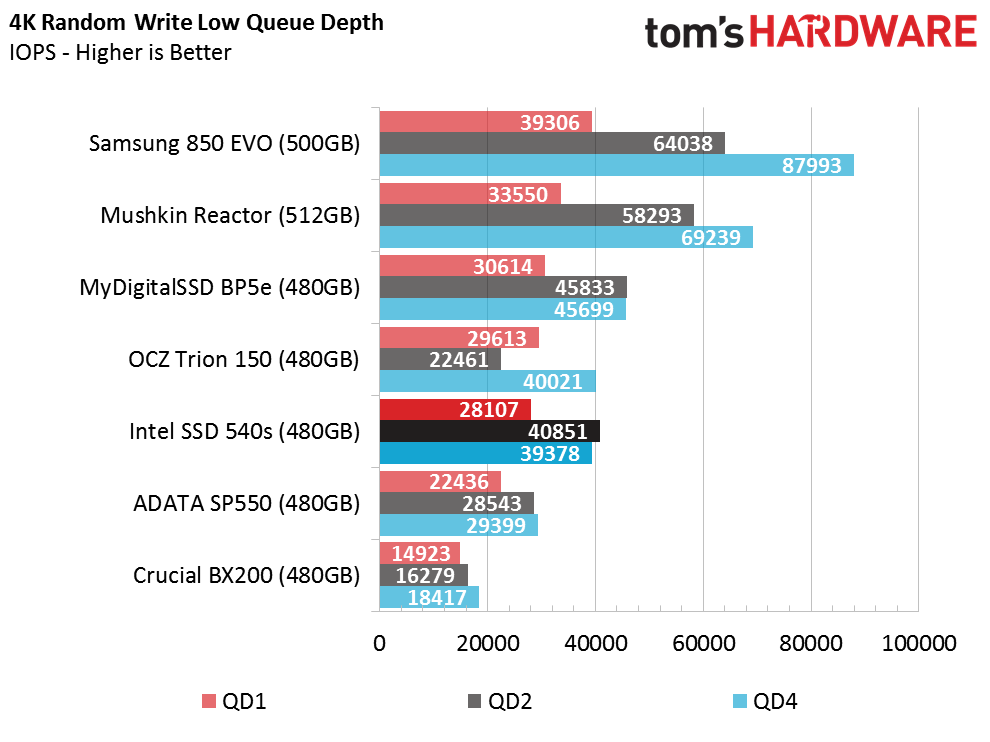
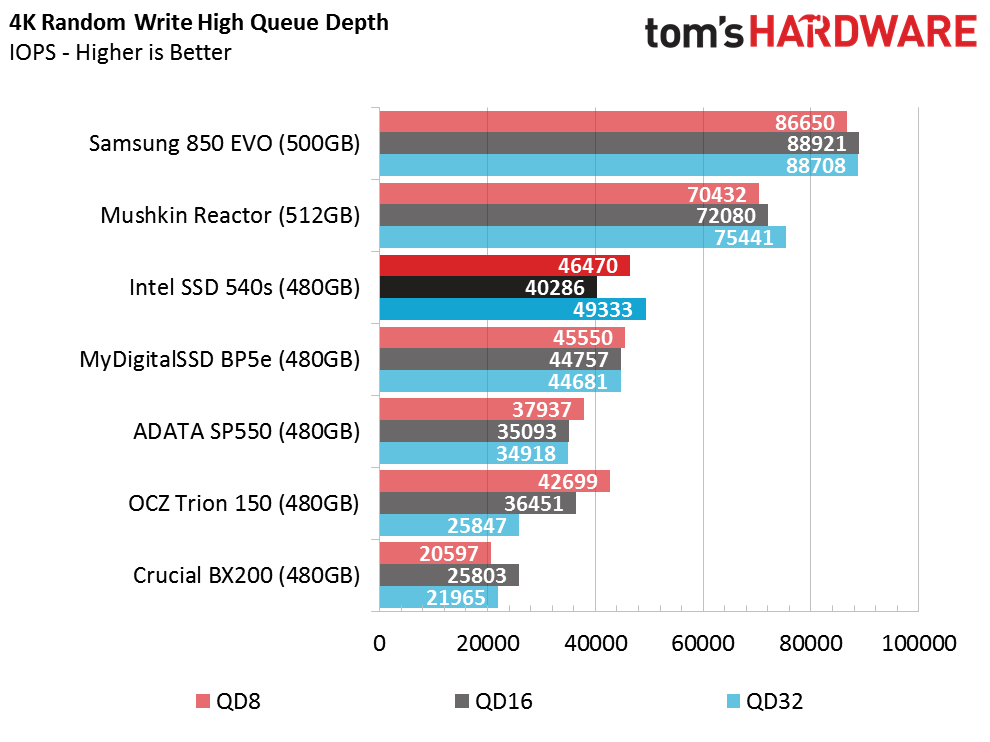
The Intel SSD 540s with the SMI SM2258 delivers higher random write IOPS than the Adata SP550, which uses the previous generation SM2256 controller and similar SK Hynix flash memory. We suspect the newer SM2258 controller is nearly identical to the SM2256 aside from a clock speed increase, which allows the controller to process data faster. Neither product performs exceptionally well with random data writes, and both trail the class-leading 850 EVO by 10,000 IOPS at queue depth 1.
80 Percent Sequential Mixed Workload
Our mixed workload testing is described in detail here, and our steady state tests are described here.
Intel's 540s marketing documents discuss mixed workload optimizations. We're glad to see the consumer SSD industry stop tuning drives for high benchmark scores with unrealistic workloads and instead focus more on tuning SSDs for real-world workloads.
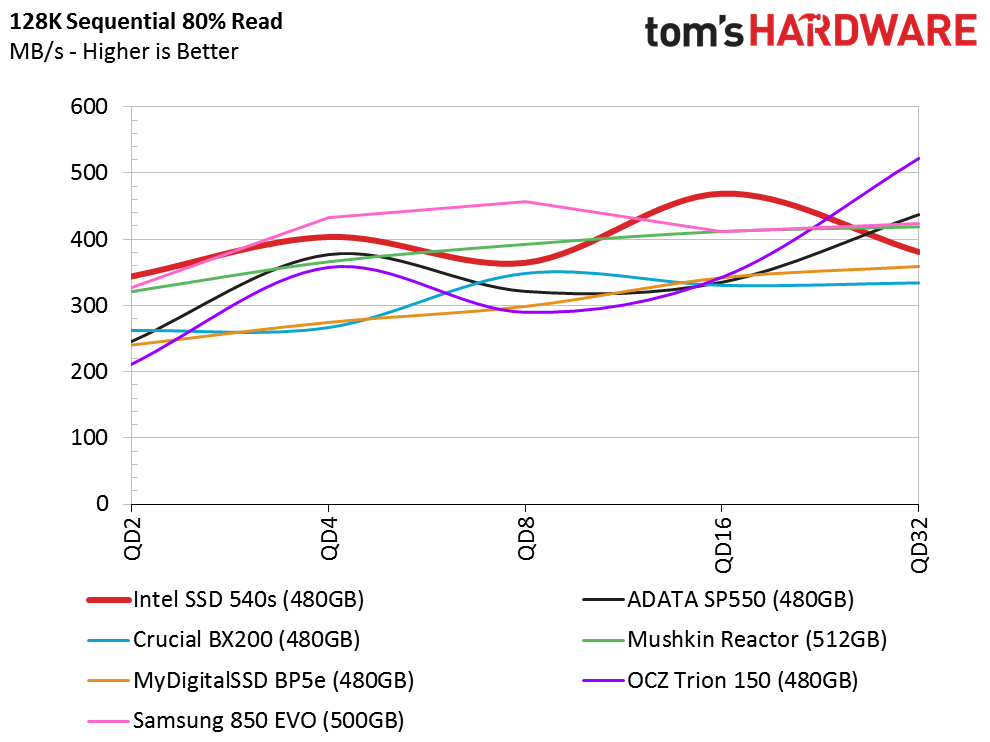
The Intel SSD 540s performs really well in the sequential mixed workload test. The SLC buffer in most of the products creates waves in the test results, so we have to examine the results and normalize the data. The queue depth 2 and 4 results hold more value than the higher queue depths.
80 Percent Random Mixed Workload
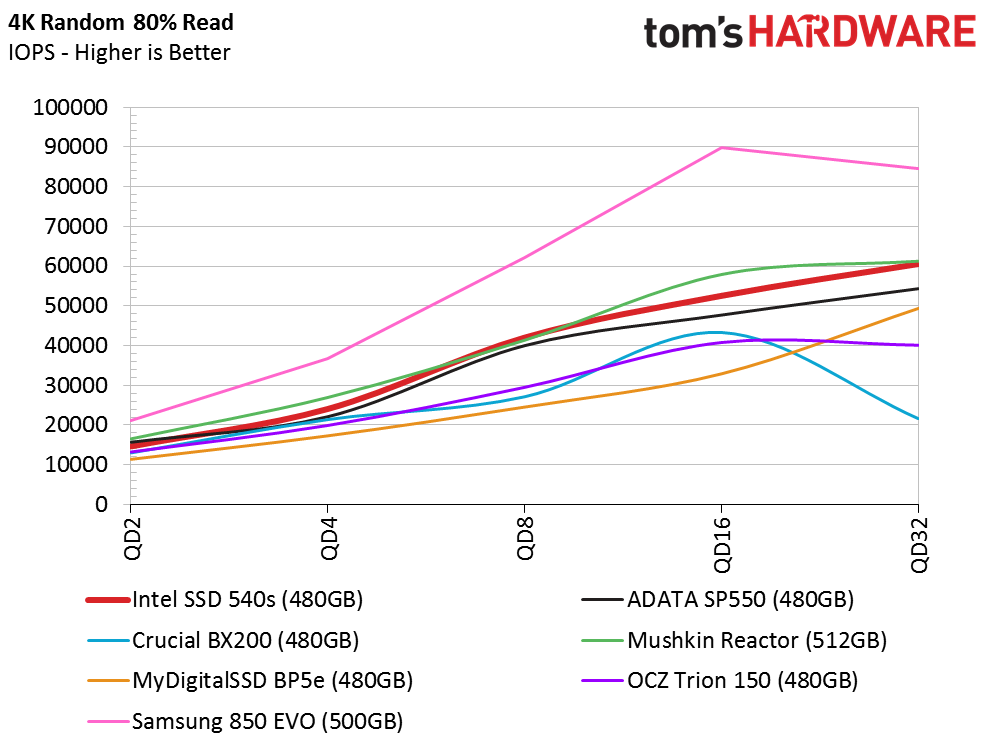
The Intel 540s would provide chart-topping performance compared to the other TLC-based products if you remove the Samsung 850 EVO 500 GB from the mixed sequential results. The MLC-powered Mushkin Reactor is only slightly faster at a few queue depths, but the 540s operates at roughly the same speed. I'm sure there are many SSD manufacturers that would like to remove the 850 EVO from the picture, but with its low price point and high performance, it's here to stay.
Sequential Steady-State
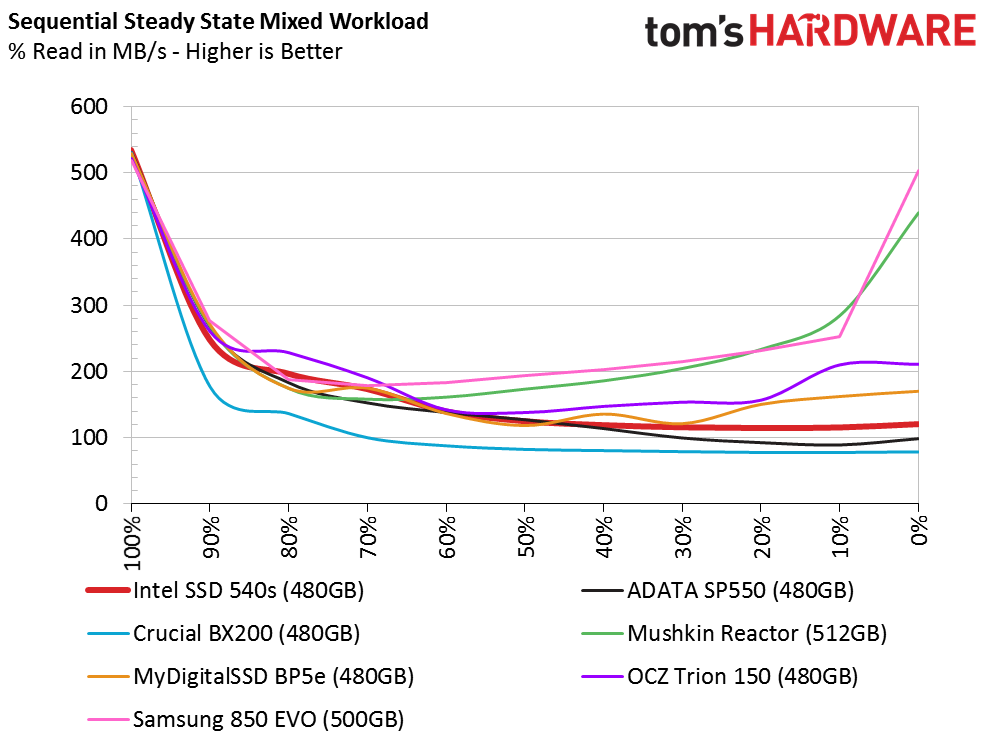
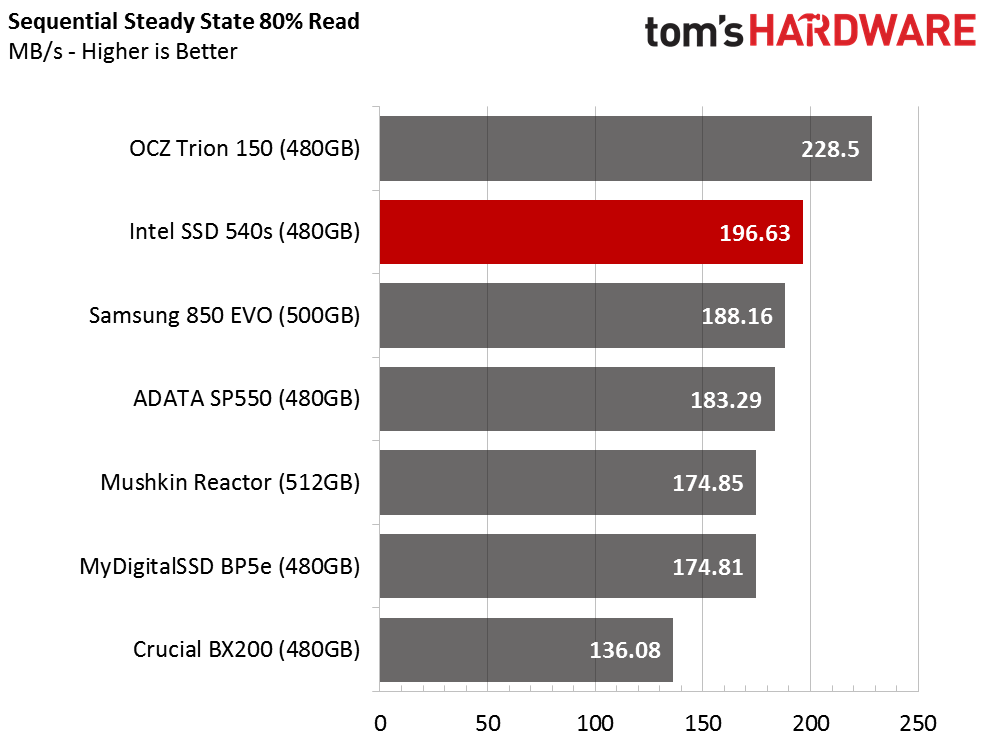
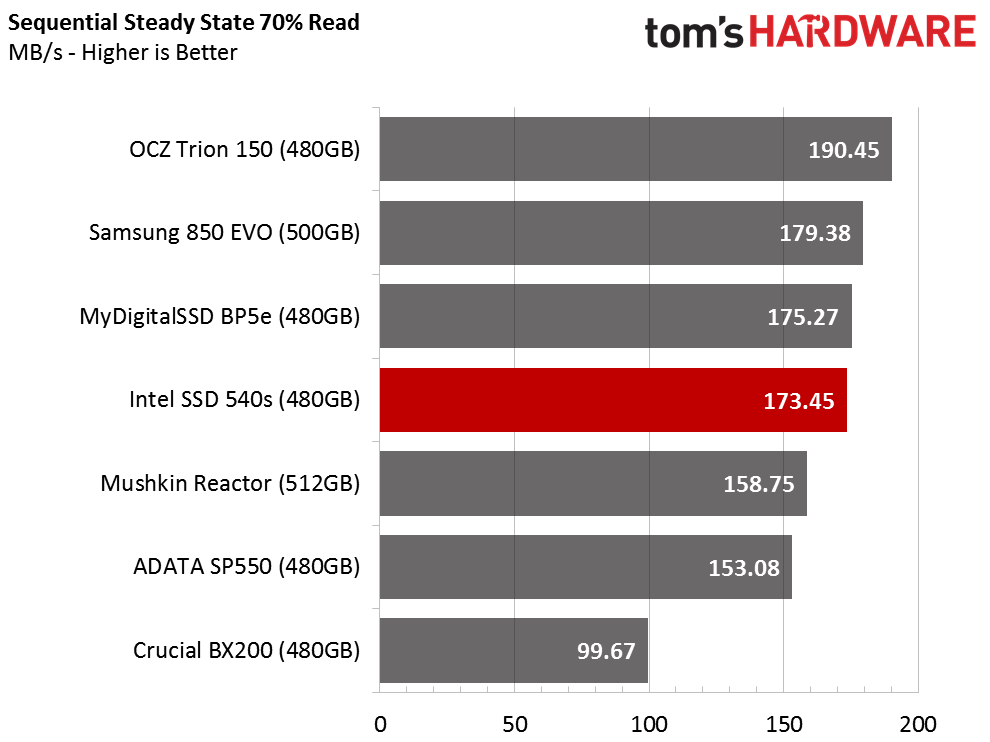
The Intel SSD 540s provides strong performance in steady-state conditions when the majority of the workload is read-centric. Write-intensive tasks prove to be problematic for this SSD, but as a low-cost entry-level model, Intel didn’t design the 540s for heavy write environments.
Random Steady-State
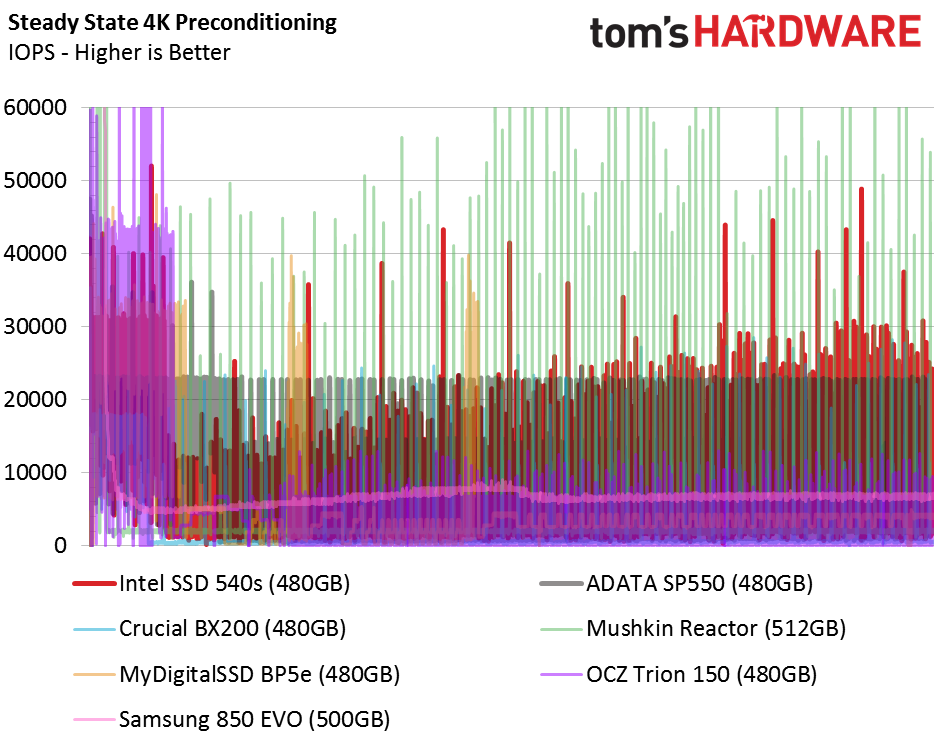
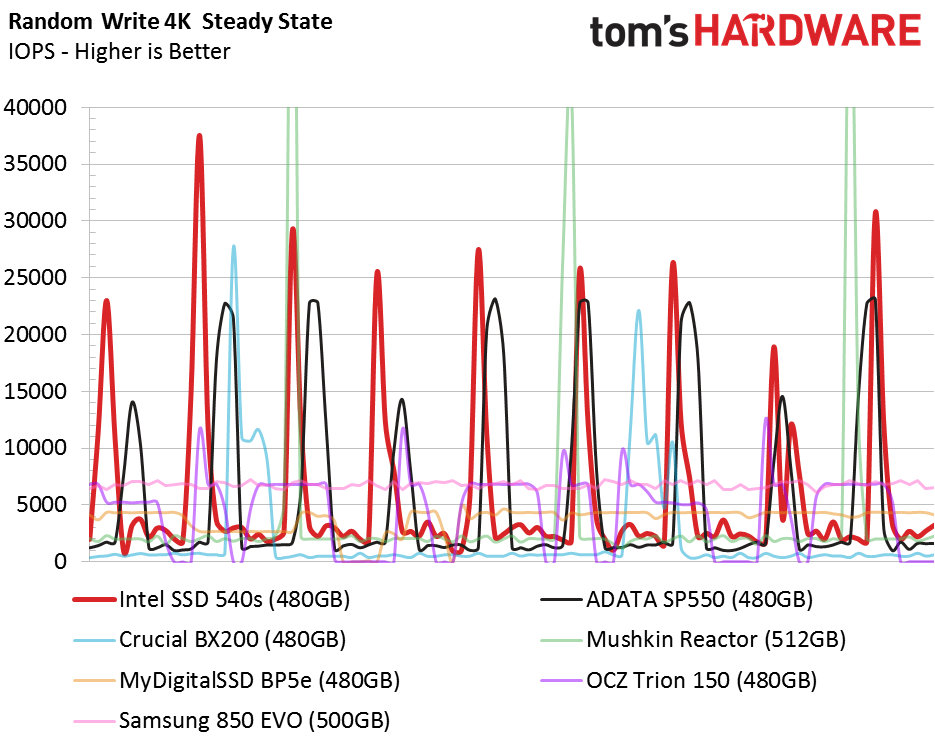
I've always wondered how Intel would handle performance consistency with an entry-level SSD. The 7-Series products (both the PCIe and SATA models) place a lot of emphasis on keeping the data flow consistent. The 540s documentation doesn't say much about performance consistency at all, but we can't blame Intel for sweeping the topic under the rug with this product.
The Intel SSD 540s is not the SSD you want to use in RAID 0 on motherboards. The SSD 730 is an excellent choice, though.
Current page: Benchmarks And Comparisons
Prev Page Specifications And Features Next Page Performance And Conclusion
Chris Ramseyer was a senior contributing editor for Tom's Hardware. He tested and reviewed consumer storage.
-
joz Was the OCZ Trion 150 and Mushkin Reactor always that good? While they aren't the Evo, they seem to be performing quite well.Reply -
boller Guys, you've misread "native TLC transfer performance" as being 135MB/s. In fact it's even worse - about 125 MB/s (from eyeballing the graph).Reply
135MB/s is average speed which includes SLC bump in it's calculation.
But it does not change the conclusion, of course: this drive is POS. -
anonymousdude Pricing on amazon is high, well at least it is if you live near a microcenter. If you order from microcenter the 480gb is priced at $120, which is $10 more than the trion 150 which $110 at microcenter and is $120 on amazon. I'd say that at it's a fair price considering Intel's reputation for reliability and well Intel's branding. For reference the 850 evo is $158 on amazon and $150 at microcenter. Not saying that it's a good drive, but to an average person price and reliability are going to matter more than the fact that it slightly slower than some other drives.Reply -
dreamer2908 Reply18452087 said:Was the OCZ Trion 150 and Mushkin Reactor always that good? While they aren't the Evo, they seem to be performing quite well.
Well, Mushkin Reactor uses the same controller (SM2246EN) and NAND (Micron 16nm MLC) as Crucial BX100 does.
The discontinued BX100 performed quite well, so the Reactor should also do. -
Zaxx420 "it doesn't give us a reason not to buy a Samsung 850 EVO."Reply
Bet you have a keyboard macro just for that phrase...lol -
Cyberats Wow, Mushkin Reactor is my surprise in this survey, stable on all fronts where even Samsung Evo is wavering and it's a full 512gb of space or is it a typo ?Reply -
littleleo I would have liked to see the SK Hynix model in the mix the price on those is good and the performance according to my customers is also very good. The specs look better then the Samsung's on the read and worse on the write; I just wish they offered a 1TB version.Reply -
mapesdhs C.R., I thought toms was going to stop using graphs with non-zero origins? The sequential read and notebook battery life graphs are visually misleading. There's no point using a graph if its visual appearance does not convey data difference.Reply
