Lian Li PE-750 SFX-L 750W PSU Review
Lian Li enters the PSU market again with two new SFX-L models featuring 550 W and 750 W capacities. The PE-750 is under the microscope today. It features modular cabling, a single +12V rail, and a semi-passive fan.
Why you can trust Tom's Hardware
Cross-Load Tests And Infrared Images
Our cross-load tests are described in detail here.
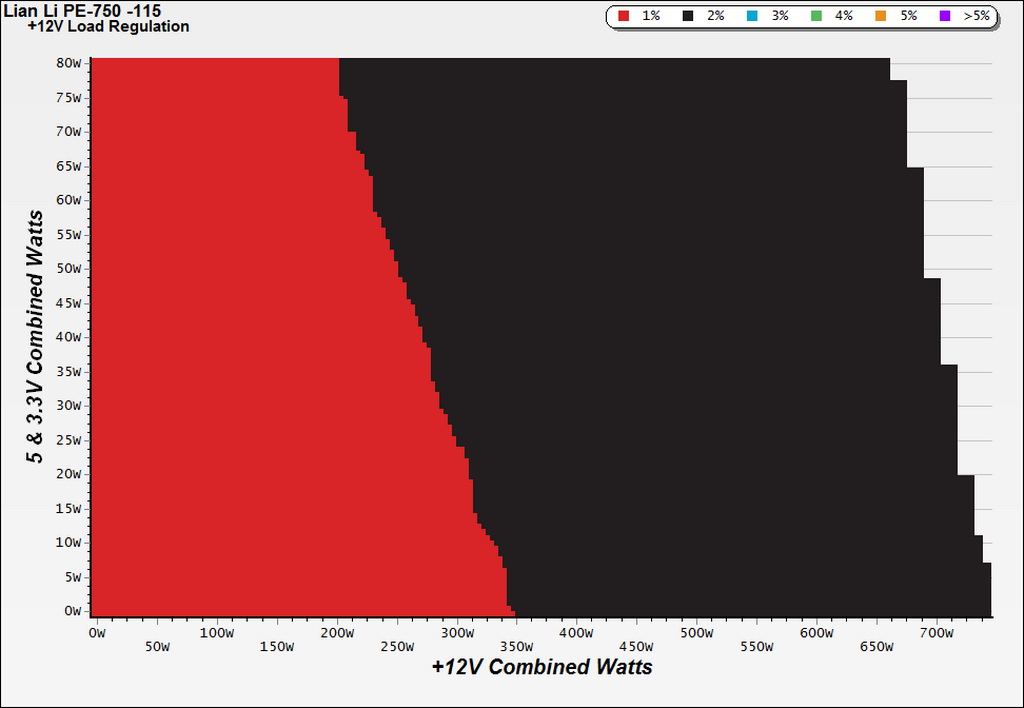
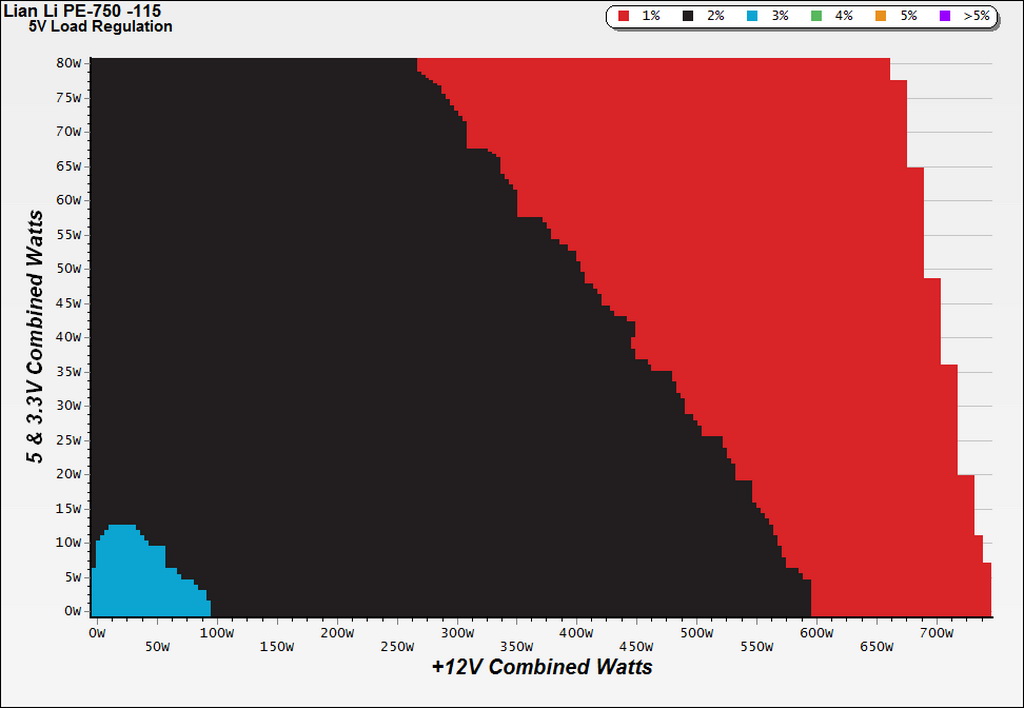
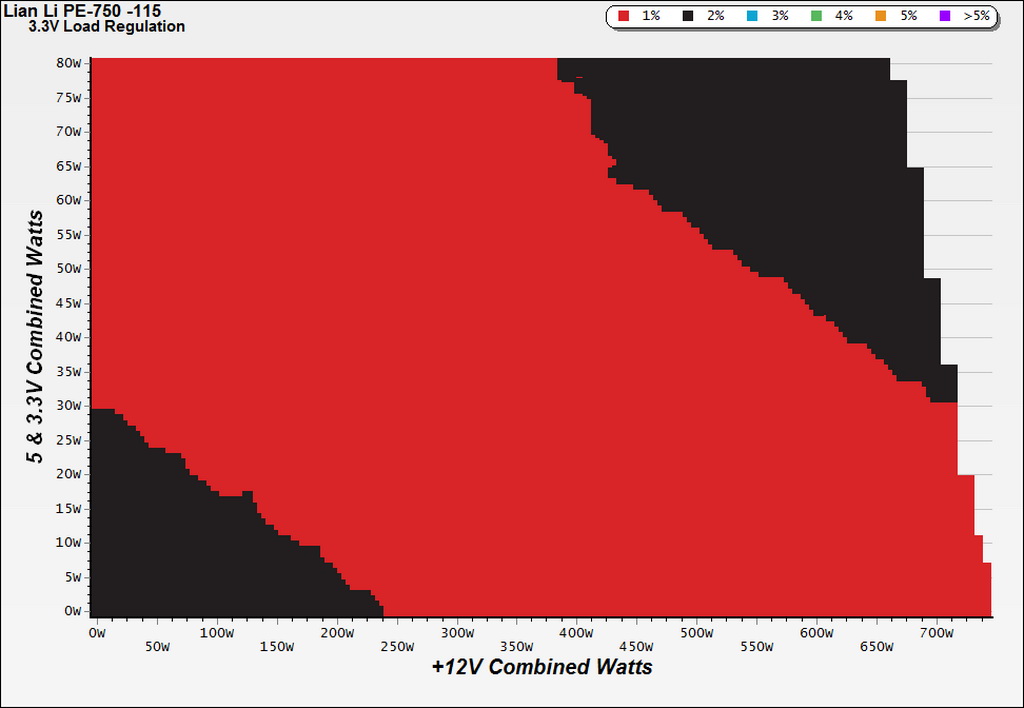
To generate the following charts, we set our loaders to auto mode through our custom-made software before trying more than 25,000 possible load combinations with the +12V, 5V and 3.3V rails. The load regulation deviations in each of the charts below were calculated by taking the nominal values of the rails (12 V, 5 V and 3.3 V) as point zero.
Load Regulation Charts
Efficiency Chart
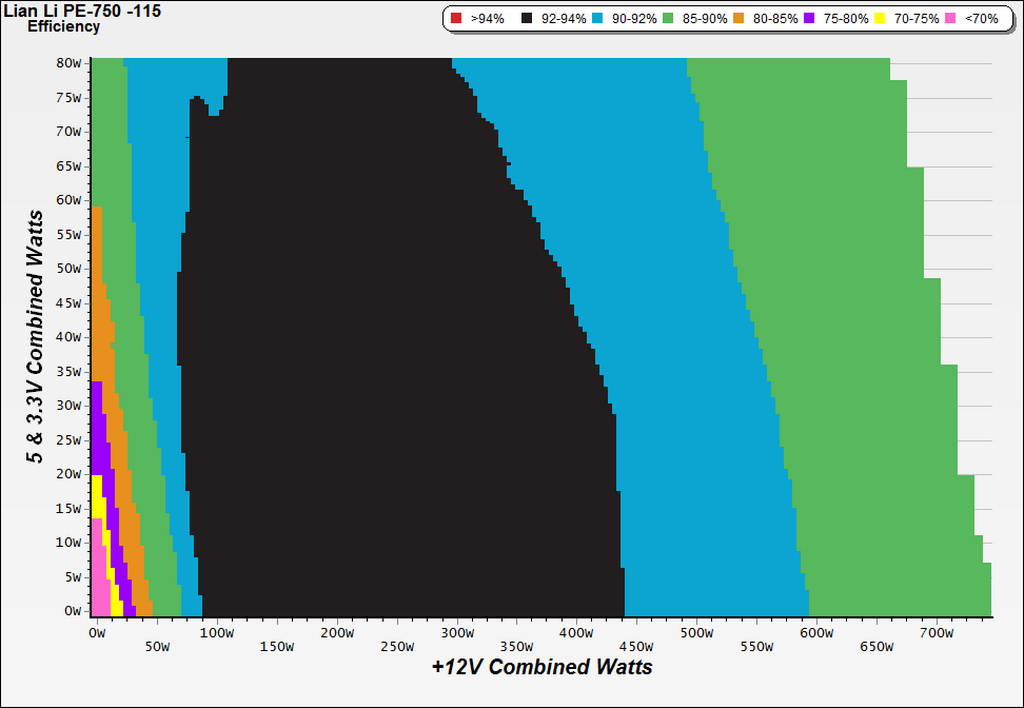
Efficiency is very high for much of the PE-750's operational range. With some tuning and a lower capacity rating (600 W, perhaps), this platform could meet the 80 PLUS Titanium requirements.
Ripple Charts
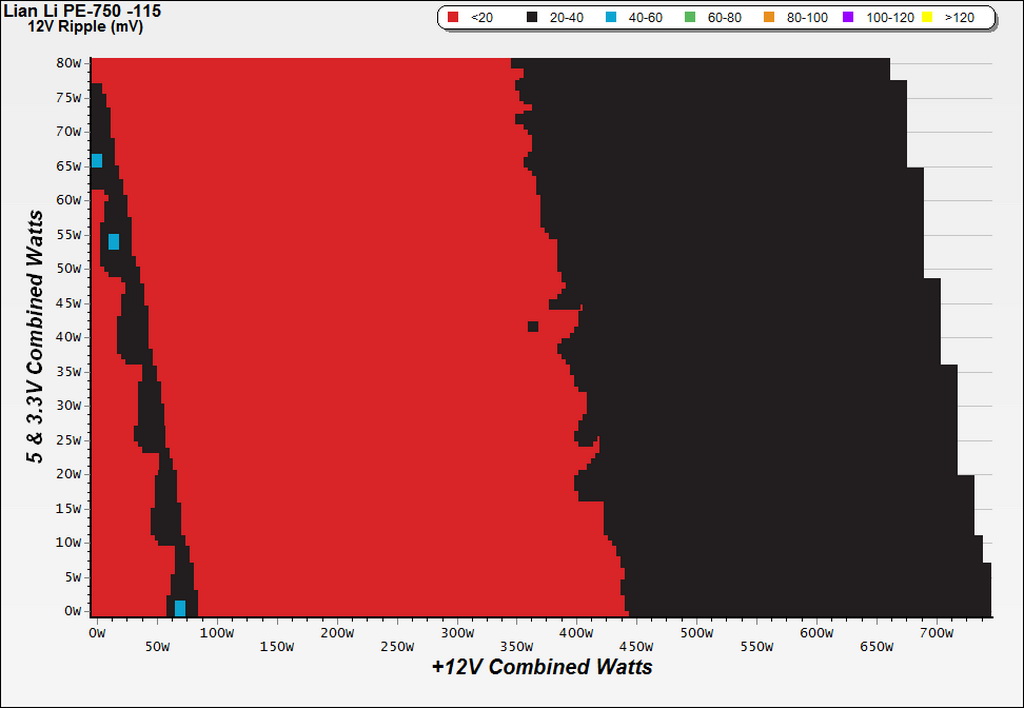
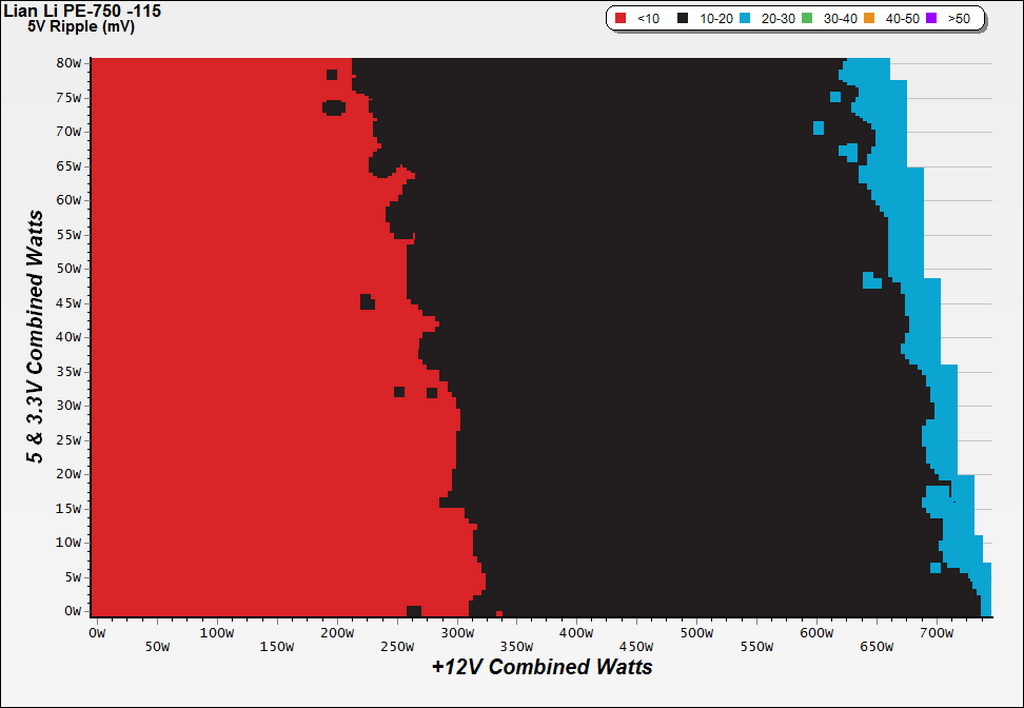
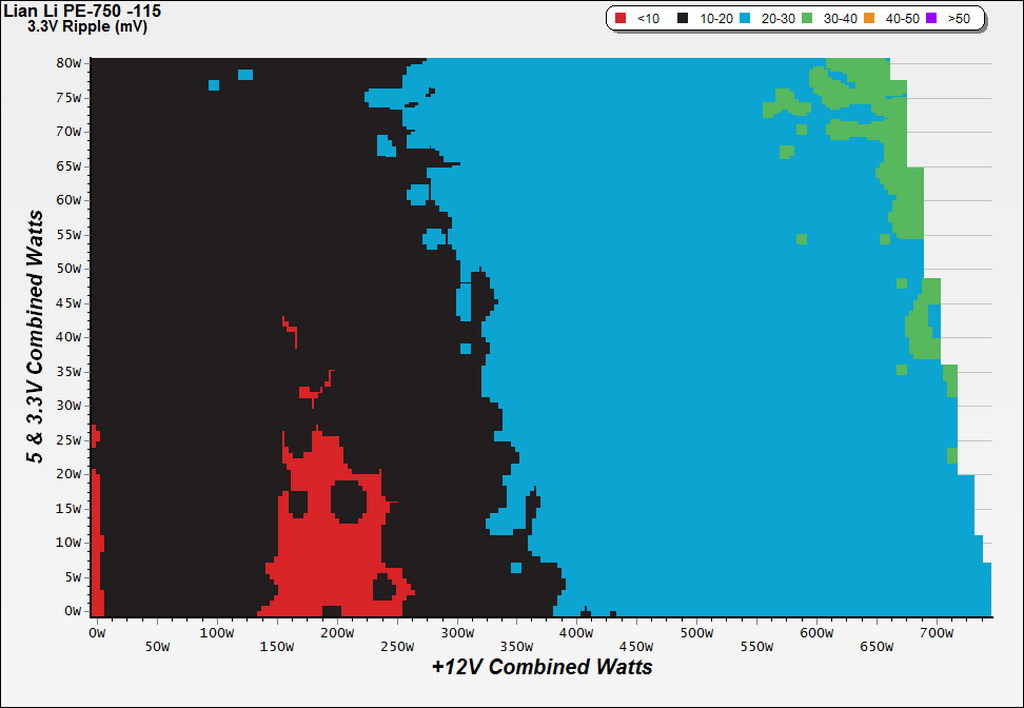
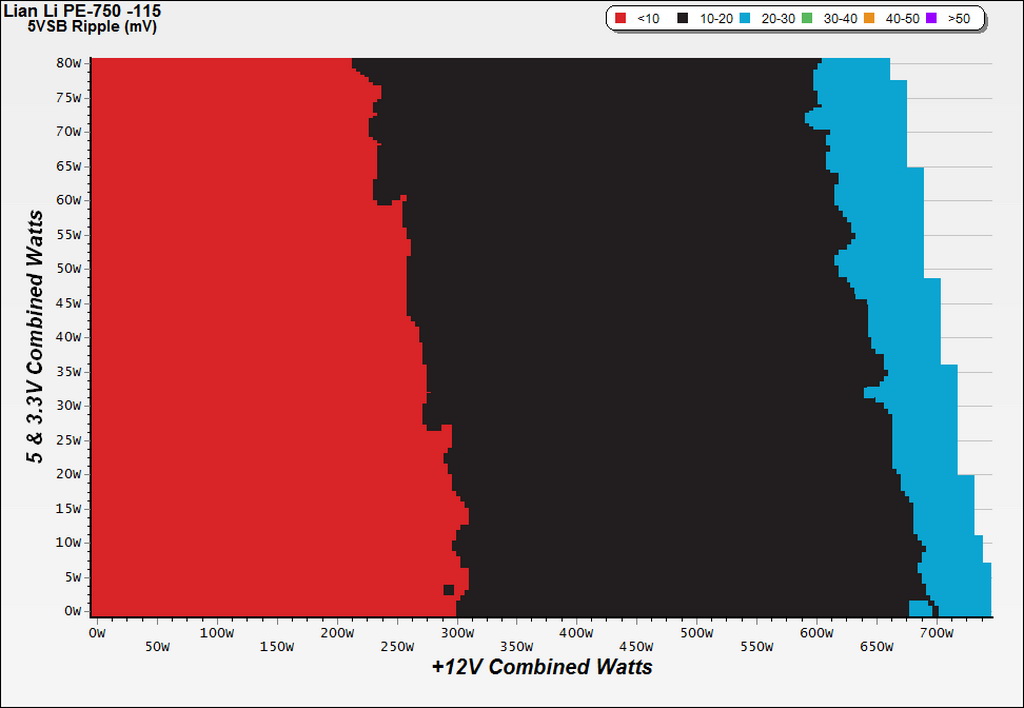
Infrared Images
First we removed the top cover and fan. Then we applied 600 W of load for around five minutes before taking photos of the PSU's internals with our modified FLIR E4 camera that delivers 320x240 IR resolution (76,800 pixels).
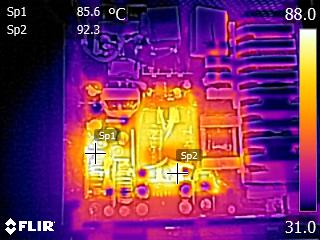
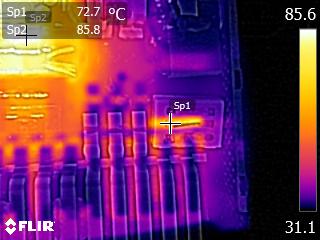
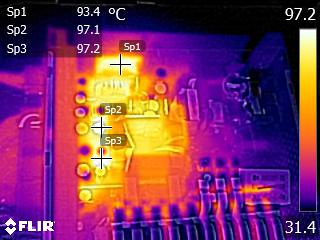
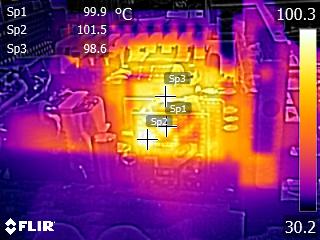
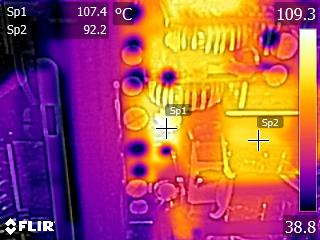
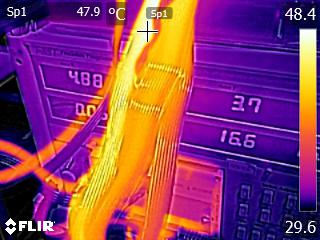
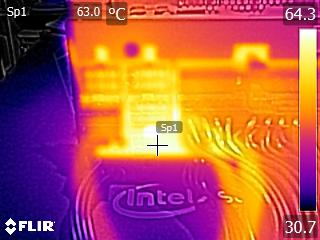
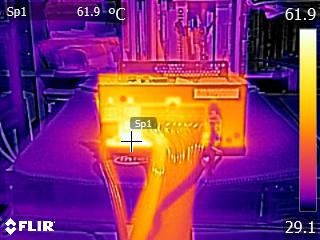
Without active cooling, a 600 W load results in high internal temperatures, as expected. The PSU's hottest parts appear to be the FETs on the DC-DC converters, which generate the minor rails (they're typically cooled by the fan). Those FETs are rating for high operating temperatures though, so don't worry too much about them.
Get Tom's Hardware's best news and in-depth reviews, straight to your inbox.
Current page: Cross-Load Tests And Infrared Images
Prev Page Protection Features, Evaluated Next Page Transient Response Tests
Aris Mpitziopoulos is a contributing editor at Tom's Hardware, covering PSUs.
-
Aris_Mp For the SFX-L standards actually it is quite good. There is next to zero competition in this field. With a few part changes this platform has potential, however I don't know if it could keep efficiency at the same high levels.Reply -
shrapnel_indie Lian Li is supposed to be a premium brand. Just look how expensive (and the usual quality of) their cases are when you can find them. By the numbers and its internals, this doesn't look like a premium brand product, regardless of how much or how little competition they got in a given market.Reply
Lian Li, have you decided to no longer be a true premium brand? -
Valantar Definitely disappointing. Looks like Lian Li is going for the "money to burn, don't care" market. This PSU had amazing promise, but the choice of fan, the too-small caps and the short warranty make this unbuyable. Now, I don't have empirical data to base this on, but I'd guess most people springing $160 on a PSU - SFX or not - want it to last more than 2-3 years. And using a fan that's both short-lived _and_ unsuitable for horizontal mounting? That's just idiotic.Reply -
Virtual_Singularity Solid review, as always, great job Aris. Even if this isn't an ideal psu, Lian Li is a quality brand, a quality case brand. However, its worth noting that of the ample (edit: particularly sfx/sfxl) PSU's Enhance has OEM'd for various brands, this one has to be among the best of them. Even if Lian Li introduced an absolutely horrible psu, wouldn't matter much to their fans, its the quality they put into many of their cases that's most important. Even if they cave more than they already have to the recent case trends, I hope they still keep producing no nonsense cases for that niche market that still values them.Reply -
Valantar Reply18666014 said:Solid review, as always, great job Aris. Even if this isn't an ideal psu, Lian Li is a quality brand, a quality case brand. However, its worth noting that of the ample PSU's Enhance has OEM'd for various brands, this one has to be among the best of them. Even if Lian Li introduced an absolutely horrible psu, wouldn't matter much to their fans, its the quality they put into many of their cases that's most important. Even if they cave more than they already have to the recent case trends, I hope they still keep producing no nonsense cases for that niche market that still values them.
Sure, Lian Li makes great cases (although IMHO they too often screw up their nice minimalist looks with unnecessary clutter, and they're way behind the times in a few usability/ease of build areas today). But how does this relate to this PSU? In no way at all. Lian Li might be "a quality brand, a quality case brand", but that does nothing to change the fact that this is a premium priced PSU built with mind-boggling cost cutting in key areas, making its lifetime radically shorter than it should be. This would barely be okay for a $60 PSU. For a $160 unit, it's not only a deal breaker, it's about on the same level as the engineers shouting "F*ck you!" to every individual buyer. -
Virtual_Singularity Reply18670375 said:18666014 said:Solid review, as always, great job Aris. Even if this isn't an ideal psu, Lian Li is a quality brand, a quality case brand. However, its worth noting that of the ample PSU's Enhance has OEM'd for various brands, this one has to be among the best of them. Even if Lian Li introduced an absolutely horrible psu, wouldn't matter much to their fans, its the quality they put into many of their cases that's most important. Even if they cave more than they already have to the recent case trends, I hope they still keep producing no nonsense cases for that niche market that still values them.
Sure, Lian Li makes great cases (although IMHO they too often screw up their nice minimalist looks with unnecessary clutter, and they're way behind the times in a few usability/ease of build areas today). But how does this relate to this PSU? In no way at all. Lian Li might be "a quality brand, a quality case brand", but that does nothing to change the fact that this is a premium priced PSU built with mind-boggling cost cutting in key areas, making its lifetime radically shorter than it should be. This would barely be okay for a $60 PSU. For a $160 unit, it's not only a deal breaker, it's about on the same level as the engineers shouting "F*ck you!" to every individual buyer.
Fwiw, I've no need of this form factor in a psu, so I'm really not bothered by it so much. But take the comment Aris made above into account. TBH, it'd be very easy to come to your conclusion if not for this psu being in the SFXL category. It really is one of the better ones I've seen reviewed, despite the short warranty. A shorter warranty is typical of the latest comparable units, (Silverstone, for example, has 2-3 years depending on location) the exception being Corsair, possibly. I say possibly because I don't know how their latest sfx units, despite having a longer warranty, compare with this one in overall efficiency, performance. and size.
The latest platinum/titanium rated SFX/SFX-L units carry a price premium. For those demanding a sfx-l unit, the one reviewed above is among the best performers, regardless of it's short warranty. -
blazorthon Problem is that it has multiple issues that are not inherent of being a smaller form factor such as SFX. Lian Li could have simply used a better, same-sized fan. There is also enough room for better caps. Being expensive just because of its efficiency with no regard for long-term reliability is idiotic and contradictory to being a high-end PSU in the first place.Reply -
gadgety Great to highlight the weaknesses of this PSU. How does it compare to the Silverstone SX700-LPT? Which one is best. Do a shootout, or do an comparison piece.Reply
