GeForce RTX 2060 and 2070 Super Review: Nvidia Preemptively Strikes Navi
Why you can trust Tom's Hardware
Power Consumption: GeForce RTX 2060 Super
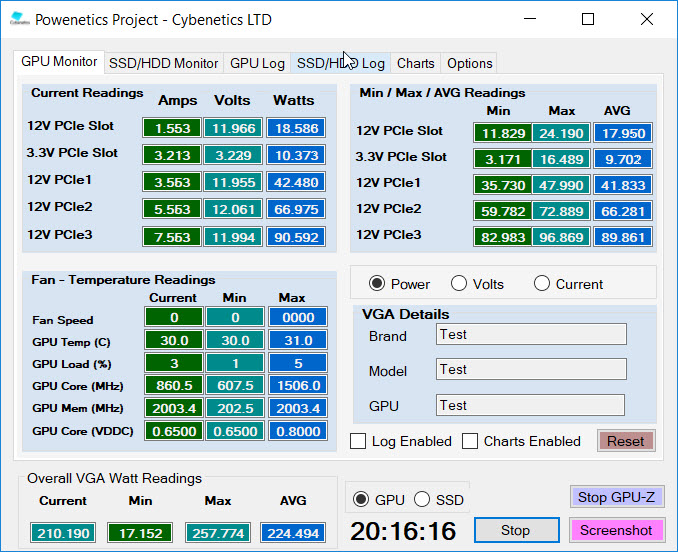
The US Tom’s Hardware graphics lab continues utilizing Cybenetics’ Powenetics hardware/software solution for accurately measuring power consumption.
Powenetics, In Depth
For a closer look at our U.S. lab’s power consumption measurement platform, check out Powenetics: A Better Way To Measure Power Draw for CPUs, GPUs & Storage.
In brief, Powenetics utilizes Tinkerforge Master Bricks, to which Voltage/Current bricklets are attached. The bricklets are installed between the load and power supply, and they monitor consumption through each of the modified PSU’s auxiliary power connectors and through the PCIe slot by way of a PCIe riser. Custom software logs the readings, allowing us to dial in a sampling rate, pull that data into Excel, and very accurately chart everything from average power across a benchmark run to instantaneous spikes.
The software is set up to log the power consumption of graphics cards, storage devices, and CPUs. However, we’re only using the bricklets relevant to graphics card testing. Nvidia's GeForce RTX 2060 Super gets all of its power from the PCIe slot and one eight-pin PCIe connector, while the GeForce RTX 2070 Super gets all of its power from the PCIe slot, one eight-pin auxiliary connector, and one six-pin connector. Once the GeForce RTX 2080 Super shows up with its eight- and six-pin connectors, we'll run that card through this system as well.
Idle
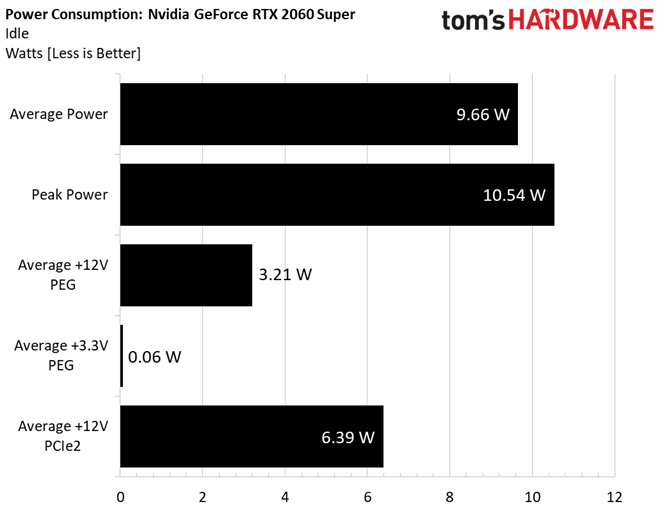
Despite a more well-endowed TU106 processor that we’d expect to need extra power, GeForce RTX 2060 Super uses slightly less at idle compared to GeForce RTX 2060. Surely our gaming and stress tests will tell a different story…
Gaming
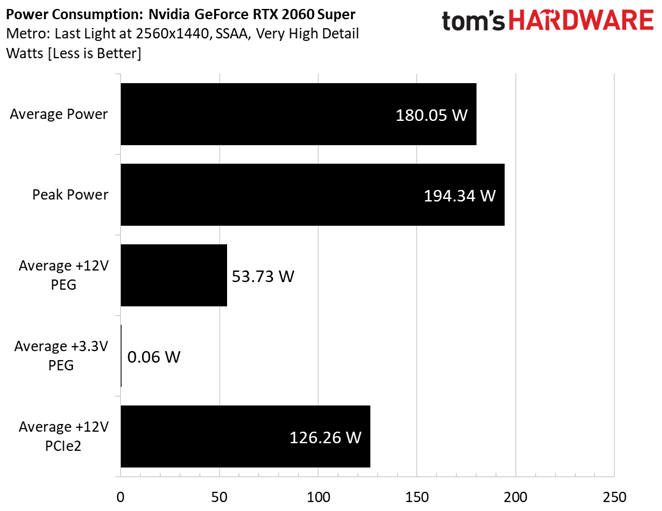
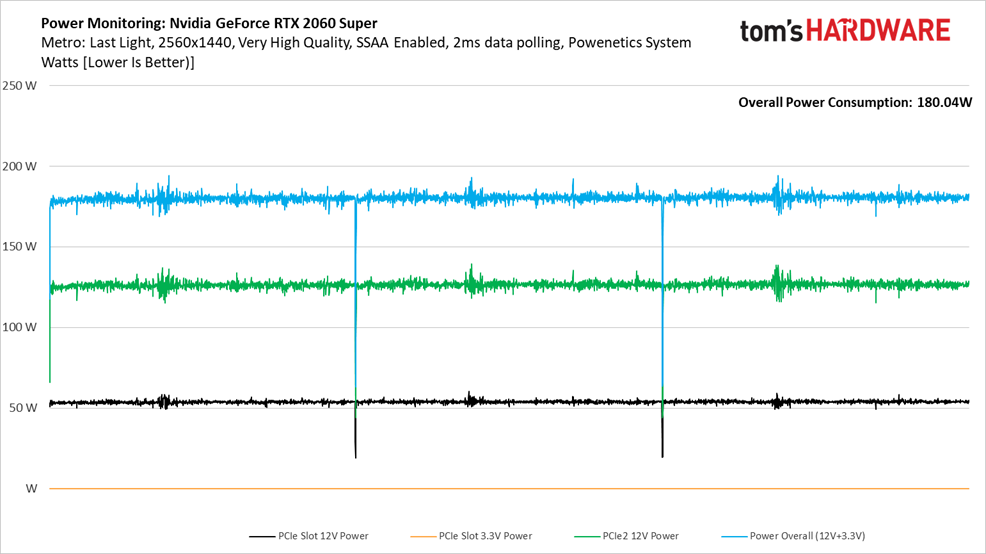
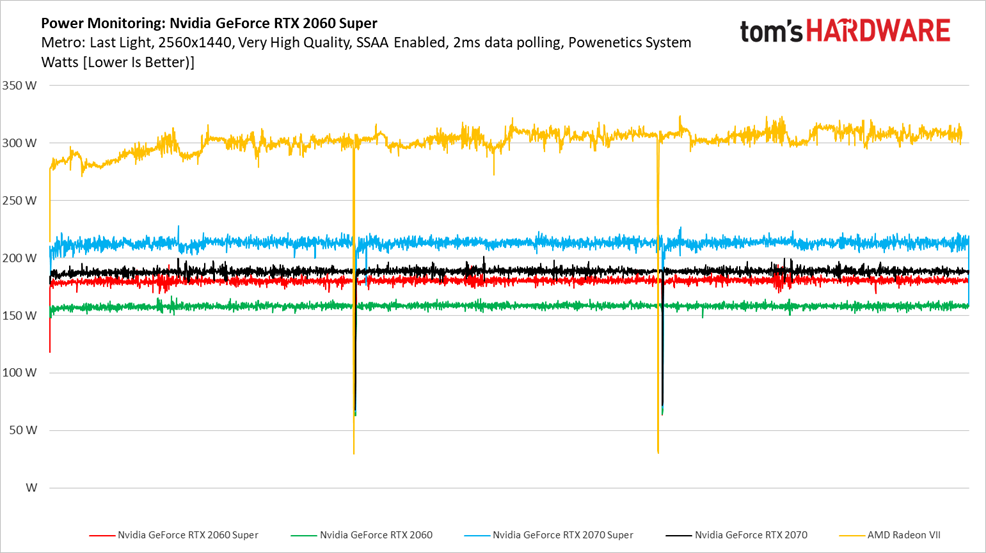
An average power measurement of 180W is five watts higher than Nvidia’s 175W specification for GeForce RTX 2060 Super.
Get Tom's Hardware's best news and in-depth reviews, straight to your inbox.
Not surprisingly, most of that power is delivered over the 2060 Super’s single eight-pin auxiliary power connector.
But of course, TU106 with 2,176 CUDA cores and a higher base clock rate needs more power than TU106 with just 1,920 CUDA cores. The vanilla 2060’s 158W average is 22W lower than the new GeForce RTX 2060 Super.
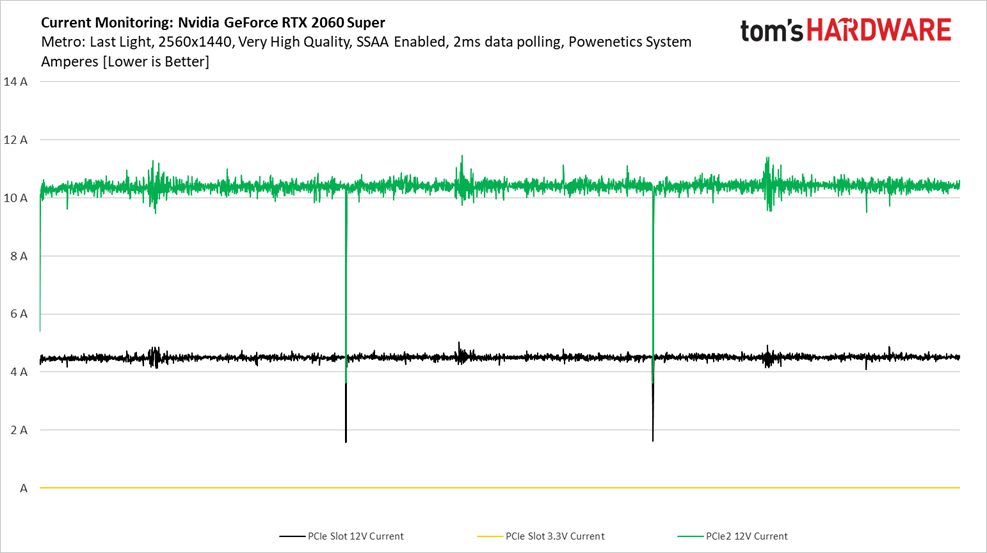
We like to keep an eye on current draw, especially over the PCI Express x16 link. An average of 4.5A through our Metro benchmark sequence is far enough below the PCI-SIG’s 5.5A ceiling to keep us satisfied.
FurMark
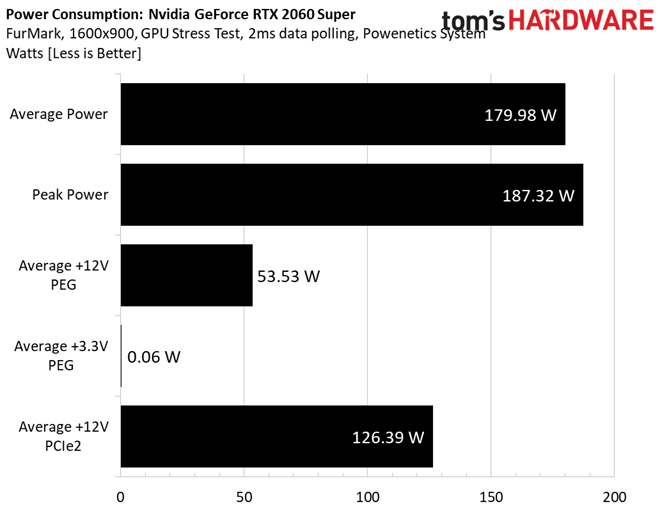
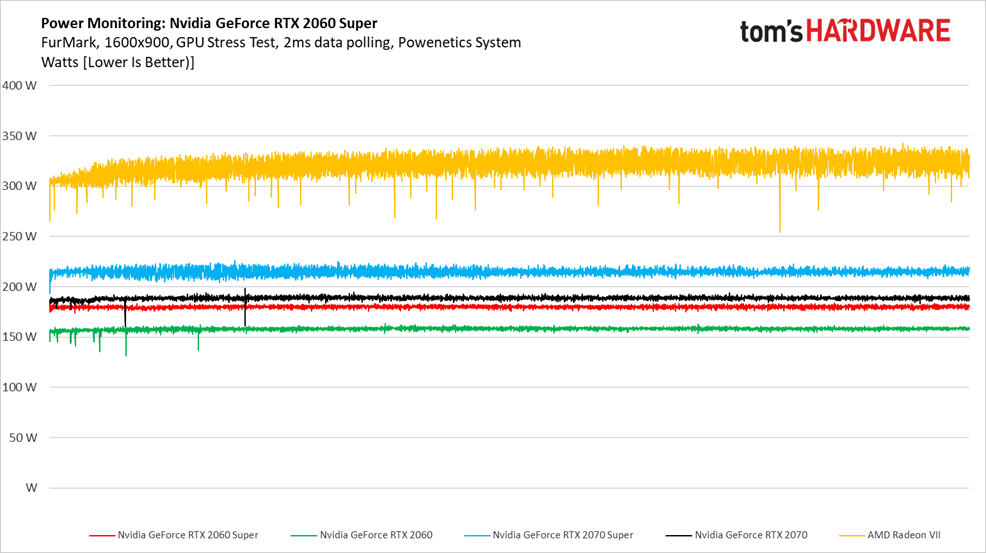
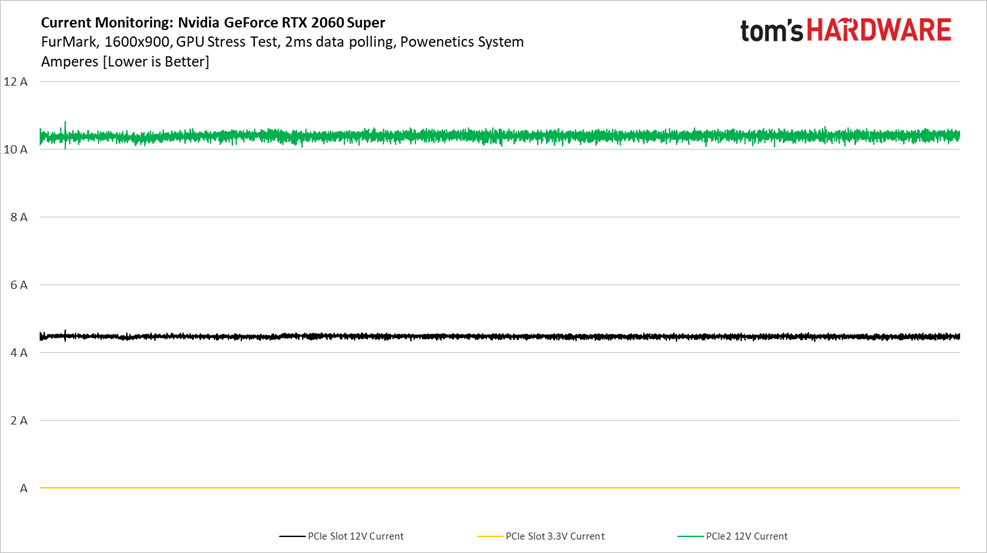
Average consumption actually drops a bit under a more demanding FurMark workload, as does the peak power reading. Because FurMark is fairly consistent, there are no big spikes up or down.
This consistency is modeled in a tight line across more than 15 minutes of data collection.
Power consumption doesn’t change much under FurMark. The GeForce RTX 2060 Super still uses about 22W more than the existing 2060.
We also see just how close the new 2060 Super gets to Nvidia’s end-of-life GeForce RTX 2070 (with all of its on-die resources enabled).
After seeing power consumption match our gaming results fairly closely under FurMark, it’s no surprise that current draw is similar, too.
MORE: Best Graphics Cards
MORE: Desktop GPU Performance Hierarchy Table
MORE: All Graphics Content
Current page: Power Consumption: GeForce RTX 2060 Super
Prev Page Performance Results: 3840 x 2160 Next Page Power Consumption: GeForce RTX 2070 Super-
jimmysmitty So short of a handful of games the RTX 2070 Super outperforms or matches the Radeon VII and comes in at $150 less ( more depending on which one you get). Thats a solid win.Reply
Guess now we wait for Navi to see if they have anything decent to counter. -
Giroro I think if Nvidia could have dropped the price of the RTX 2060, they probably would have done that instead of releasing the RTX 2060 super for $50 more.Reply
Unfortunately, all those leftover RT and AI cores make for a giant and expensive to manufacture die. I'm not sure if we'll ever see an RTX card for under $350, but AMD could probably drop the 5700 down well below that if they were really pressed.
As for the value proposition of Ray Tracing itself... That's still really dubious. The overall number of upcoming RTX games is still lower than the overall number of RTX -laptops- on the market. I don't know about anyone else, but I'm not exactly lining up to spend $400+ for somewhat prettier graphics in the 2-3 games I find interesting. I have a feeling that most of the early adopters banking on the promise of future support probably bought an RTX card months ago.
So, cool on Nvidia for flexing their muscles and remaining the strongest, I just don't see it winning over that many new customers. -
fraserlawrence Thank goodness we are starting to see value swing back towards the gamer and away from the cryptomining bubble. I may finally upgrade my gtx 970 ($339 in late 2014) to take advantage of 1440p gaming. Will an Intel Core i5-4690K temporarily work OK with an RTX 2060 Super until I upgrade the rest of my rig? Mostly playing AAA single player games like AC Odyssey, Far Cry 5, Sekiro and Shadow of Tomb Raider. Thank you Tom's Hardware for all the help getting started and balancing a gaming PC build with excellent reviews and best value discussions.Reply -
cryoburner ReplyInserted right between the $350 GeForce RTX 2060 and $500 RTX 2070 Super, we can’t imagine that anyone actually asked for a $400 GeForce RTX 2060 Super.
A better way to look at it is that the 2060 Super is offering near-2070 performance for $100 less. It performs within a few percent or so of the 2070, so this is almost like Nvidia lopping $100 off the 2070's MSRP. You do lose around 5% of the graphics cores, but retain the full 8GB of VRAM and memory bandwidth of that card. This is more like the kind of pricing we should have seen from the 20-series to begin with, and I think the cards would have been a lot better received if that had been the case.
Back when there weren’t any ray tracing- or DLSS-enabled games to show off the Turing architecture’s most prominent features, those were unforgiving comparisons.
DLSS has proven to be more or less useless, being little more than a mediocre upscaling method in practice. It might not be bad if it looked or performed better than all other forms of upscaling, but it doesn't. A number of games use other upscaling methods that are not only better, but also don't require any special hardware, allowing them to run on any card while offering better performance than DLSS for a given level of image quality. So, as far as that feature is concerned, the comparisons are even worse now than they were when people didn't know what DLSS had to offer. It's gone from being a potentially useful feature to being a non-feature.
And there are still only a few games released so far that support raytraced lighting effects, and enabling them still kills performance at the resolutions most people are likely buying these cards for. Raytraced effects have the potential to improve visuals, but the current cards don't have nearly enough RT cores to run them well. I suppose the Super lineup helps a bit by making slightly more RT cores available at a given price point, but it's not nearly enough to prevent the performance hit from being substantial relative to the minor improvements to visuals. Perhaps next year's cards will make hybrid raytracing more viable.
Still, I do agree that if two cards otherwise offer similar performance at a given price level, hardware raytracing support is definitely something that can help differentiate one card from another. Enabling those effects might cause a big hit to performance, but at least the option is there. For that reason, I think the 5700 and 5700 XT may have a hard time justifying their launch prices compared to the Super cards, unless they perform significantly better than expected. The pricing seemed a bit underwhelming from the start, and even without the Super cards available, I felt each of those Navi cards should have been priced about $50 lower. The initial 20-series pricing was underwhelming from the start, and AMD didn't seem to be pushing value much beyond that, despite these cards launching the better part of a year later. AMD had the opportunity to build some hype for their new generation of cards through competitive pricing, but appear to have followed Nvidia's lead in price-gouging their new cards, despite not bringing anything really new to the table. Better pricing from the start could have prevented Nvidia from raining on their parade with the Super cards.
And on that note, the Radeon VII is the real loser compared to the Super lineup. Its value was already a bit questionable for anyone not utilizing its 16GB of VRAM for certain professional applications, since the RTX 2080 was already offering more gaming performance and dedicated RT hardware with lower power demands for about the same price, but now the 2070 Super will be offering similar performance along with RT hardware for almost $200 less. That makes the VII a no-go for just about anyone interested in it for gaming, and due to its large amount of expensive HBM2 VRAM, I doubt AMD could drop its price by $200 to compete. -
cangelini Replycryoburner said:A better way to look at it is that the 2060 Super is offering near-2070 performance for $100 less. It performs within a few percent or so of the 2070, so this is almost like Nvidia lopping $100 off the 2070's MSRP. You do lose around 5% of the graphics cores, but retain the full 8GB of VRAM and memory bandwidth of that card. This is more like the kind of pricing we should have seen from the 20-series to begin with, and I think the cards would have been a lot better received if that had been the case.
That's another way to look at it, yes. I see it as where 2070 should have been at launch, agreed! -
bit_user Why don't the charts show the specs of the old vs. new cards, like pretty much every other site???Reply -
bit_user Reply
By comparison with Turing and especially these Supers, the efficiency of the Pascal cards seems almost exquisite.chill1221 said:Glad to see my 11GB 1080 TI still hanging tough!
I hope their 7 nm cards bring a return to the Wattage of that era. -
bit_user Reply
I think the problem is they tried to do too much with it. The more sophisticated the model, the longer inferencing takes and the less time is left for conventional rendering. So, they could either go with a sophisticated model designed to enhance low-quality AA, or a simple model that's basically just an improved scaler and able to be paired with decent AA. Because the former is easier to sell, they went with that. However, maybe they should've just gone with the latter.cryoburner said:DLSS has proven to be more or less useless, being little more than a mediocre upscaling method in practice. It might not be bad if it looked or performed better than all other forms of upscaling, but it doesn't.
Anyway, it's essentially a software feature (although it depends on the tensor cores). So, there's always a chance they'll reverse course.
First, it's much easier to lower prices than to raise them. So, AMD could quickly come down from its launch pricing.cryoburner said:AMD had the opportunity to build some hype for their new generation of cards through competitive pricing, but appear to have followed Nvidia's lead in price-gouging their new cards, despite not bringing anything really new to the table. Better pricing from the start could have prevented Nvidia from raining on their parade with the Super cards.
Second, I see the Super cards as pretty much inevitable, no matter what AMD did with pricing. The only real variable was whether and how Nvidia adjusted their pricing. The big question is whose price floor is higher. If it does come to a price war, how much can they each drop?
I've always seen the RTX features as very much about creating enough differentiation to justify higher pricing. However, they're far from the must-haves Nvidia surely hoped. As such, I think they're not yet sufficient to keep the RTX cards out of a price war. Maybe in the next gen, but not now.
It's true and a fair point, but you surely know it wasn't designed as a gaming card. The way to think of it is as a Titan - something of a specialty product that's soon to be surpassed by the next generation. Like the Kepler Titan and the Titan V, it's a professional GPU that they let gamers and prosumers have at a more accessible price point.cryoburner said:the Radeon VII is the real loser compared to the Super lineup. -
alextheblue Reply
You meant to say "breathtaking", of course.cangelini said:...wouldn’t want to play the game at any detail preset that has Keanu look like less than the beautiful man he is.
Inevitable, absolutely. But when, in what form, and at what price points? Would they have been satisfied to just sell FE or FE+ as "Super" if there was no competition? Or even if they pushed further than that, would the 2060 Super be unlocked to near-2070 levels, or would they still have gimped it slightly - retain the narrower memory interface perhaps? I mean it's all kind of academic at this point but it's an interesting thought exercise. I believe the timing and other decisions were influenced by Navi. With that being said the Super models as-spec'd are a substantial boost and should really make this an interesting fight!bit_user said:Second, I see the Super cards as pretty much inevitable, no matter what AMD did with pricing.
Anyway yeah, the pricing may shift around a bit in the coming months. Having a high price floor is one of the things that bit AMD in the hind with their Vega lineup. This time AMD has both a moderate sized chip and conventional GDDR, though the new process is doubtless more expensive at the moment. The other wildcard is drivers - RDNA is supposedly different enough that I wouldn't be surprised to learn that there's decent room for optimization. That's not really a positive at launch though, but it's something else to chew on.
Indeed, it's got a ton of crunching horsepower for a relatively low price. The FP64 performance in particular is untouchable at that price.bit_user said:It's true and a fair point, but you surely know it wasn't designed as a gaming card. The way to think of it is as a Titan - something of a specialty product that's soon to be surpassed by the next generation. Like the Kepler Titan and the Titan V, it's a professional GPU that they let gamers and prosumers have at a more accessible price point.
