Nvidia GeForce RTX 2080 Founders Edition Review: Faster, More Expensive Than GeForce GTX 1080 Ti
Why you can trust Tom's Hardware
Temperatures and Clock Rates
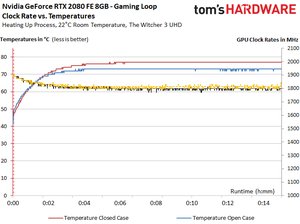
While we don't like that Nvidia's new thermal solution kicks waste heat back into your chassis, it's clearly a superior performer. Clock rate losses aren't nearly as dramatic as the previous generation. And a cooler-running processor means GPU Boost rates could probably be quite a bit higher without an issue.
Moreover, frequency differences between the open test setup and a closed case are non-existent.
| Row 0 - Cell 0 | GeForce RTX 2080Start/End | GeForce RTX 2080 TiStart/End |
| Open Test Bench | ||
| GPU Temperature | 34 / 75 °C | 35 / 77 °C |
| GPU Clock Rate | 1905 / 1815 MHz | 1815 / 1665 MHz |
| Ambient Temperature | 22 °C | 22 °C |
| Closed Case | ||
| GPU Temperature | 35 / 75 °C | 35 / 80 °C |
| GPU Clock Rate | 1905 / 1800 MHz | 1815 / 1650 MHz |
| Ambient Temperature Inside Case | 25°C | 43°C |
Overclocking
To the best of its ability, Nvidia is taking the trial and error out of overclocking with an API/DLL package that partners like EVGA and MSI can build into their utilities. Instead of an enthusiast going back and forth, testing one part of the frequency/voltage curve at a time and adjusting based on the stability of various workloads, Nvidia’s new Scanner runs an arithmetic-based routine in its own process, evaluating stability without user input. Although Nvidia says the metric usually encounters math errors before crashing, the fact that it’s contained means the algorithm can recover gracefully if a crash does occur. This gives the tuning software a chance to increase voltage and try the same frequency again. Once the Scanner hits its maximum voltage setting and encounters one last failure, a new frequency/voltage curve is calculated based on the known-good results.
This worked quite well for us in practice, though our results did land below what we achieved after an hour of manually tweaking. If you'd rather save time and allow this one-click approach handle overclocking, we wouldn't dissuade you; the technology does what Nvidia says it's supposed to do.
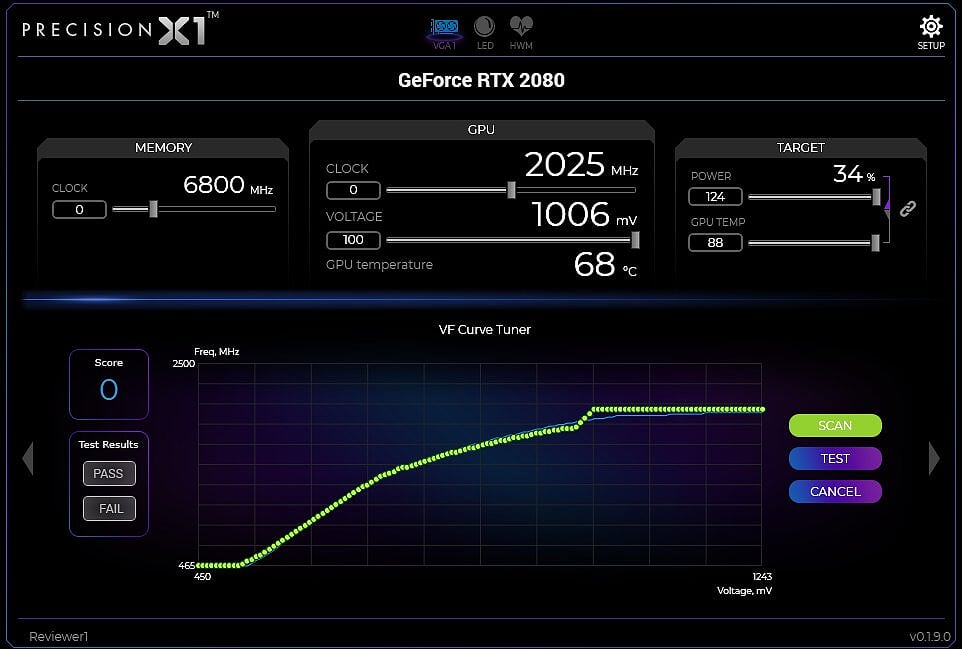
Using a beta version of EVGA's Precision X1 utility, our GeForce RTX 2080 hit a stable 2025 MHz using Nvidia's new algorithm. Unfortunately, we believe that lackluster result is due to a low-quality GPU, not a fault with the Scanner package. Meanwhile, our GeForce RTX 2080 Ti stabilized at 1935 MHz after warming up on an open bench (and without any fan curve adjustment). In a closed case, it reached 1860 MHz.
GeForce RTX 2080: Temperatures And Clock Rates
The following charts illustrate our findings over 15 minutes of warm-up time. Pay attention to the GPU temperature ramp on an open test bench and in a closed case. Despite the roughly four-degree delta between both configurations, clock rates hardly change between them.
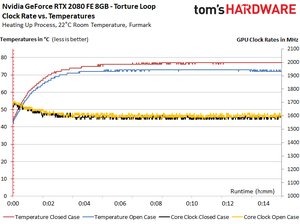
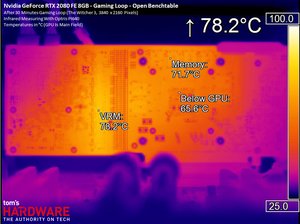
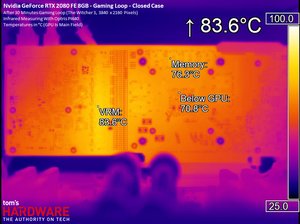
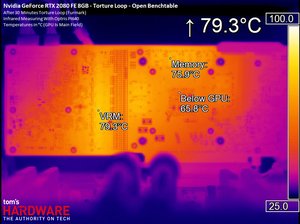
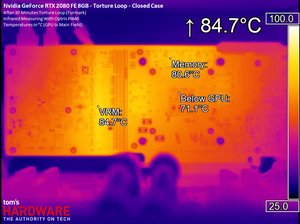
Next, we have high-resolution infrared pictures taken during our gaming loop and stress on the open bench and inside of a closed case. Large deltas are apparent from both examples. However, neither workload can expose a problem with cooling under the GPU package. Nvidia's thermal solution again shows itself to be highly competent.
Get Tom's Hardware's best news and in-depth reviews, straight to your inbox.
Infrared Measurements While Gaming
Infrared Measurements During Stress Test
MORE: Best Graphics Cards
MORE: Desktop GPU Performance Hierarchy Table
MORE: All Graphics Content
Current page: Temperatures and Clock Rates
Prev Page Power Consumption Next Page Nvidia’s Thermal Solution, In Depth-
velocityg4 What? No “just buy it” in your conclusion.Reply
Considering Founders edition usually starts about $100 more that standard edition. Plus, it is new to market. If a 2080 can be had for $100 more than a 1080 Ti. The price is as expected. -
Krazie_Ivan 2080 should have been the 2070, as it barely beats a 1080ti and is the TU104 die. and given the 30mo since Pascal launch, we should almost be looking at 3000 series benches. combine those two with the insane pricing, and Turing/RTX is a huge disappointment. DLSS could be nice and i'm glad Nvidia is pushing for RT development, but there's not enough positives here to justify the costs. $380 2080 / $500 2080ti (and relabel them to match their die codes, like Keplar-Pascal)... otherwise, no thx.Reply -
chaosmassive thank you for your thorough review on these cards,Reply
finally the card has been demystified and indeed for the price is it not worth the buy considering 1080 ti in such a low price..
turned out I dont need ray tracing in my life before I die. -
shrapnel_indie ReplyAfter seeing the GeForce RTX 2080 Ti serve up respectable performance in Battlefield V at 1920x1080 with ray tracing enabled,
Unfortunately, we’ll have to wait for another day to measure RTX 2080’s alacrity in ray-traced games. There simply aren’t any available yet.
Odd... either ray tracing graphics games are available or they're not. You can't test what isn't available for testing... and RT for BF5, last I heard was a zero-day patch... (or was it the modifications to RT that was supposed to improve FPS to acceptable levels.) -
cangelini Reply21333311 said:After seeing the GeForce RTX 2080 Ti serve up respectable performance in Battlefield V at 1920x1080 with ray tracing enabled,
Unfortunately, we’ll have to wait for another day to measure RTX 2080’s alacrity in ray-traced games. There simply aren’t any available yet.
Odd... either ray tracing graphics games are available or they're not. You can't test what isn't available for testing... and RT for BF5, last I heard was a zero-day patch... (or was it the modifications to RT that was supposed to improve FPS to acceptable levels.)
They're not available, but we've seen Battlefield 5 in action with ray tracing enabled ;) -
WINTERLORD wait a minute the 2080 has only one RT core and the 2080 has 72 RT cores? I think there may be an error in the review. update spoke to soon i think that means 1rt cluster...Reply
first page says " TU104 is constructed with the same building blocks as TU102; it just features fewer of them. Streaming Multiprocessors still sport 64 CUDA cores, eight Tensor cores, one RT core, four texture units, 16 load/store units, 256KB of register space, and 96KB of L1 cache/shared memory. " -
jimmysmitty Reply21333069 said:failure, this is a failure.
this gtx20 series looks like it won't be worth it.
I think sales will determine that and if history is anything without stiff competition from AMD I am sure they will sell just fine especially once the AiB cards come out.
21333082 said:What? No “just buy it” in your conclusion.
Considering Founders edition usually starts about $100 more that standard edition. Plus, it is new to market. If a 2080 can be had for $100 more than a 1080 Ti. The price is as expected.
Chris has never been like that.
That said, the pricing should be decent for AiB after a few months. When they launch they get price gouged. Still I would have loved a GTX 1080 price number. That GPU outperformed the 980 Ti by a good margin and was cheaper at launch.
Maybe AMD will come out with something sometime soon. Otherwise we wont see pricing drop. That or AMD will take advantage of the pricing increase and up theirs too.
