Guide: Overclocking AMD And Intel CPUs On A Budget
Core 2 Quad Q8200 O/C Performance And Efficiency
| Intel Quad-Core Test Settings | ||
|---|---|---|
| Default Settings | Overclock Settings | |
| CPU | Intel Core 2 Quad Q8200 2.33 GHz 4 MB L2 Cache, 1.16V | 2.69 GHz, (7x 384 MHz)1.29V core, 1.40V FSB |
| RAM | DDR3-1333 CAS 9-9-9-24, 1.50V | DDR3-1536 CAS 6-6-5-16, 1.65V |
| Motherboard | MSI P45 Diamond LGA-1366, P45/ICH10R, BIOS 1.5 (10/10/2009) | |
| Graphics | Zotac GeForce GTX260² 576MHz GPU, 999 MHz Shader, 896MB GDDR3-2484 | |
| Hard Drive | Western Digital VelociRaptor WD30000HLFS 300 MB, 10,000 RPM, 16 MB Cache | |
| Sound | Integrated HD Audio | |
| Networking | Integrated Gigabit LAN | |
| Software | ||
| Operating System | Microsoft Windows Vista Ultimate x64 SP1 | |
| Graphics | GeForce 182.08 Desktop |
A stock FSB clock that was already near the processor’s limit made this the most disappointing overclocking experience we can remember since National Semiconductor’s Cyrix MII. Its measly 15% gain felt like a tremendous achievement, however, considering the great effort required to reach a 2.69 GHz clock frequency.
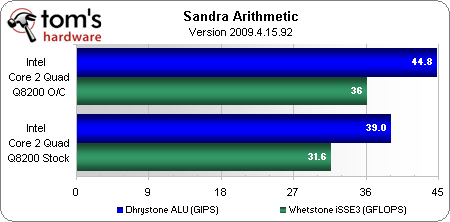
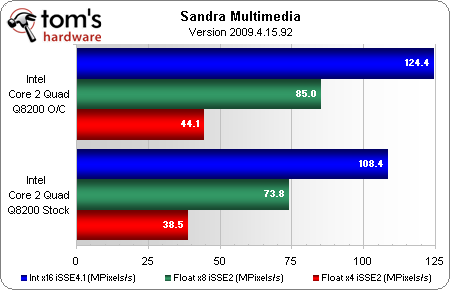
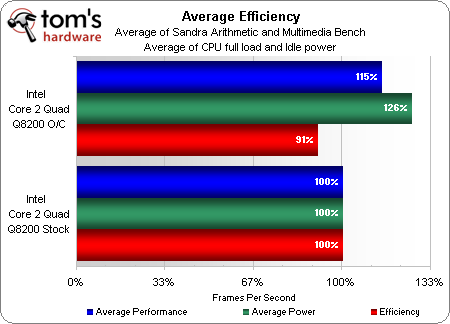
Sandra Arithmetic and Multimedia show CPU performance gains of 14 to 15 percent.
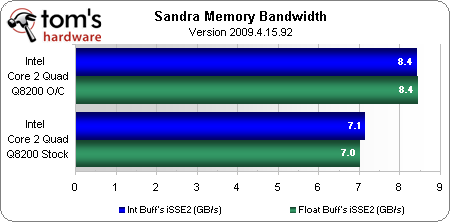
A memory bandwidth increase of 19% looks much better, but isn’t as noteworthy in a CPU overclocking guide.
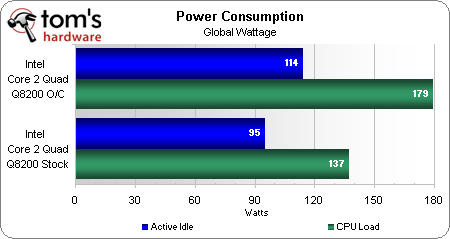
Low core voltage plus high FSB voltage brings a significant penalty in power consumption, even though performance gains were mediocre at best.
An efficiency loss of 9% results from a ratio of performance to power consumption for the overclocked configuration.
Get Tom's Hardware's best news and in-depth reviews, straight to your inbox.
Current page: Core 2 Quad Q8200 O/C Performance And Efficiency
Prev Page Overclocking Intel's Core 2 Quad Q8200 Next Page Recommendations-
tacoslave i like these "how to" articles but i still want to see the rest of the twkr article you promised us (quad crossfire 4890's) *sigh* a man can dream can't he?Reply -
snakeeater_za Surely people on a budget (like me) would prefer their e5200 to last longer than a 'few months or hopefully a yr to 3?' i know i will upgrade prob in a year or so, so a yr would be fine, but a few months? Pfffft. my proc vid is 1.225 and for 3.33ghz i need a vcore of 1.385 in bios which at idle is 1.36ish. So although im nowhere near 4 at least i wont suffer from electromigration and have to fork out for a new cpu! Just my 2 centsReply -
Crashman snakeeater_zaSurely people on a budget (like me) would prefer their e5200 to last longer than a 'few months or hopefully a yr to 3?' i know i will upgrade prob in a year or so, so a yr would be fine, but a few months? Pfffft. my proc vid is 1.225 and for 3.33ghz i need a vcore of 1.385 in bios which at idle is 1.36ish. So although im nowhere near 4 at least i wont suffer from electromigration and have to fork out for a new cpu! Just my 2 centsReply
It's all a game of averages. Tom's Hardware hasn't accidently killed a processor by overclocking it in a while, though I'm sure a couple editors have intentionally done so to find the voltage limit. The problem is, once again, you can only look at averages.
3 months continuous use at 1.45 volts caused an E8500 to lose its OC stability. It had to be clocked down to become stable again, and lost much of its voltage tolerance. It wasn't destroyed however.
1.40 volts should be significantly safer than 1.45 volts, but until a few people report on how long their cores lasted at 1.40 volts its impossible to tell "how much safer", that is, how much longer it will last. All that's known is that it should last "significantly" longer, but whether that's 4 months (33% longer) or 30 months (10x longer) is the unanswerable question. -
astrodudepsu Good show mate.Reply
I would have liked to see combined charts as a conclusion but that's a minor criticism.
I'm just wondering what the 'next-gen' E5200 (i.e. the intel people's OC'er) will turn out to be? Some flavor of i5 I assume, but who knows. -
JeanLuc LinkReply
"Intel’s value-priced Core 2 Quad Q8200 uses two of the same processor dice as the Pentium E5200....."
I don't know why you choose the Q8200 it's a notoriously bad overclocking chip, if you wanted a budget Intel Quad core that had room for overclocking you should have bought the Q6700/Q6600. -
”Motherboard MSI P45 Diamond LGA-1366, P45/ICH10R, BIOS 1.5 (10/10/2009)”Reply
MSI P45 Diamond is not LGA1366, but LGA775. LGA1366 is for Core i7 processors only, LGA1156 is for Core i5 and i7 (only dual channel DDR3-1333/1066). LGA775 is the old socket, for Celeron D, Celeron 4xx, Pentium Dual Core, Pentium 4, Core 2 Duo, Core 2 Quad. -
da bahstid No games? Like...none at all? Does anybody even overclock for reasons other than games?Reply
Otherwise, pretty good article. Though perhaps a better choice for the Intel quad would have been a 9550...I thought they were under $250 by now. Same time, I guess the Q8200 does seem to be a more difficult overclocker...Intel may have intended this to be the case so as not to gut sales of their Q9000 series. And readers may as well know before jumping on a Q8200 thinking it'll overclock like an E5200.
