Micron P420m SSD Review: 1.4 TB Of PCI Express-Attached Storage
After the success of its P320h, Micron is following up with the P420m, an MLC-based PCI Express x8 add-in card aimed at more read-oriented enterprise customers. How does it compare to the company's SLC-based flagship? We benchmark ours thoroughly.
Results: Performance Consistency
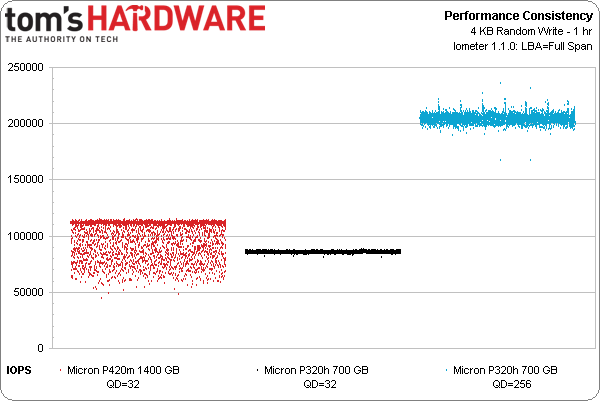
In the following tests, we subjected our enterprise SSDs to 25 hours of continuous random 4 KB writes across each drive. We recorded the IOPS every second, giving us 90,000 data points. We then zoomed in to the last 60 minutes to more coherently visualize the results.
As you can see from the graph above, the P420m, while delivering high overall average IOPS, also produces some noisy results. Depending on your take, the P420m actually performs better than the P320h at a queue depth of 32. In terms of consistency, though, the P320h is still a far superior drive. At a queue depth of 256, the P320h takes a clear and commanding lead.
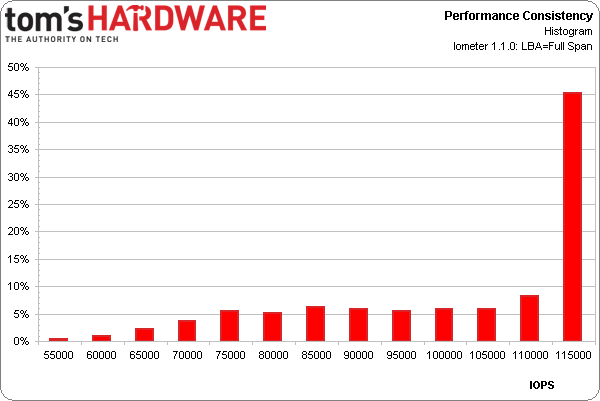
The consistency graph doesn't always tell the whole story because outliers show up more prominently than clusters of points. When looking at the histogram, you can see that roughly 70% of the data-points meet Micron's specification. Compare that to the P320h at a queue depth of 256, where 87% of the data points are at or above the specification, and 99% fall within 97.5% of its spec. Looking at the results differently, the P420m has a standard deviation of 16,000 IOPS, while the P320h's is only 4,000 IOPS.
Get Tom's Hardware's best news and in-depth reviews, straight to your inbox.
Current page: Results: Performance Consistency
Prev Page Results: 4 KB Random Performance And Latency Next Page Results: Enterprise Workload Performance-
merikafyeah Seems like enterprise non-volatile storage is finally starting to approach the speeds of comsumer ram drives:Reply
http://www.thessdreview.com/our-reviews/romex-fancycache-review-ssd-performance-at-13gbs-and-765000-iops-in-60-seconds-flat/
Considering that the cost/GB of RAM is about $7/GB, it may not be such a bad idea to use RAM storage + backup generators instead of traditional non-volatile flash nand. -
rezzahd Maybe once the price drops I would pick one of these up, but I think we all know it will be a while before that happens.Reply -
BasslineJunkie Reply
Same here. I love the concept but price/gb isn't where it should be. But i do have some extra pci express slots that need filled!11507252 said:Maybe once the price drops I would pick one of these up, but I think we all know it will be a while before that happens.
-
utomo It is good to see good competition like now. keep comparing like this and hope soon we will get the good mature technology. now the SSD still have many improvement ideas. manufacturer need to work harder to win the market which is big.Reply -
ACTechy Awesome. Later down the road, when the price falls, these are going to be the thing to have. Really like PCI based SSD.Reply -
urbanman2004 TL;DR. I could benefit from something like this saving space on my system. It must have a hefty priceReply

