Plextor M6e 256 GB PCI Express SSD Review: M.2 For Your Desktop
Plextor's next-gen M6e is a M.2 2280 PCIe SSD combined with a x4 PCIe adapter. You probably don't have a M.2 PCIe slot yet, but Plextor hopes their Marvell 9183 powered SSD will find a home in enthusiast systems thanks to their adapter.
PCMark 8's Storage Consistency Test
Futuremark's PCMark 8 takes everything that was good about PCMark 7's storage testing and makes it better. The standard PCMark 8 storage components include real trace activity for 10 different activities. These recorded I/O segments include productivity, gaming, and photo/video manipulation, yielding individual sub-tests. At the end, each category is scored in seconds, a master throughput score is conferred (similar to the average data rate in our Tom's Hardware Storage Bench), and the benchmark generates a total score.
The Plextor M6e displays normal PCMark 8 Storage benchmark stats like so:
| PCM8 Storage | PCMarks | Bandwidth | WoW | Battlefield 3 | Photoshop (Light) | Photoshop (Heavy) | Adobe Illustrator |
|---|---|---|---|---|---|---|---|
| Plextor M6e 256 GB | 4971 | 280.57 MB/s | 58.4s | 133.4s | 113.7s | 359.9s | 70.8s |
| PCM8 Storage | Adobe InDesign | Adobe After Effects | Adobe Illustrator | Microsoft Word | Microsoft Excel | Microsoft PowerPoint |
|---|---|---|---|---|---|---|
| Plextor M6e 256 GB | 57.5s | 70.8s | 72.0s | 28.3s | 9.2 | 9.2 |
This is what the standard PCMark 8 storage test looks like.
Although that's illuminating, the newest version of PCMark 8 Professional includes extended storage tests, which allow us to dig deeper into SSD performance.
In truth, on a new or lightly-used drive, it's hard to distinguish one model from another. It takes tough workloads running over long periods of time to expose the issues that might affect our recommendations. PCMark 8's storage consistency component is designed to hit SSDs with those tasks, getting consumer-oriented products dirty enough to sink the bad ones.
Whether you run PCMark 8's normal or extended tests, those 10 traces form the backbone of this benchmark. As they're played against the drive under test, information is measured and recorded. The extended storage tests simply repeat the traces multiple times using varying conditioning procedures before each session.
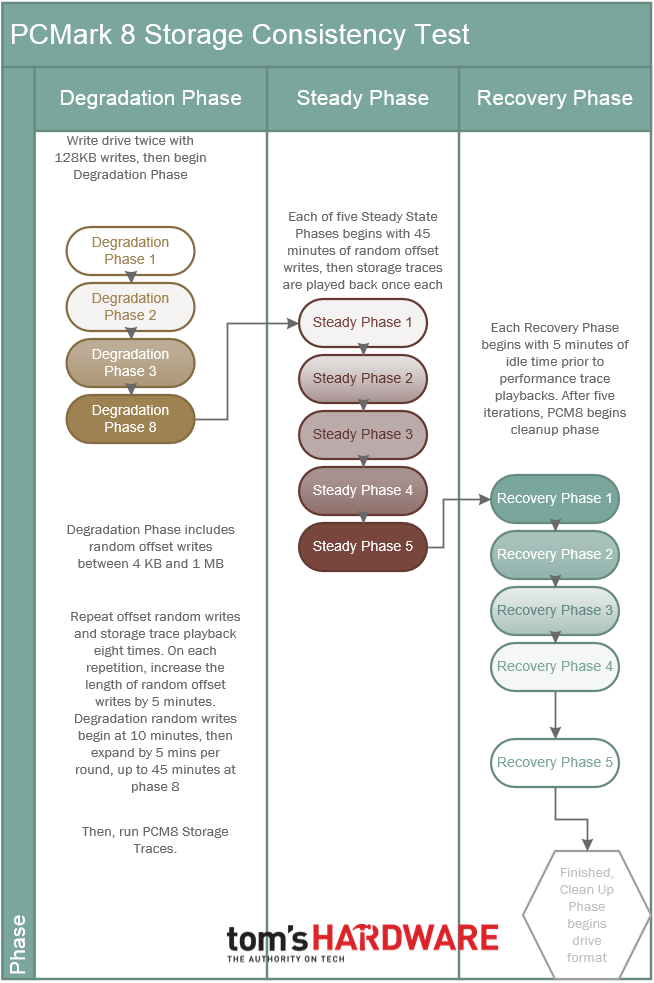
First, the raw block device (there is no partition) is preconditioned twice by filling the entire accessible LBA space with 128 KB sequential writes. Once that is completed, the first Degradation Phase randomly writes blocks between 4 KB and 1 MB in size to random LBA spaces on the drive. Since the writes aren't 4 KB-aligned much of the time, the SSD's performance drops quickly. After all, non-4 KB-aligned accesses create overhead and generally increase write amplification significantly.
Get Tom's Hardware's best news and in-depth reviews, straight to your inbox.
The first Degradation Phase begins with 10 minutes of those punishing random offset writes, after which each PCMark 8 activity trace is played against the SSD being tested. The successive degradation rounds are similar, except an additional five minutes are tacked onto each iteration. After eight repetitions, that write period expands to 45 minutes.
Next comes the Steady Phase. Each of five Steady Phases writes 45 minutes worth of random offset data prior to trace playback, pushing the drive even harder and making it more difficult to perform housekeeping duties. With fewer blocks available for writing, latency increases substantially.
Lastly, PCMark 8 moves into a Recovery Phase, which consists of five idle minutes before trace playback. Repeat that five times, and the test concludes.
This particular PCMark 8 test is brilliant in that it stresses SSDs methodically with preconditioning, followed by trace playback. You end up with a ton of data covering bandwidth, latency, and duration for all 10 traces and each of the 18 phases. But tracking that information lets us paint a picture of drive performance through each step of the benchmark. Every drive takes a beating during the Degradation and Steady Phases, but the Recovery Phase should push the most resilient drives to the forefront. SSDs that rely on garbage collection during write activity (and not background garbage collection) may not benefit much from this recovery time.
On to the testing.
Storage Consistency With PCMark 8's Adobe Photoshop (Heavy) Trace
Because there are 18 individual rounds packed with 10 traces each, we need to focus. We'll choose one trace, Adobe Photoshop (Heavy), and keep tabs on it through the entire extended run.
Bandwidth
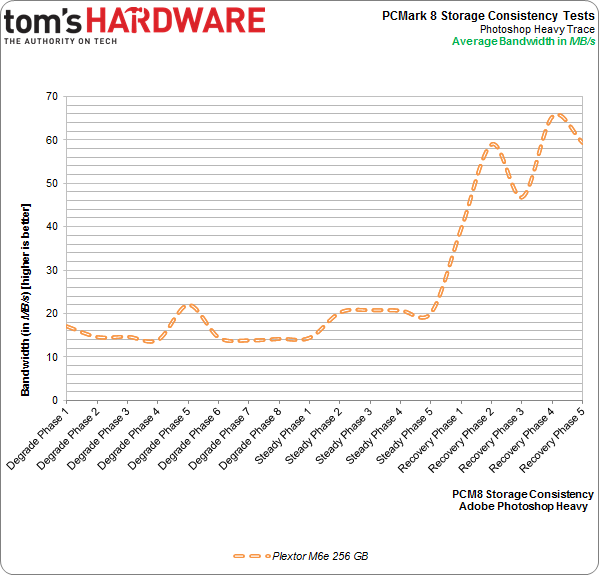
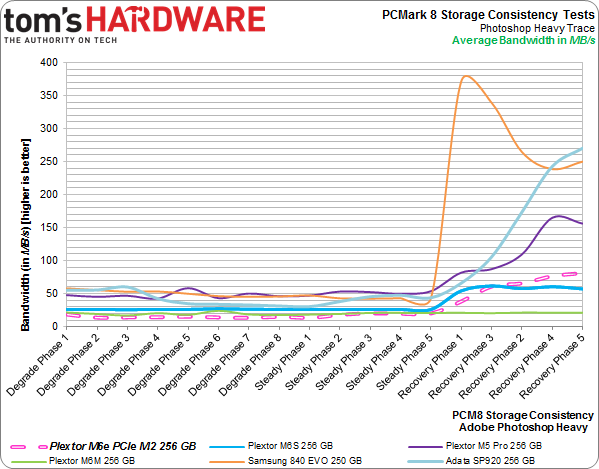
First we have total bandwidth during each iteration of the Photoshop trace. The M6e is hammered right off the bat, averaging just over 15 MB/s of read and write bandwidth for the first eight rounds. As the test transitions into its Steady phases, the M6e continues to drag. But give it a few minutes to recover and watch out; the last two runs achieve more than 60 MB/s.
That might have been more impressive if the 256 GB SP920, 256 GB M5 Pro, and 250 GB 840 EVO SSDs didn't blow Plextor's PCIe-attached drive out of the water. Samsung's mainstream offering, in particular, is potent.
But given what we saw in our own trace test, latency should be more illuminating than bandwidth.
Latency
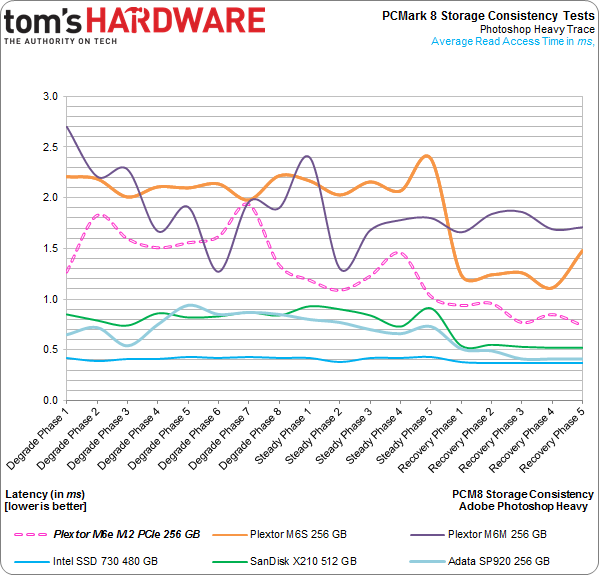
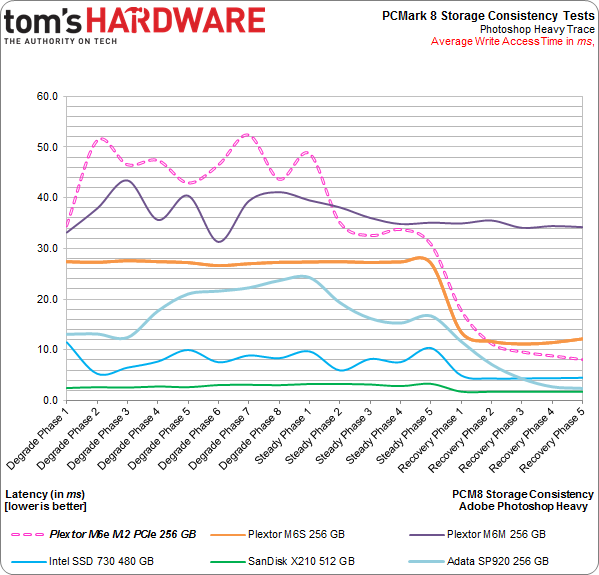
In this test, we're taking that same Adobe Photoshop (Heavy) trace and using average read and write latency to illustrate responsiveness. We'll sprinkle in some competing drives for comparison, too.
Plextor's M6e doesn't demonstrate the worst average read access time. And it gets better during the Recovery Phases, too.
Our Storage Bench trace has some idle time left in, though not much. This means the M6e could be going in and out of slumber more often in that test than it does in PCMark 8. For the sake of brevity, Futuremark cuts out all idle time.
Lower is better in this chart, and we see that Plextor's M6e starts bad, gets worse, and is at least able to beat the M6M and M6S by the end of the Recovery Phases. In fact, the M6e even approaches Intel's SSD 730 after some rest time.
But as it's getting hammered in PCMark's Degradation Phases, write access latency continues to pose an issue.
Current page: PCMark 8's Storage Consistency Test
Prev Page Results: TRIM Testing With ULINK's DriveMaster 2012 Next Page A Sexy Form Factor You'll Want More Than Need-
dgingeri Someone needs to build an adapter that connects to a PCIe x8 slot and has mounting points for up to 4 or 8 PCIe M2 SSDs.Reply -
Au_equus lots of empty space on that PCB and its only a half height card. Maybe its possible we can see multiple TB PCIs SSDs in the consumer space or they may just restrict it to enterprise.Reply -
Amdlova 300 dollar for 256 gb... i can buy 4x 120gb v300 kingston (2200mb/s R) (1920mb/s W)Reply
raid 0. too expensive. that plextor -
menetlaus Who keeps telling you there is no demand for M.2 drives?Reply
I bought a Lenovo Y410P shortly after they were released (and was incorrectly told it had mSATA not NGFF/M.2 for the SSD), and have been waiting over a year for a decent M.2 drive to put in it. -
swordrage May be in a few years we will see an ssd connected to a PCIe x16 the and size of a graphics card.Reply -
nekromobo How much does it add to boot-time with its bios loading stuff? Other PCI-e cards add as long as a 1-2 minutes to boot time.Reply -
dgingeri It's only a single AHCI device, and it doesn't have to wait for spinup like other raid controllers, so likely only a second or so extra init time.Reply -
cryan Reply13209105 said:lots of empty space on that PCB and its only a half height card. Maybe its possible we can see multiple TB PCIs SSDs in the consumer space or they may just restrict it to enterprise.
The drive itself has no wasted space. The bridge board has plenty, being that the drive is only 22mm x 80mm.
Regards,
Christopher Ryan
-
cryan Reply13209786 said:How much does it add to boot-time with its bios loading stuff? Other PCI-e cards add as long as a 1-2 minutes to boot time.
It adds all of about a second. You'll never notice, and based on UEFI settings, you might never even see the Plextor op-rom splash screen at post.
Regards,
Christopher Ryan
