Powenetics: A Better Way To Measure Power Draw for CPUs, GPUs & Storage
Sample Measurements: Nvidia Titan X (Pascal) 12GB
The polling rate for all measurements, except those collected from GPU-Z, is 2ms. By default, GPU-Z's default polling rate is 1s. But for all future measurements, we'll use a 0.1s interval.
Current Measurements
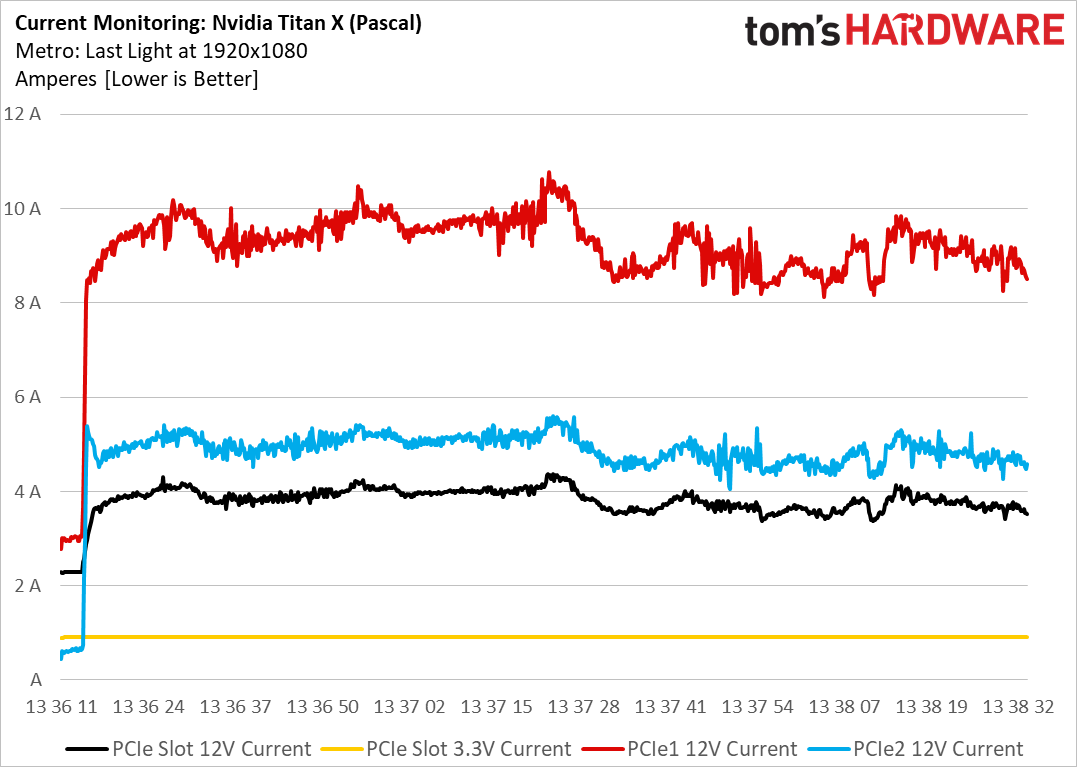
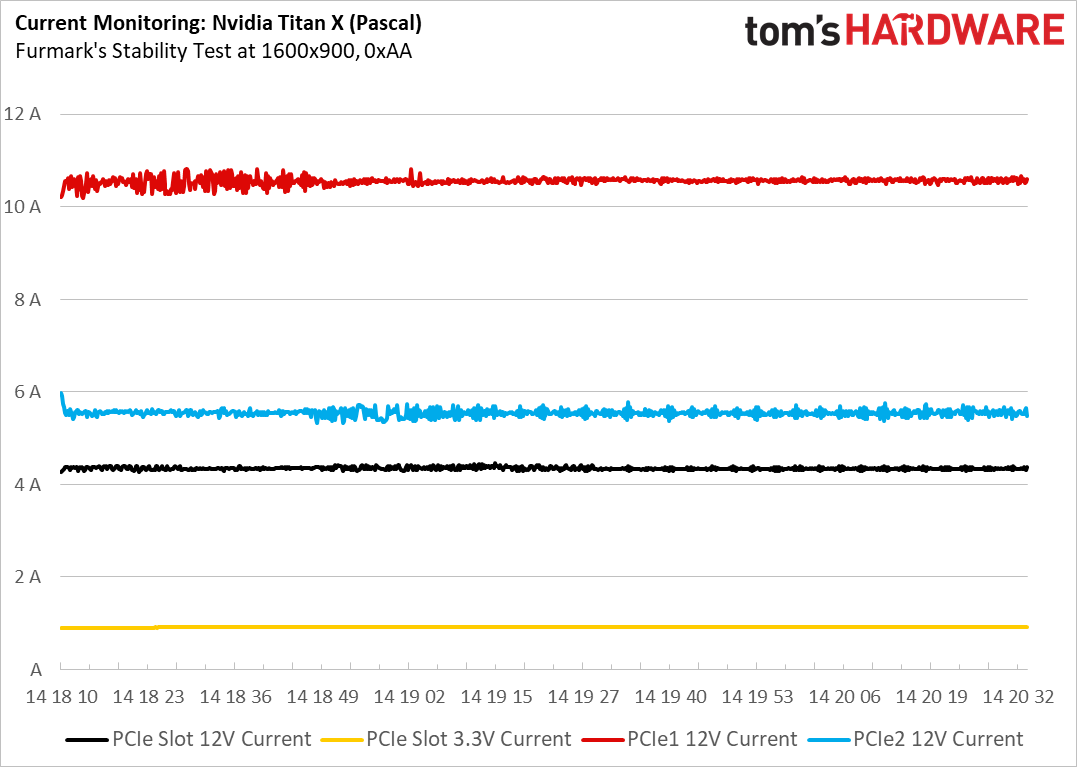
The current-consumption readings demonstrate notable variations in the game benchmark, corresponding to the varying game workload. In comparison, FurMark hammers the Titan X, resulting in far less deviation.
Power Measurements
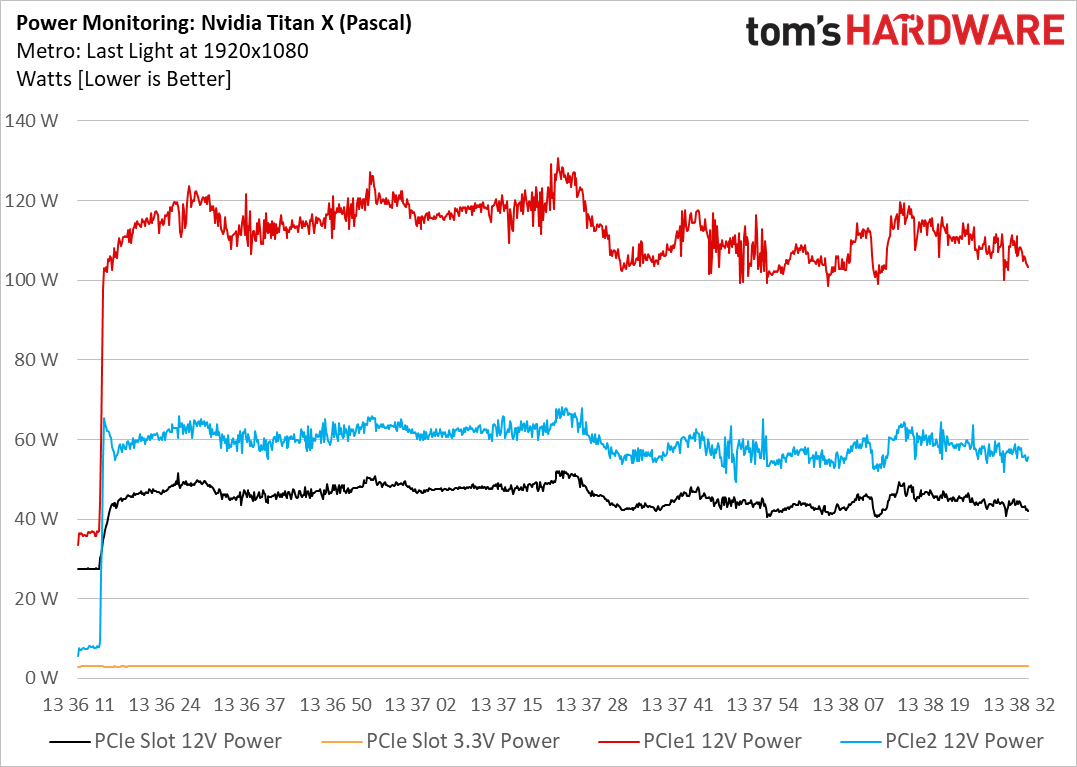
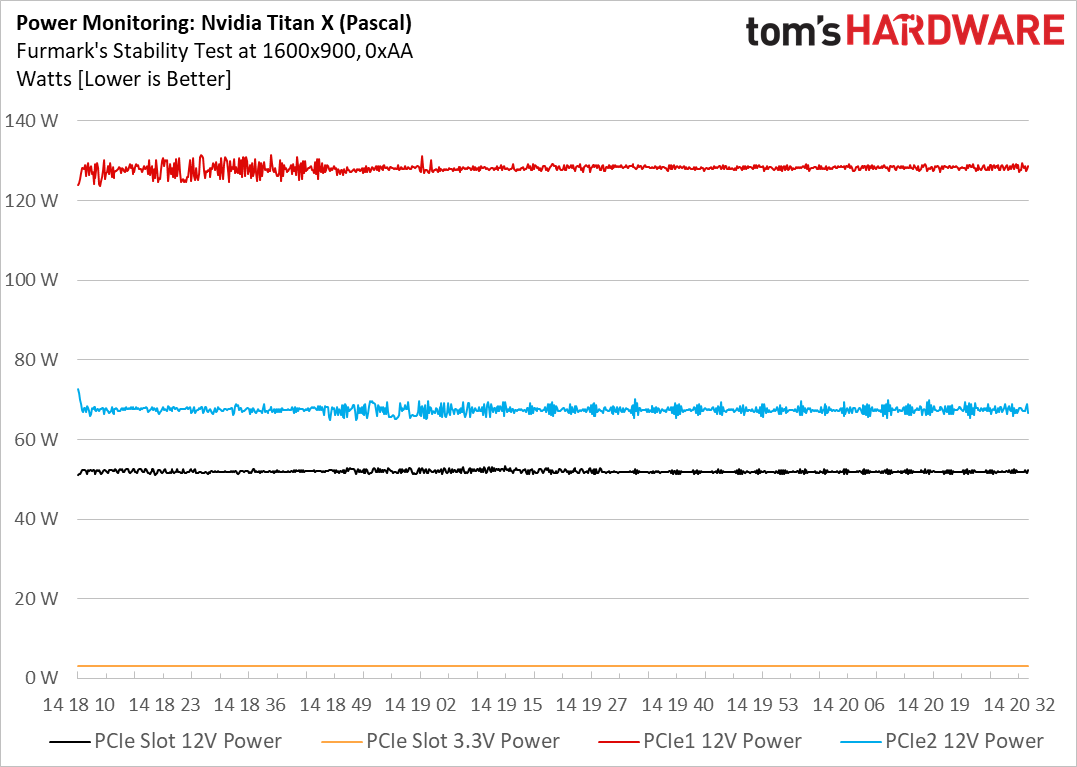
Clearly, FurMark's stability test provides a higher load to the graphics card, and during the start of the test there are some low deviations on the power readings of the first PCIe connector.
Vcore (VDDC)
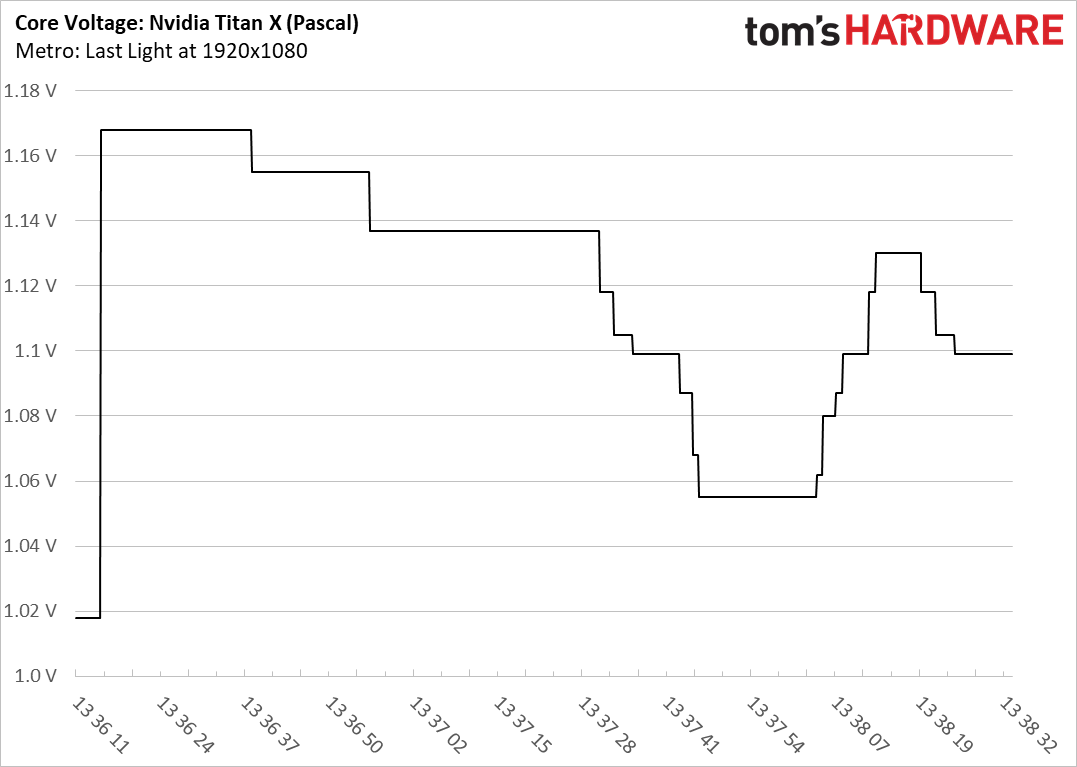
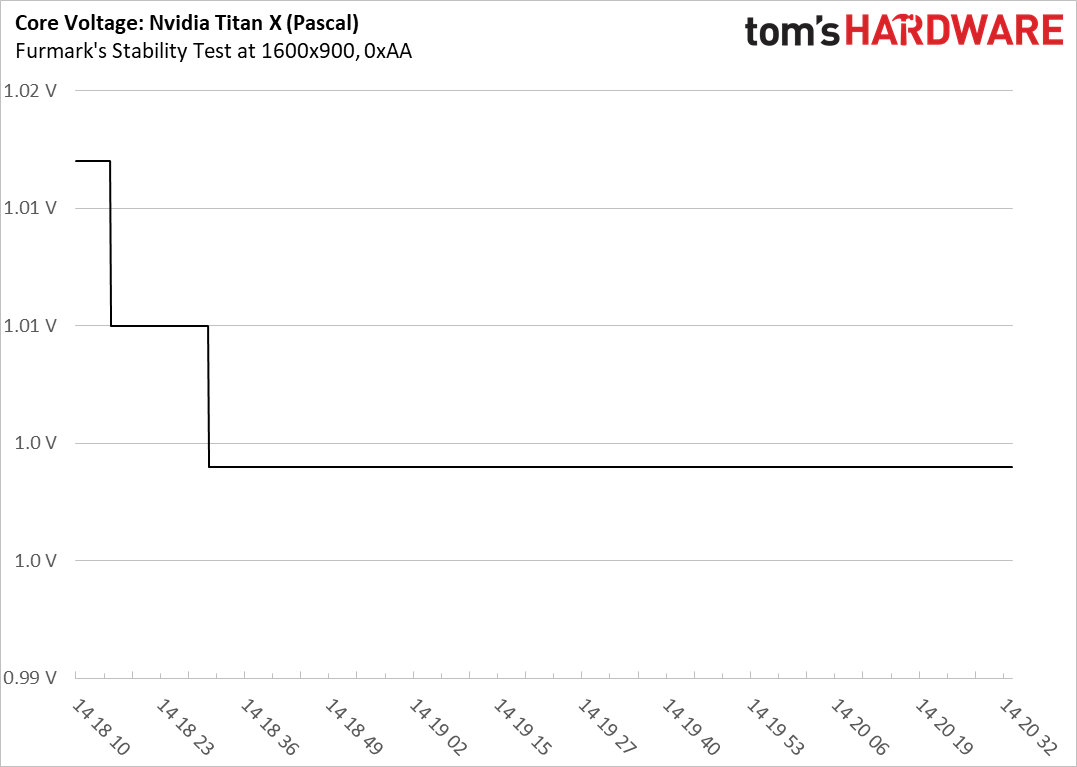
Core voltage during the Metro: Last Light benchmark is higher compared to FurMark, which puts more stress on the GPU.
GPU Temperature
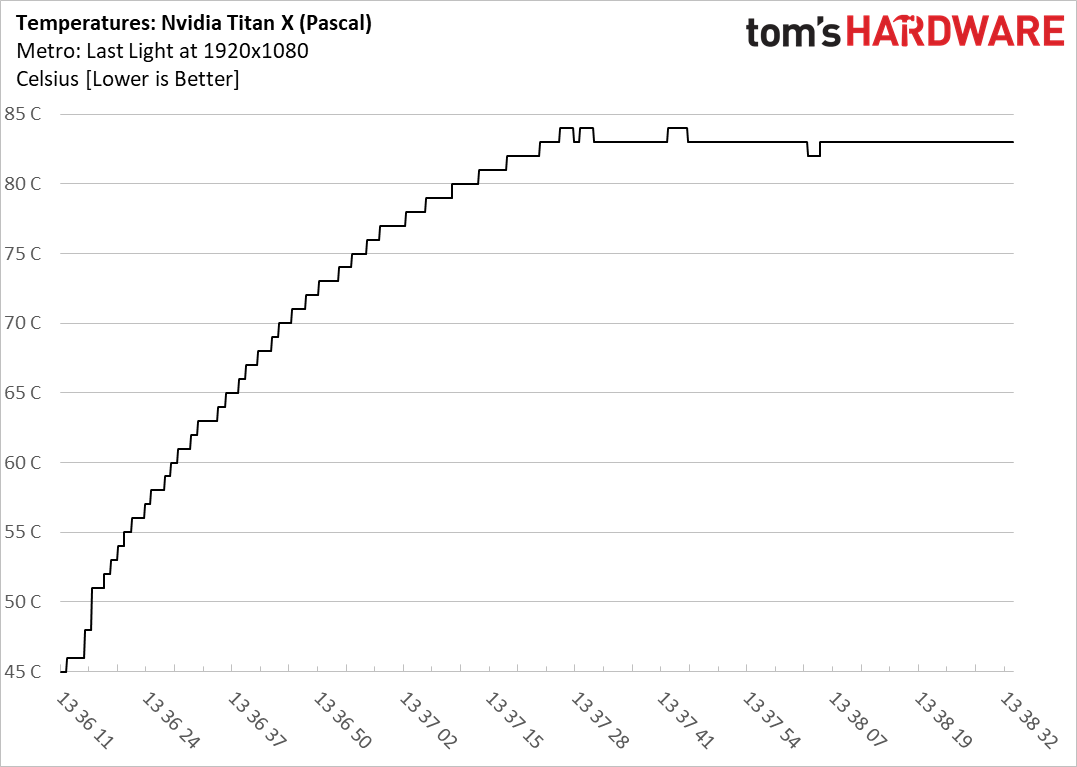
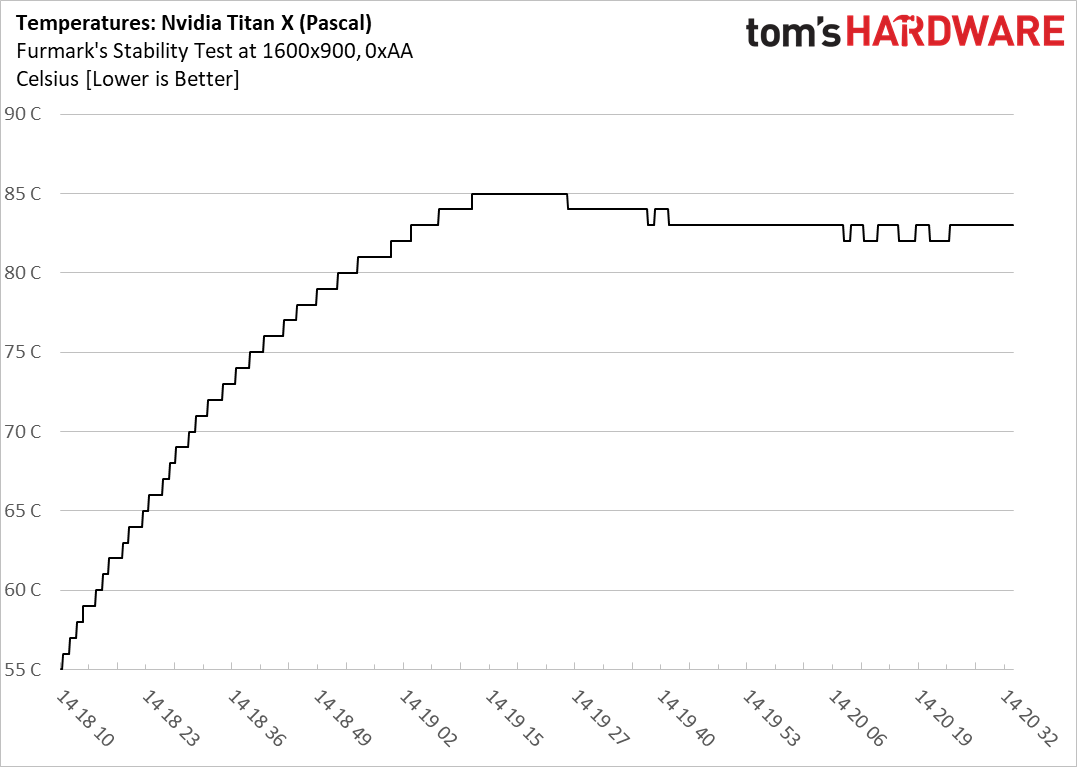
Fan Speed
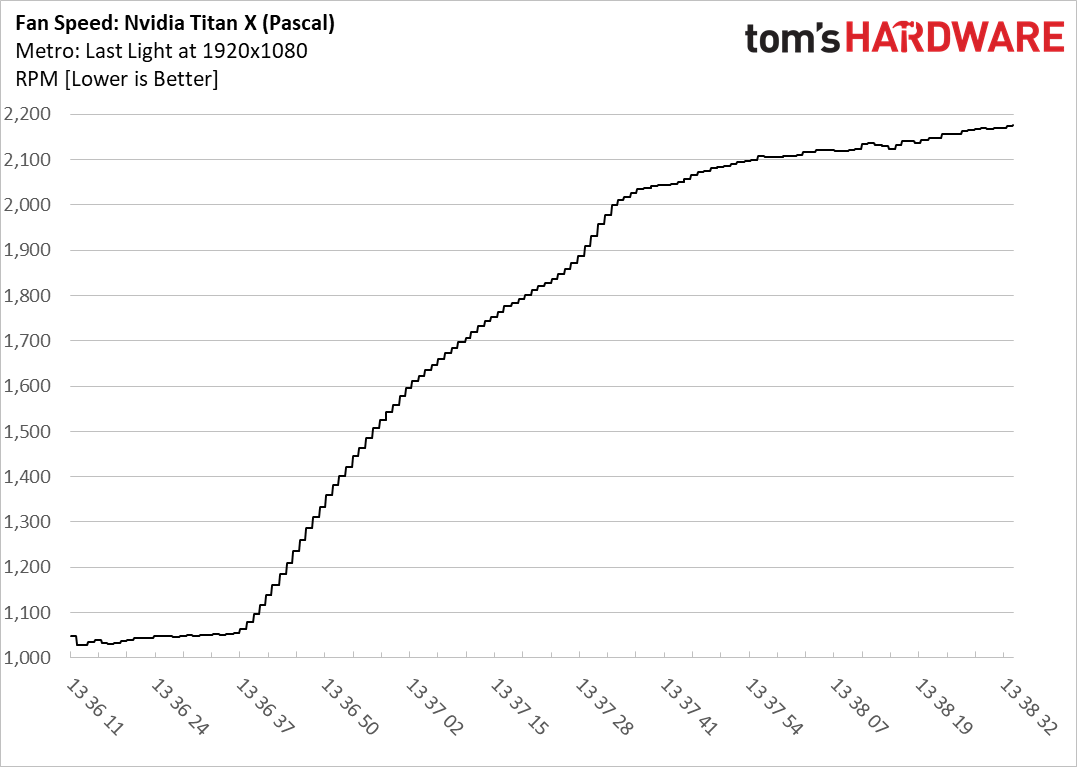
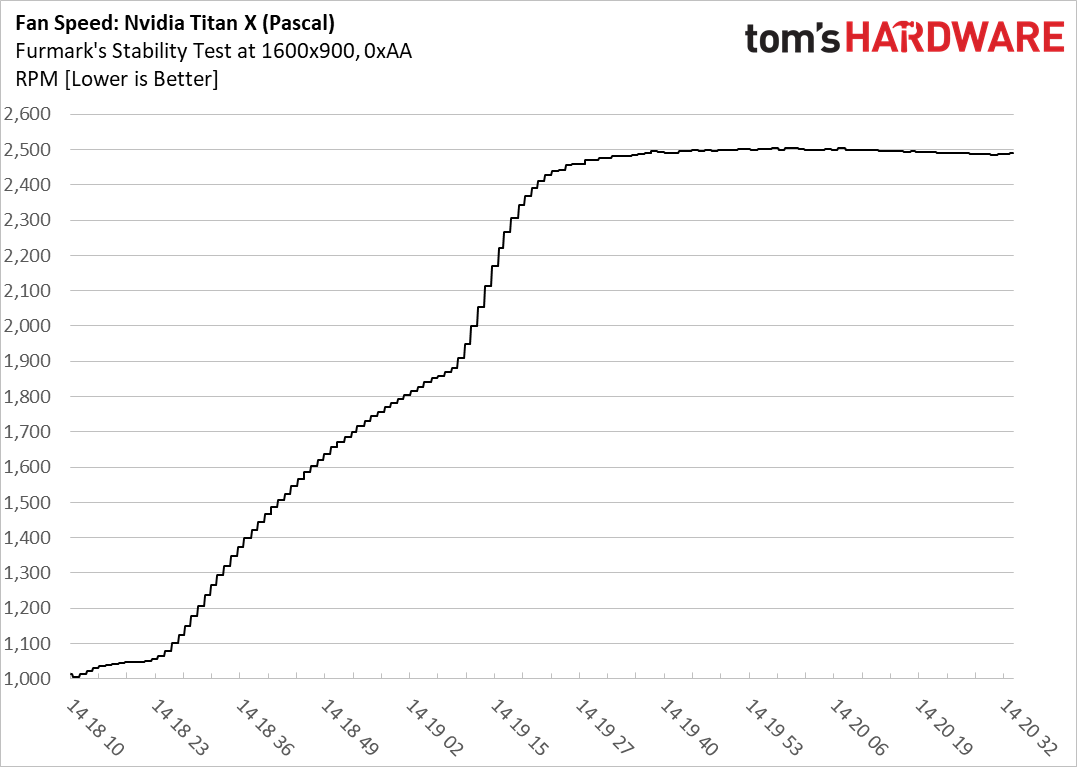
The fan spins at higher RPM during the FurMark stability test, since the GPU has an increased thermal load.
Power Consumption Charts
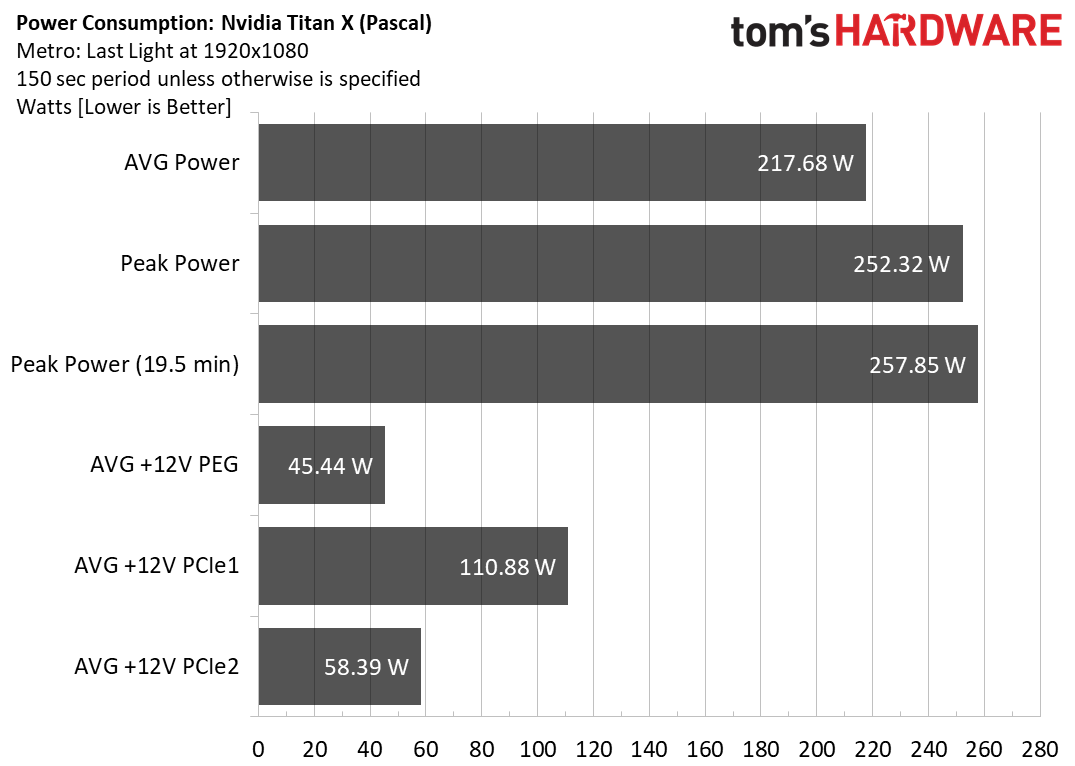
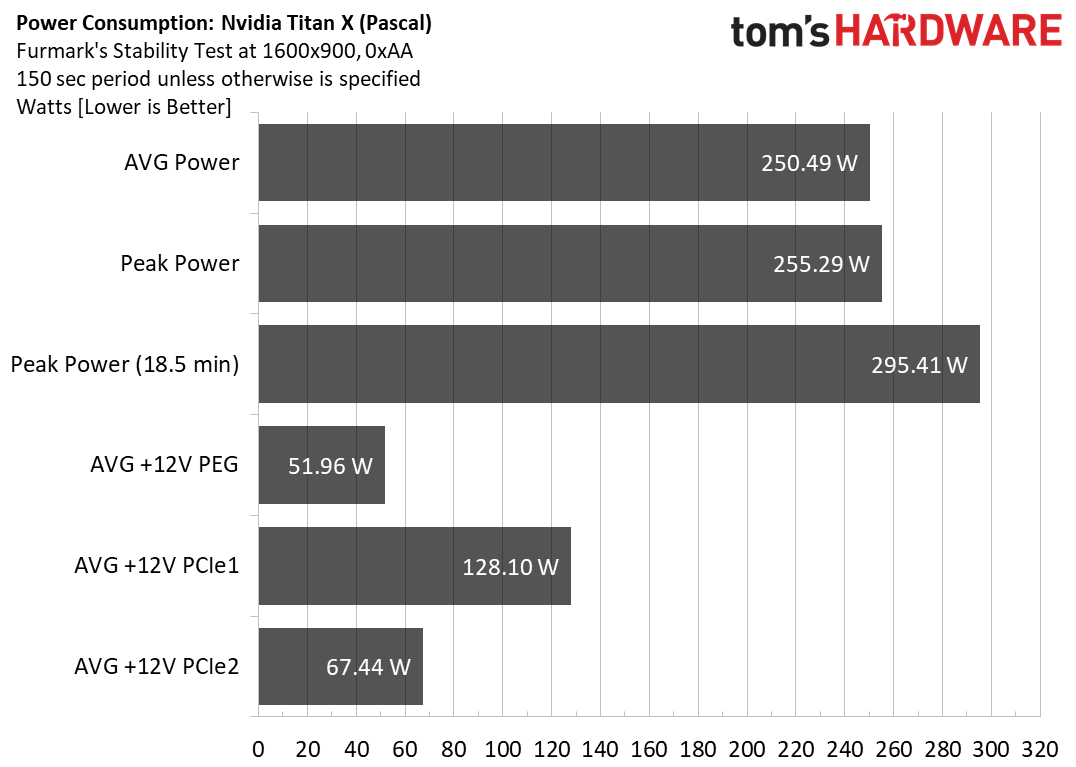
In the Metro: Last Light benchmark, the average power reading is significantly lower than the peak that the Powenetics system measured. Moreover, the peak power reading during a 2.5-minute period isn't far away from the 19.5 minutes of testing we sampled from.
On the contrary, this is not the case with FurMark. Once we used all measurement data, we noticed a power spike that went up to 295.41W. This spike lasts only milliseconds, though.
Get Tom's Hardware's best news and in-depth reviews, straight to your inbox.
The average power reading over a 2.5-minute period in FurMark is very close to the corresponding power reading. This benchmark provides a steady high load, which stresses GPUs to the max. (This is why it isn't realistic.) However, it still allows us to check a worst-case scenario.
MORE: Best Power Supplies
MORE: How We Test Power Supplies
MORE: All Power Supply Content
Current page: Sample Measurements: Nvidia Titan X (Pascal) 12GB
Prev Page The Powenetics Control/Monitoring Software Next Page The Powenetics Project: What Lies Ahead
Aris Mpitziopoulos is a contributing editor at Tom's Hardware, covering PSUs.