Tuning Radeon R9 290X: Replace The Thermal Paste For More Efficiency
After receiving an enormous amount of feedback on our Radeon R9 290X review, we grabbed yet another retail board, which demonstrated the same performance issues under load as we saw in our earlier investigation. Looks like it's time to disassemble a card!
Power Consumption: Before And After
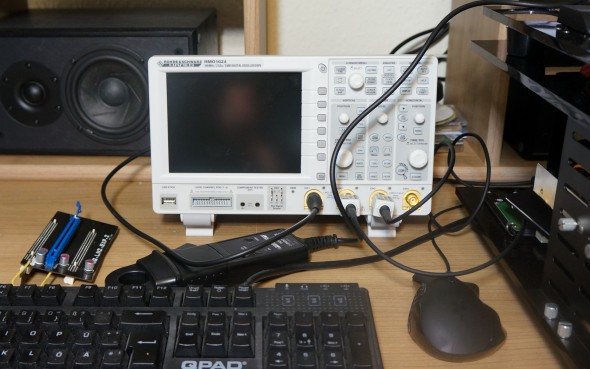
Our test system for power consumption measurements is a result of a cooperation with HAMEG (Rohde & Schwarz). It gives us the opportunity to present highly accurate values based on the use of a precise multi-channel oscilloscope with remote control.
We log every relevant channel, and all measurement values and graphs get saved to the scope. Our very nice clamp-on ammeters provide 100 mV/A, so we can easily derive current based on the measured voltages. The actual supply voltage is recorded and multiplied by the current later on.
For what it's worth, power consumption peaks do not always correspond to action happening on your screen, as you can see from the following sample video, which also demonstrates how the Radeon R9 290X's power consumption gradually falls, since the card isn't able to sustain consistent maximum clock rates.
| Measurement Setup: | Non-contact DC-measurement at the PCIe slotNon-contact DC-measurement at the external PCIe power supply Direct voltage measurement 3.3 V / 12 V |
|---|---|
| Measurement Devices | Oscilloscope:HAMEG HMO 1024 four-channel DSO with storage function and Ethernet remote controlClamp-on ammeter adapter:HAMEG HZO50 (1 mA-30 A, 100 kHz, resolution: 1 mA), Voltcraft VC-511Probe:HAMEG HZ154 (1:1, 1:10), variety of additional adaptersDigital multimeter:Voltcraft VC-950 with multi-channel data logging function |
| Bench Table: | Microcool Banchetto 101 |
| Test System | AMD FX-8350 @ 4.5 GHz Corsair H100i closed-loop liquid cooler16 GB (2 x 8 GB) Corsair Vengeance DDR3-1866 Asus FX990 Sabertooth (modified PCIe attachment with current loops) |
| Power Supply Unit | Corsair AX860i (modified outputs with measuring taps) |
Three Runs With AMD's Stock Thermal Compound
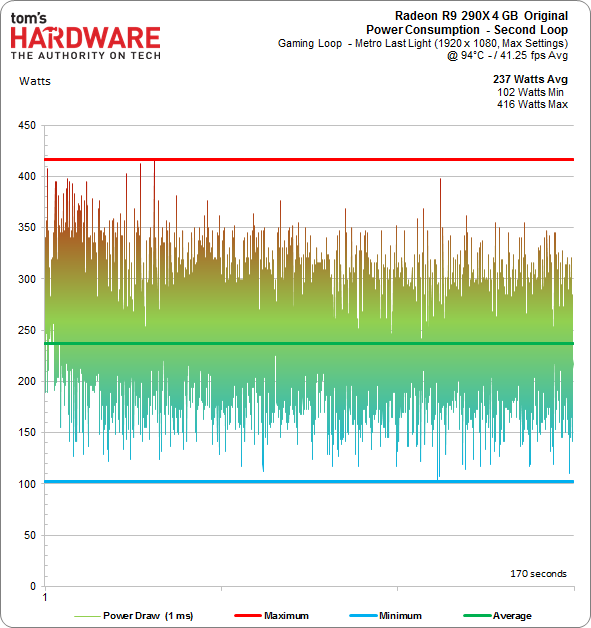
We start by running three successive test loops. The Radeon R9 290X hits its target temperature in the last quarter of the first loop, which is also where we see the highest power consumption (and peak performance).
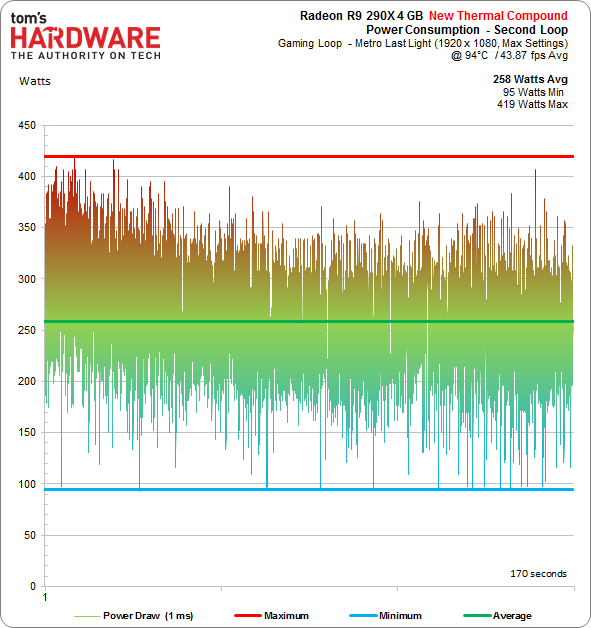
The GPU temperature remains constant during the second loop, while power consumption falls considerably.
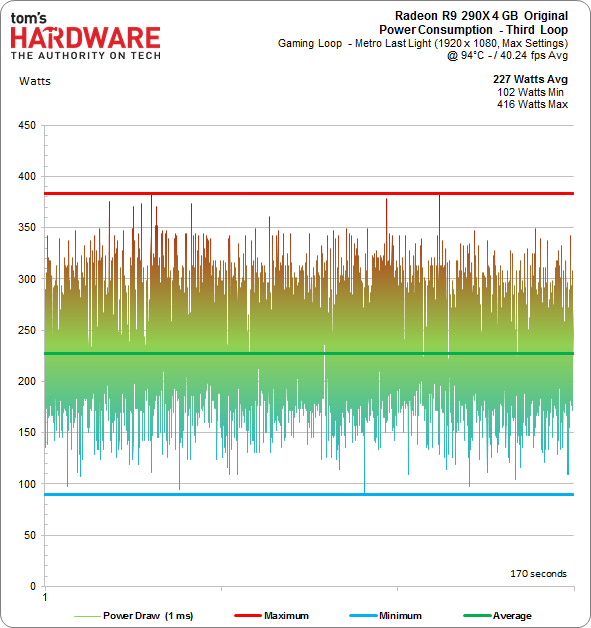
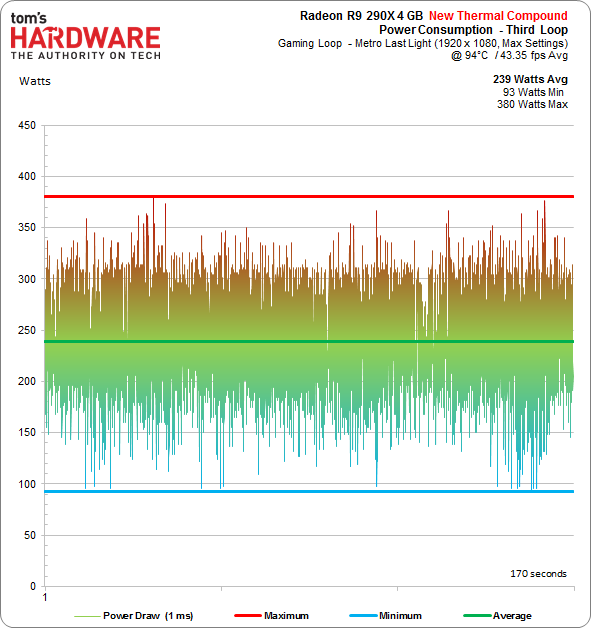
Although performance erodes again at the beginning of the third loop, we get consistent results from then on. Power consumption is reduced by another 10 W, and the peaks and troughs in this chart are clearly less intense.
Three Loops With Gelid's GX-Extreme
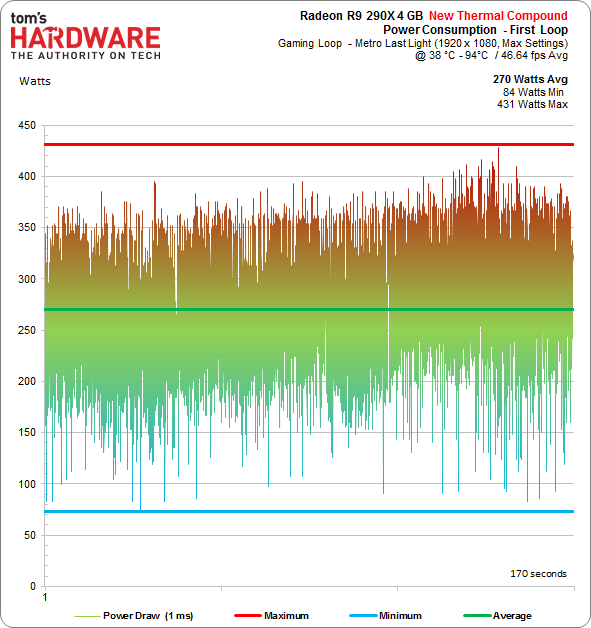
By using a higher-quality thermal paste, idle temperatures decrease considerably and we gain a slight increase in performance as power consumption rises by 20 W compared to the previous first loop.
Get Tom's Hardware's best news and in-depth reviews, straight to your inbox.
Again, power consumption drops during the second loop as the GPU heats up. As soon as the Radeon R9 290X reaches its target temperature, Power Tune takes action and slams on the brakes, although the difference in average power consumption remains at 20 W.
And for the second time, loop number three yields a more consistent result at a lower performance level. The power consumption gap narrows to 12 W compared to this same run using AMD's stock thermal compound.
What have we seen so far? Well, we know that Power Tune takes action as soon as the GPU reaches its target temperature, but it takes some time after that before power consumption decreases significantly. How well is Power Tune working? A drop in power consumption of 11.5 and nine percent between the original and alternative thermal compounds is accompanied by a commensurate performance drop. And what about efficiency? Does replacing the interface material also yield an improvement there? We'll answer that question shortly.
Current page: Power Consumption: Before And After
Prev Page Take Off Your Top! Radeon R9 290X Gets Naked Next Page Performance And Efficiency
Igor Wallossek wrote a wide variety of hardware articles for Tom's Hardware, with a strong focus on technical analysis and in-depth reviews. His contributions have spanned a broad spectrum of PC components, including GPUs, CPUs, workstations, and PC builds. His insightful articles provide readers with detailed knowledge to make informed decisions in the ever-evolving tech landscape
-
Benthon Pretty disappointed to see the surface was so beat up, but still great to see what a little thermal paste upgrade can do.Reply -
Mottamort Great article again, Tom's has released some really informative articles the past few months, keep it up!Reply -
ginjaninja7 Well we wil have to see how the GPU performs with Gigabyte's own Cooling system. :-)Reply -
Crashman Reply
I like blower coolers when they work right, but I can guarantee that no company will produce a 290 with a top-end blower. These companies are just too lame to come up with anything like that. They'll go with triple-fan solutions to appease users who don't care about all the heat that rises up to their CPUs, or simply don't know any better. And Nvidia will remain the only supplier of cards with top-end blower coolers.11962019 said:Well we wil have to see how the GPU performs with Gigabyte's own Cooling system. :-)
-
s3anister "The biggest problem with this is that you void the manufacturer's warranty in the process. "Reply
Yeah, no thanks. The stock TIM should be the best solution already and the fact that it's not is crap either way. If you add in the fact that you need to replace the TIM to get decent results it's total bs. -
Zeh It's clear that AMD, maybe nVidia and their partners aswell, have a lot to learn from TomsH when it comes to details.Reply
The cost savings they would get by deliberately choosing not to do a finishing pass during their machining process, aswell as the badly applied and poor quality thermal grease would SURELY NOT make sense on a flagship aiming to be the best single gpu on the market.
@AMD: Details matter. Especially the low cost, effective ones.
@Crashman: Do you prefer blower type coolers? Correct me if I'm wrong, but dont they trade acoustic performance for getting rid of hot air? -
faster23rd Wow, beating even the 780 ti with that kind of margins and with just (well, it does void the warranty) a change of thermal paste! Goes to show what kind of beast Hawaii is, and it really is up to the board manufacturers now.Reply -
XyzyxRd The condition of the contact point for the GPU is completely unacceptable on a $500 plus card. Under normal handling this sort of damage should never occur. I've run both AMD and Nvidia cards and this sort of disclosure will make me think twice before seriously considering an AMD card for future builds.Reply -
rwinches Ok but how did the board perform with the new paste and not in quiet mode?Reply
Because even if it offended your sensitive ears would it have an effect on reaching the 94C limit?
