Samsung 840 EVO mSATA Review: 120, 250, 500, And 1000 GB, Tested
Once upon a time, adopting mSATA-based storage meant compromising capacity and performance. With its 840 EVO, Samsung gives you access to as much as 1000 GB at incredibly fast speeds. The company even manages attractive pricing to keep mSATA competitive.
Results: 4 KB Random Performance
We turn to Iometer as our synthetic metric of choice for testing 4 KB random performance. Technically, "random" translates to a consecutive access that occurs more than one sector away. On a mechanical hard disk, this can lead to significant latencies that hammer performance. Spinning media simply handles sequential accesses much better than random ones, since the heads don't have to be physically repositioned. With SSDs, the random/sequential access distinction is much less relevant. Data are put wherever the controller wants it, so the idea that the operating system sees one piece of information next to another is mostly just an illusion.
4 KB Random Reads
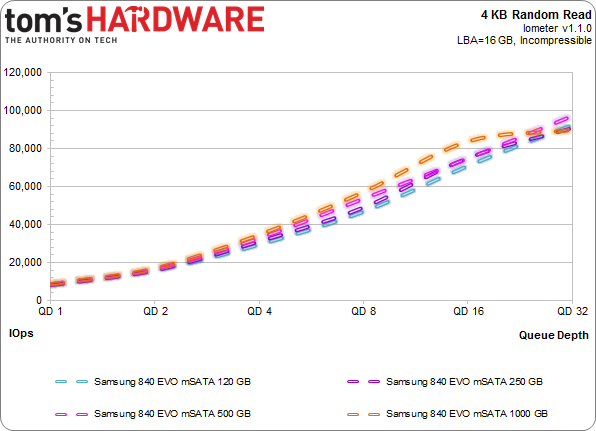
Testing the performance of SSDs often emphasizes 4 KB random reads, and for good reason. Most system accesses are both small and random. Moreover, read performance is arguably more important than writes when you're talking about typical client workloads.
The four 840 EVOs return similar small random read performance figures across our range of outstanding comments. Again, it's worth mentioning that this discipline typically isn't dependent on die configuration. As with the sequential read numbers on the previous page, random reads prove similar. Truth be told, there are a few companies inwardly jealous of the read speed Samsung's able to achieve with TLC NAND.
4 KB Random Writes
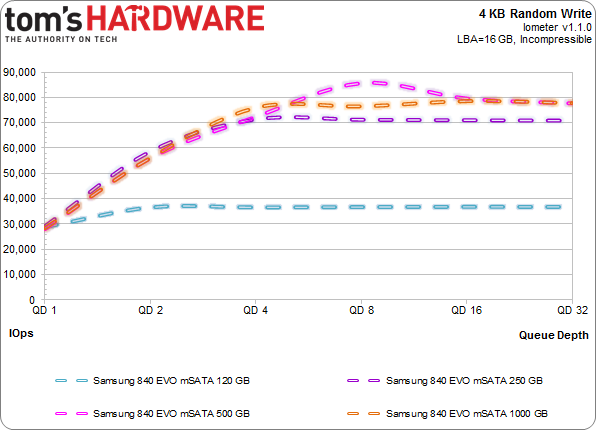
Random write performance is also important. Early SSDs didn't do well in this discipline, seizing up even in light workloads. Newer SSDs wield more than 100x the performance of drives from 2007, though we also recognize that there's a point of diminishing returns in desktop environments.
Nutty, right? There are a couple variables at work that result in this disorderly chart. First, Turbo Write comes back into play, increasing performance, but messing with our Iometer-generated numbers. Since methodology only makes sense when it's consistent, going out of our way to change the benchmark to illustrate higher or lower performance wouldn't make sense.
Get Tom's Hardware's best news and in-depth reviews, straight to your inbox.
The 120 GB model's Turbo Write cache always gets filled first, since it's only effectively 3 GB in size. If the cache can't flush to the drive faster than the data coming in, performance drops back to unaccelerated levels. Meanwhile, the 1000 GB model sets aside 36 GB, which turns into 12 GB of emulated SLC flash. Naturally, it benefits from caching quite a bit longer.
In any case, this is a big jump over the original 840. In real life, bursty random writes will almost entirely hit the cache in desktop workloads. SanDisk, Samsung, and Toshiba are on the right track with this stuff; approaching 90,000 4 KB write IOPS with triple-level cell NAND is a good indicator of that.
Random Performance Over Time
My saturation test consists of writing to each drive for a specific duration with a defined workload. Technically, it's an enterprise-class benchmark, where the entire LBA space of the SSD is utilized by a random write at high queue depths.
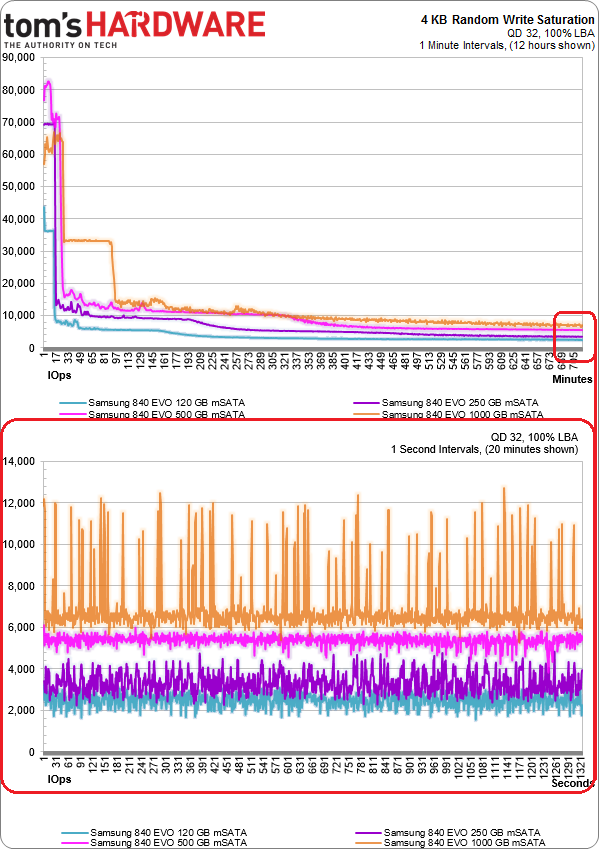
Here's 12 hours of a 4 KB write with 32 outstanding commands. First, we secure erase each drive. Then we apply the 4 KB write load, showing the average IOPS for each minute (except for the last 20 minutes, where we zoom in and show you one-second average increments).
After the first drive fill, performance drops off fast, since the SSD no longer has free blocks to write to. Instead, they have to be erased prior to subsequent writes. The 840 EVOs are interesting in that performance plummets early on, well before any of them are filled up. In this case, the first peaks are a result of Turbo Write's awesome potential. But those numbers only last as long as there is room in the cache. As soon as that gets exceeded, throughput drops to the second level, reflecting Samsung's TLC flash. Then, once the entire drive is full, the SSD shifts into steady state.
Yes, the drive probably is trying to flush data to the non-emulated space as it fills. But things happen quickly when performance is so high. Just look at the 120 GB model's trace, which averages 33,500 during the first 17 minutes of testing. The first minute is much higher than subsequent readings because, at 33,500 IOPS (130 MB/s), it only takes 23 seconds to fill the 3 GB cache. Performance is averaged over that minute, and as a result, that first minute looks a lot faster.
This stuff is fascinating, if you're into it like I am.
Here's a break-down of the maximum observed 4 KB sequential read and write performance with Iometer. The order the drives appear in our chart is determined by maximum combined read and write performance.
The 500 GB 840 EVO takes third place when we look at maximum 4 KB read and write performance (attributable to Turbo Write's effect on write performance, no doubt). There's a lot of variance when it comes to measuring the technology's impact though, so just imagine the three largest 840 EVOs closer together. They're more similar than this chart suggests.
Current page: Results: 4 KB Random Performance
Prev Page Results: 128 KB Sequential Performance Next Page Results: Tom's Hardware Storage Bench-
blackmagnum Maybe it's time to upgrade the HD of an old working notebook to SSD! But will a Core2Duo processor bottleneck a SSD?Reply -
jrharbort @blackmagnum: You don't have to worry about your processor being a bottleneck, but rather, your system's SATA interface. It is highly doubtful that your Core 2-based notebook (much like my own) has an m-sata slot, and the 2.5" bay for a HDD would have a SATAII port, not SATAIII. So the overall max read/write rates would be cut in half. But to answer your question in another way, tom's posted an article almost a year ago on the subject of upgrading older systems with an SSD: http://www.tomshardware.com/reviews/ssd-upgrade-sata-3gbps,3469.htmlReply -
spookyman @blackmagnum: You be glad to upgrade your hard drive to a SSD drive. Did it for my goddaughter's after she had a hard drive crash and it runs a lot faster then before.Reply -
JohnnyLucky Interesting article. It coincides with the current shift from desktop pc's to mobile pc's.Reply -
pyro226 "The latest version offers RAPID support to non-EVO drives like the 840 Pro."Got my hopes up there. The standard 840 series SSDs are NOT supported. The article didn't explicitly state they were, but what other drives (aside from the 840 Pro and EVO) have Rapid support? Perhaps "The latest version offers RAPID support to both EVO and 840 Pro SSDs." would be more accurate.Reply -
LordConrad "This company has a track record of disrupting the markets it enters; now that it's focusing attention on smaller form factors with enthusiast-class hardware, it's only a matter of time before we start seeing M.2-based offerings as well."This is mainstream hardware, I don't know any enthusiats who will settle for drives with TLC NAND.Reply -
lowguppy It is nice to see these finally available. I've been watching the Crucial m500 mSATA drive for a while, and the 480gb version frequently falls under $300 on NewEgg, which is competitive with 2.5" SSDs.Reply -
RedJaron Reply
"Enthusiast" to me doesn't automatically mean getting the fastest, biggest, bestest, craziest parts regardless of price. It also means people who put a lot more thought into their systems and thoroughly weigh all their options. MLC, TLC, or not, the fact remains that the EVO is a fast, reliable drive for a good price.12750948 said:This is mainstream hardware, I don't know any enthusiats who will settle for drives with TLC NAND.
Your argument sounds similar to, "I don't know any enthusiasts who will settle for LGA 1150 instead of LGA 2011," or "I don't know any enthusiasts that would settle for a non-K CPU."


