Why you can trust Tom's Hardware
Comparison Products
We threw Samsung's 8TB 870 QVO into the ring with the smaller 1TB 870 QVO and 860 EVO, along with a few of the largest competing SSDs we have on hand. We included Seagate's FireCuda 120, IronWolf 110, and WD's Red SA500 at 4TB capacities. At 1TB, we also included WD's Blue 3D, Crucial's MX500, and SK hynix's Gold S31. For some perspective, we added Sabrent's Rocket Q at 8TB to represent the high-capacity NVMe competition.
Game Scene Loading - Final Fantasy XIV
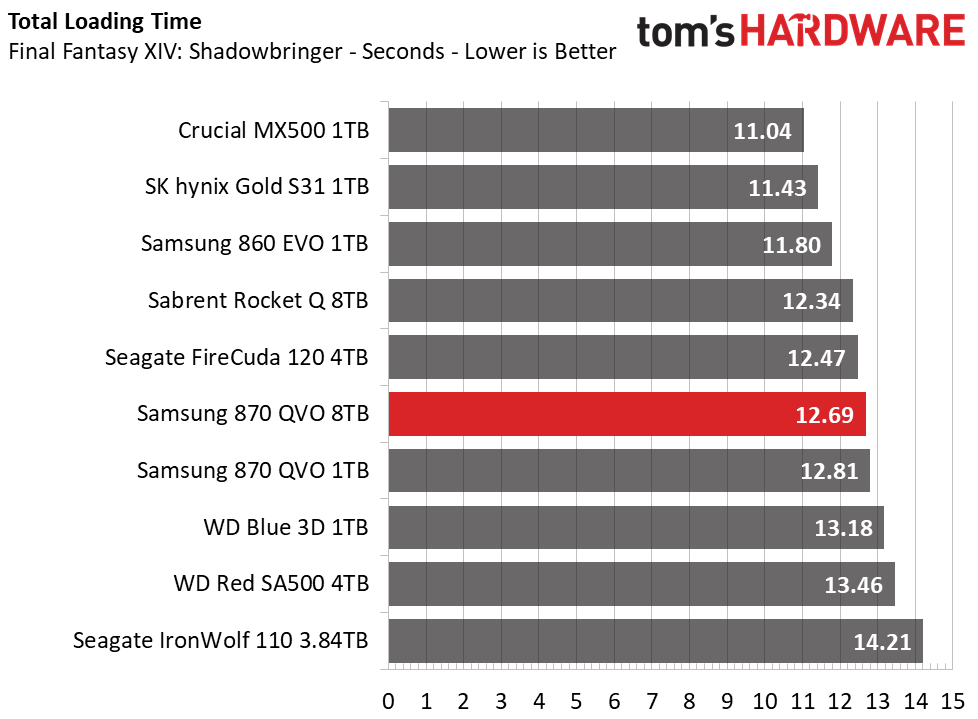
Final Fantasy XIV Stormbringer is a free real-world game benchmark that easily and accurately compares game load times without the inaccuracy of using a stopwatch.
There isn’t much of a difference in the game scene load times from some of the fastest to slowest SATA SSDs - their performance varies by only 2-3 seconds after loading up multiple levels. Samsung’s 8TB 870 QVO scored an average score of 12.69 seconds, outperforming the 1TB model, and just trailing Sabrent’s 8TB PCIe 3.0 x4 NVMe Rocket Q by a third of a second.
Transfer Rates – DiskBench
We use the DiskBench storage benchmarking tool to test file transfer performance with our own custom blocks of data. Our 50GB data set includes 31,227 files of various types, like pictures, PDFs, and videos. Our 100GB includes 22,579 files with 50GB of them being large movies. We copy the data sets to new folders and then follow-up with a reading test of a newly written 6.5GB zip file and 15GB movie file.
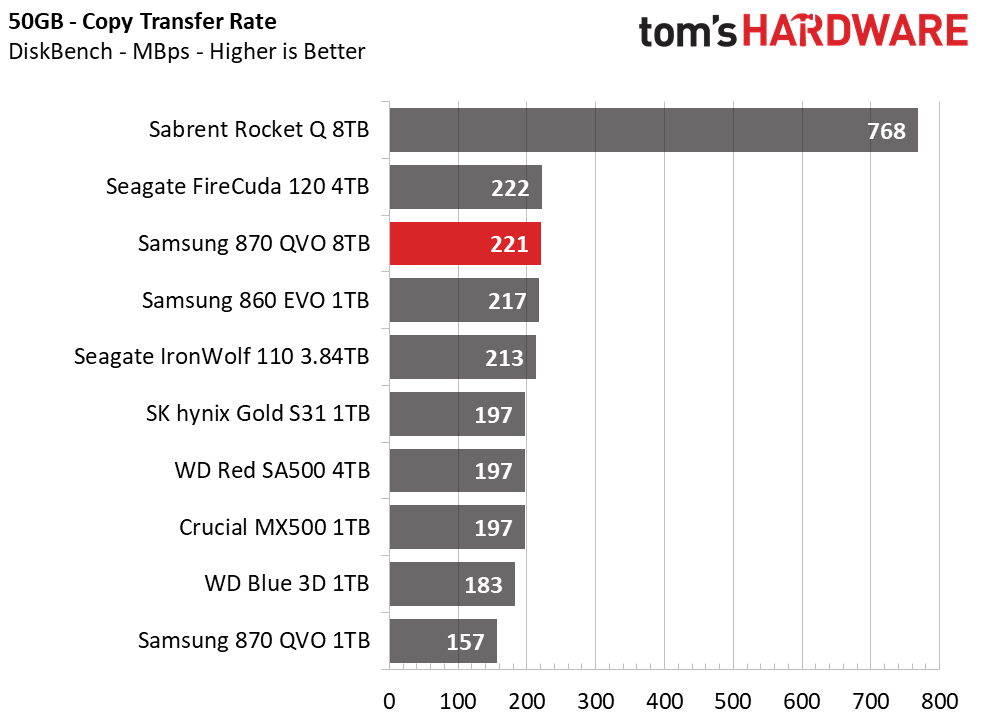
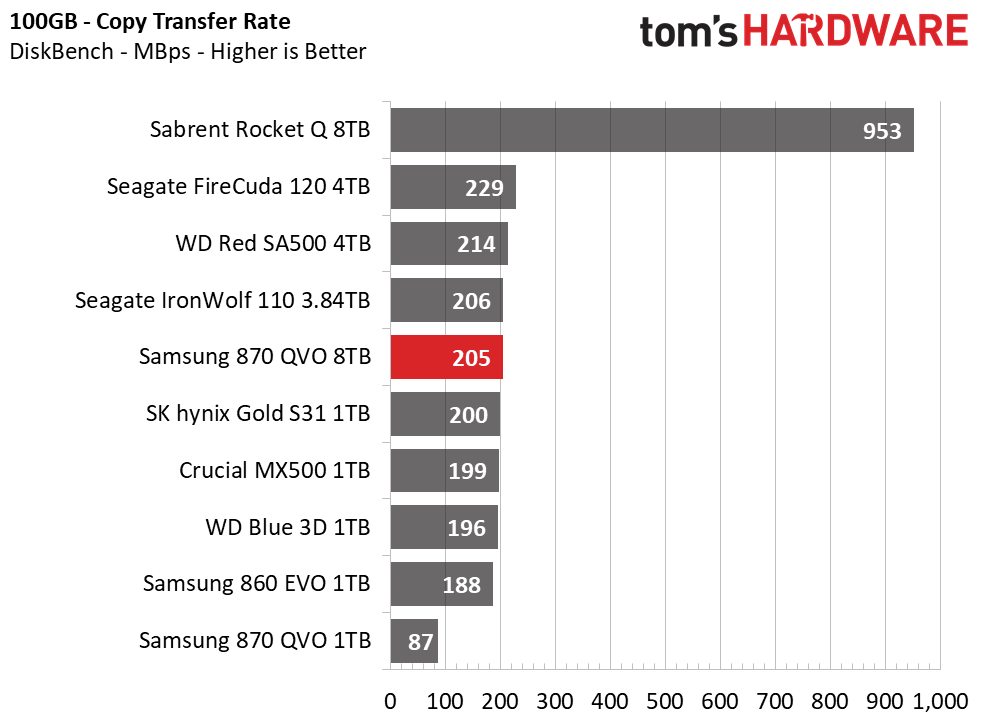
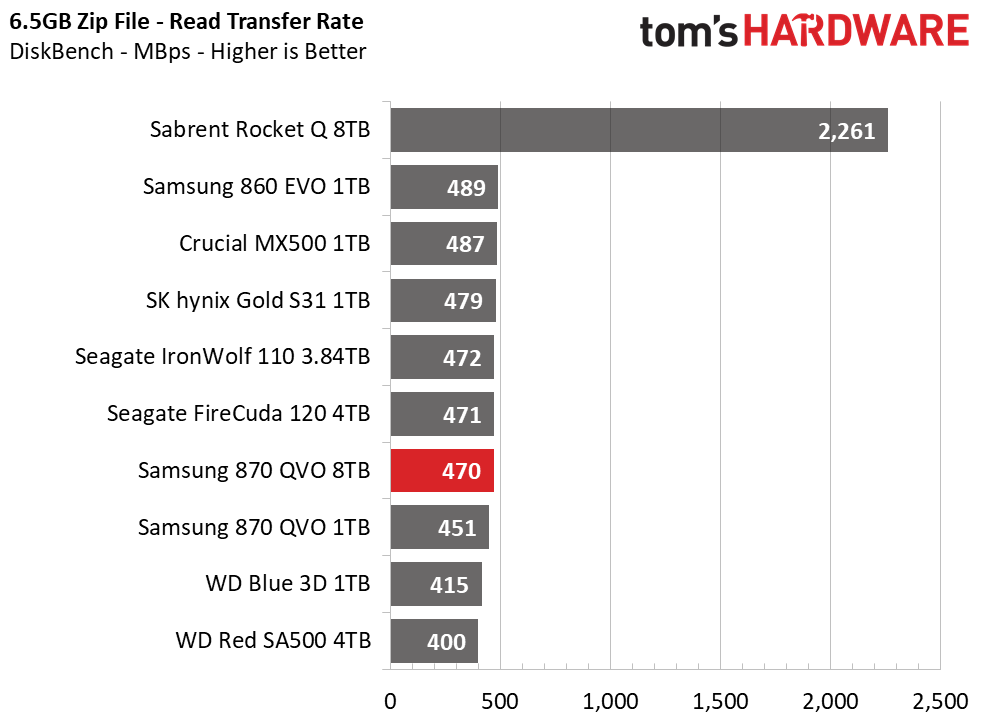
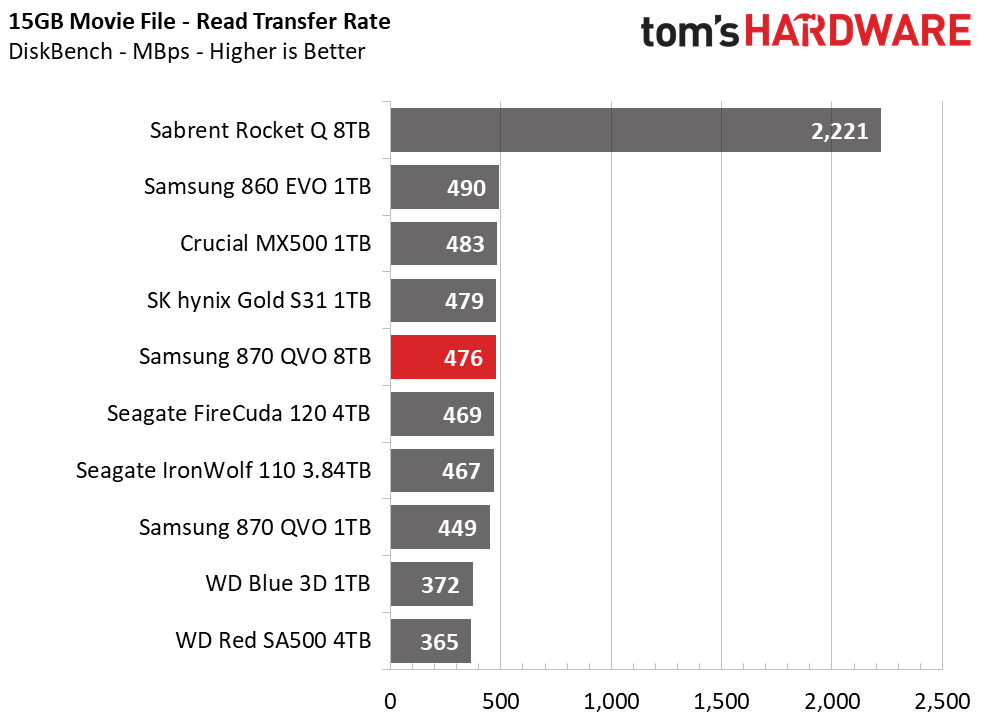
Samsung's 8TB 870 QVO can't touch the Sabrent Rocket Q's performance, but due to a larger TurboWrite SLC cache than the 1TB QVO, Samsung's 8TB 870 QVO attains very respectable large-file copy results. The additional NAND dies on the 8TB model also enables more parallelism for faster reading of large files. The fact that the QLC is slower to respond than TLC flash is still apparent, though, as the 860 EVO takes the lead when reading back the large zip and movie files.
Trace Testing – PCMark 10 Storage Tests
PCMark 10 is a trace-based benchmark that uses a wide-ranging set of real-world traces from popular applications and common tasks to measure the performance of storage devices. The quick benchmark is more relatable to those who use their PCs for leisure or basic office work, while the full benchmark relates more to power users.
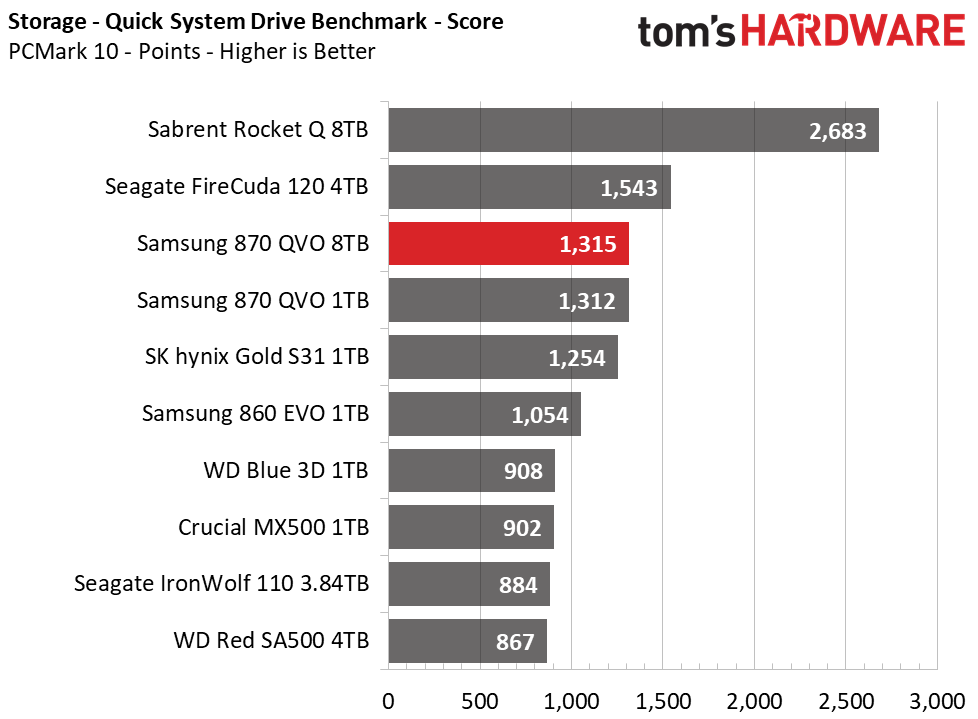
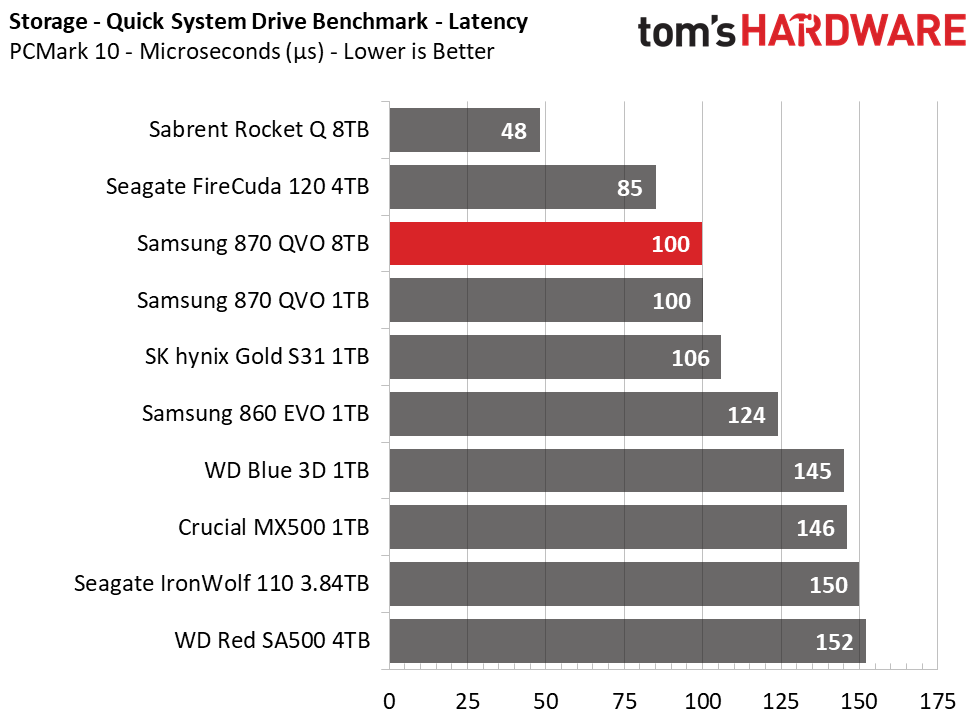
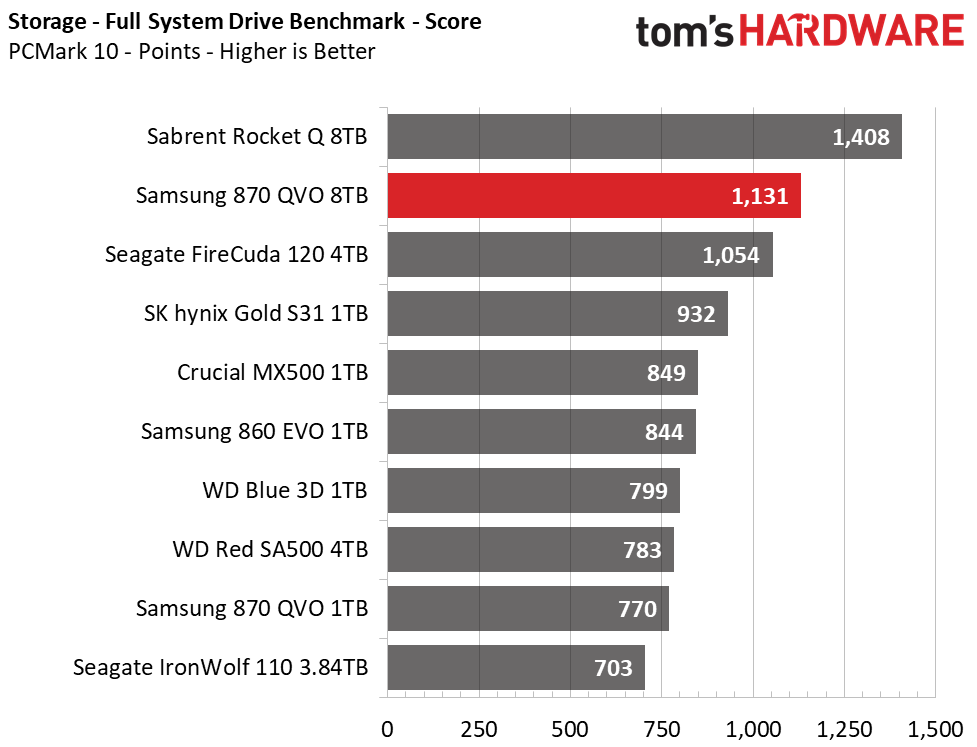
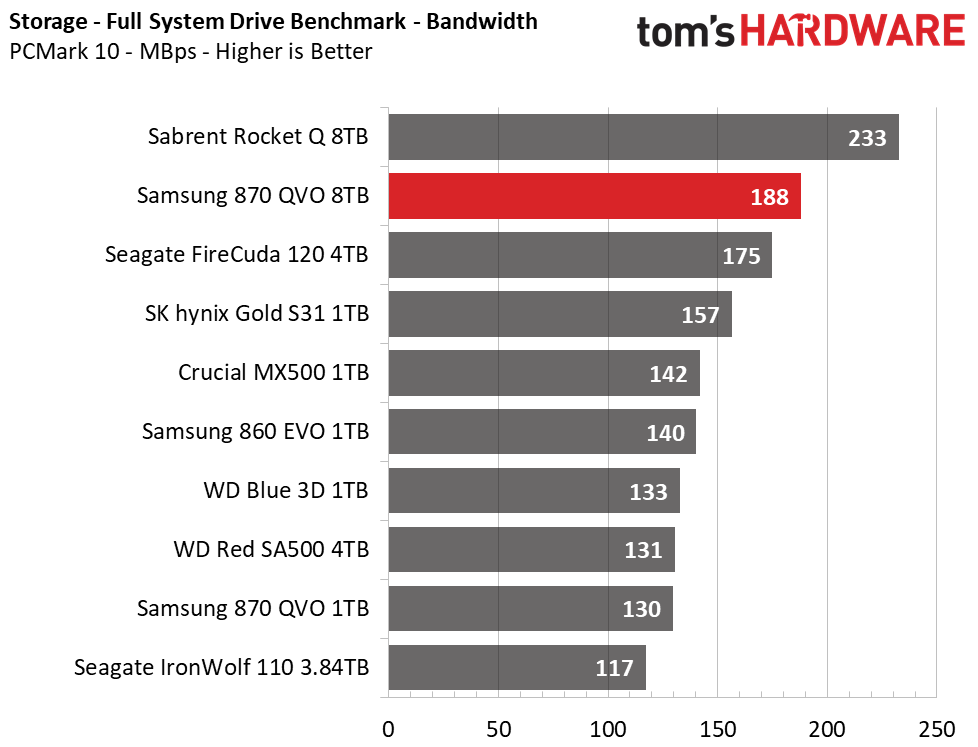
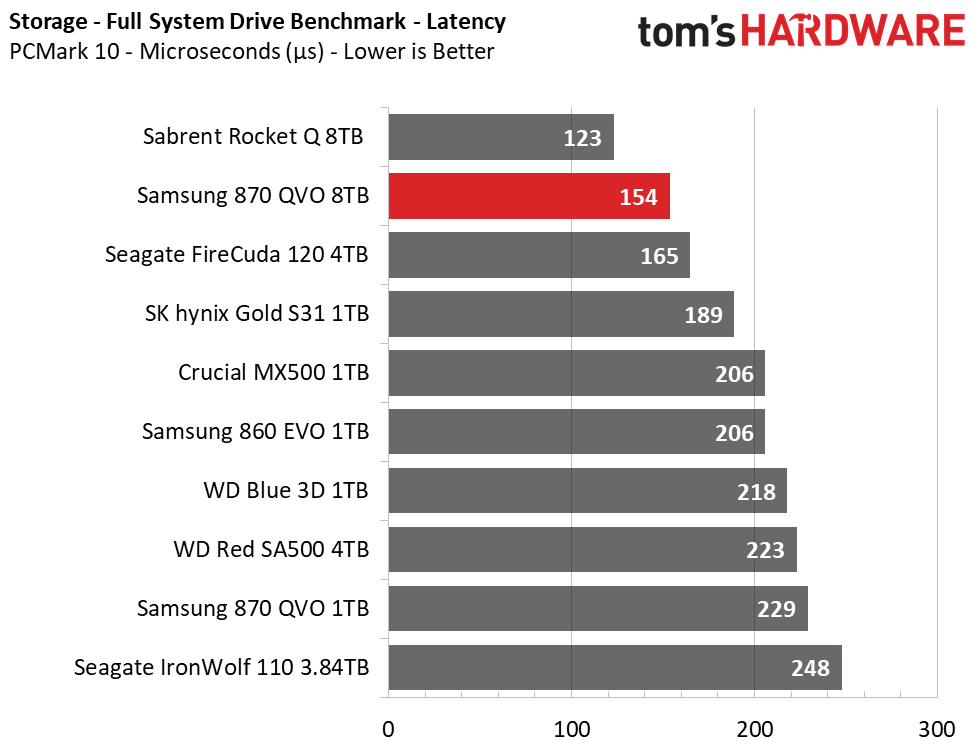
Samsung’s 870 QVO scores top marks under both PCMark 10’s Quick and Full System Drive Benchmarks, trumping even the 860 EVO by a fair bit. Seagate’s FireCuda 120 gives it a tough run in the lighter Quick test, responding 15 microseconds faster (on average).
Get Tom's Hardware's best news and in-depth reviews, straight to your inbox.
Trace Testing – SPECworkstation 3
Like PCMark 10, SPECworkstation 3 is a trace-based benchmark, but it is designed to push the system harder by measuring workstation performance in professional applications.
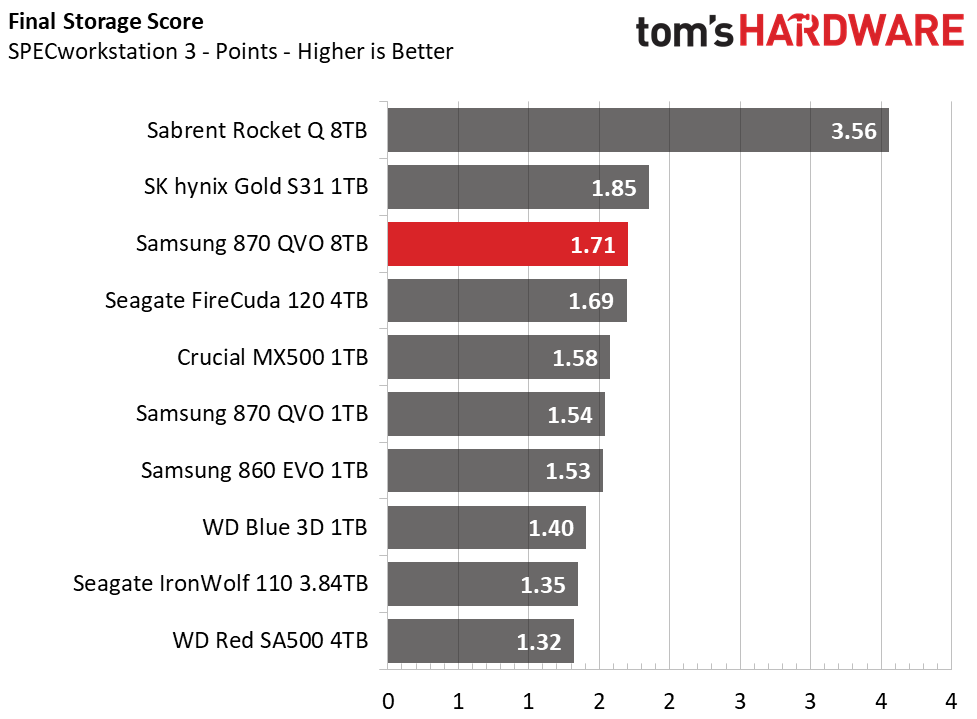
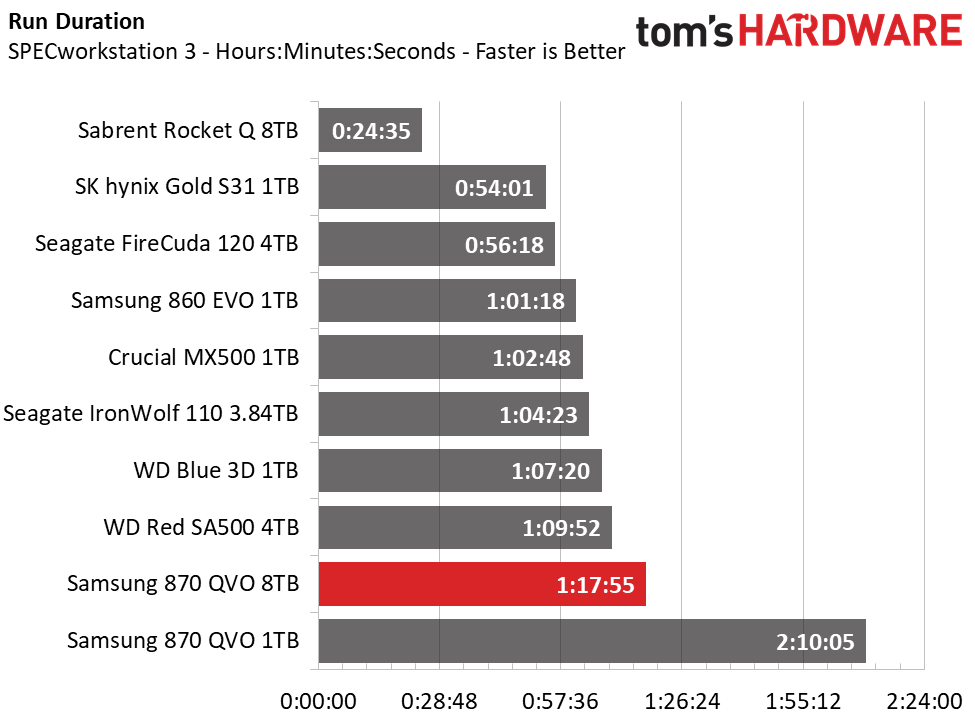
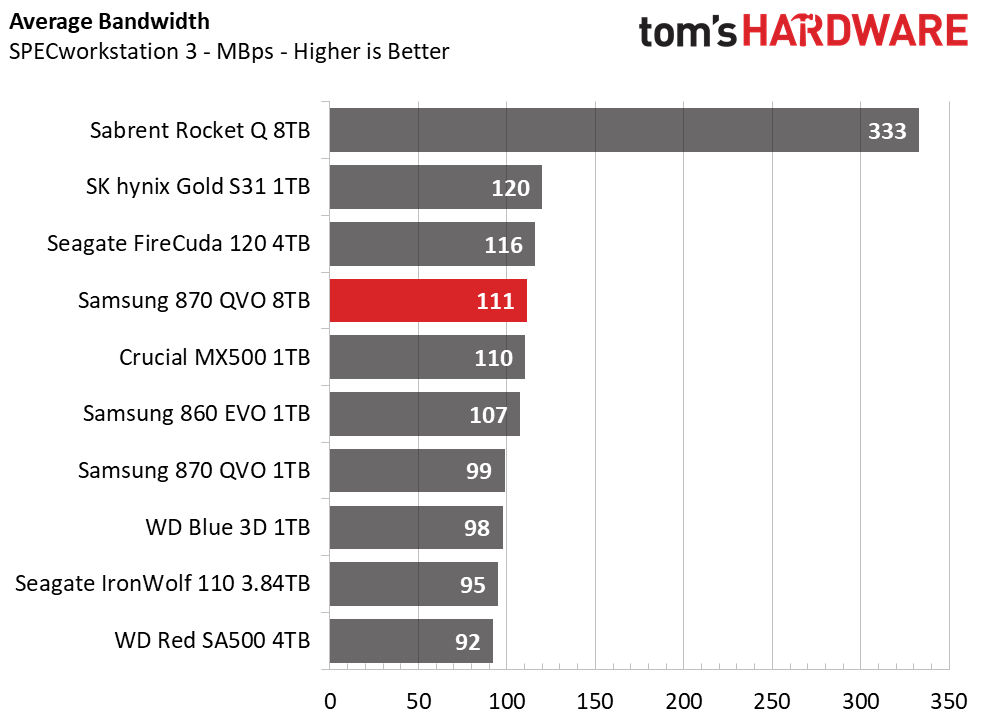
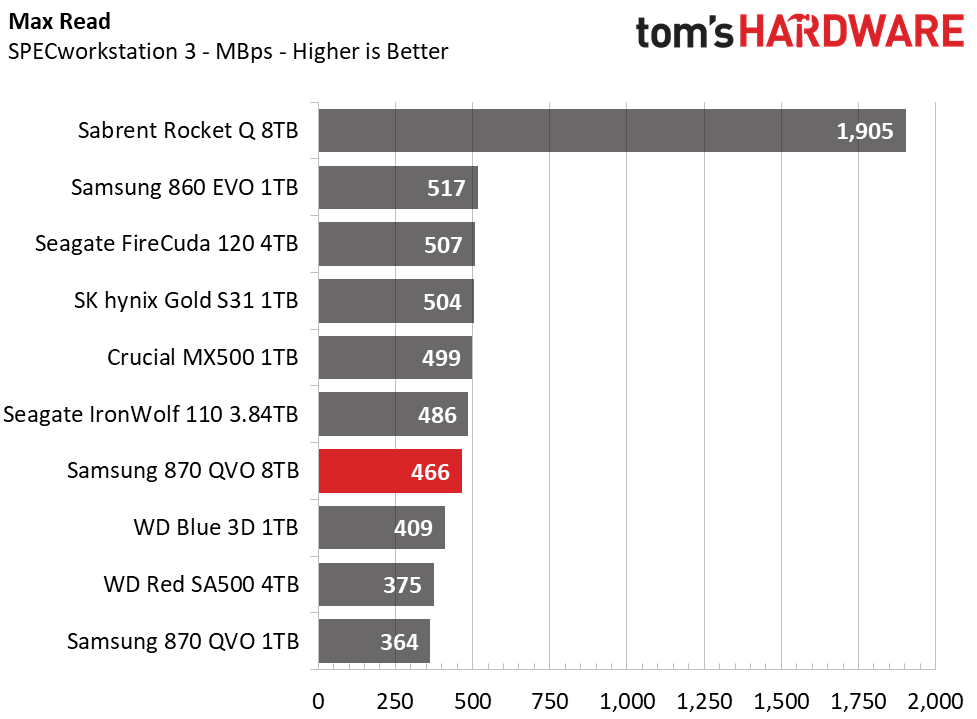
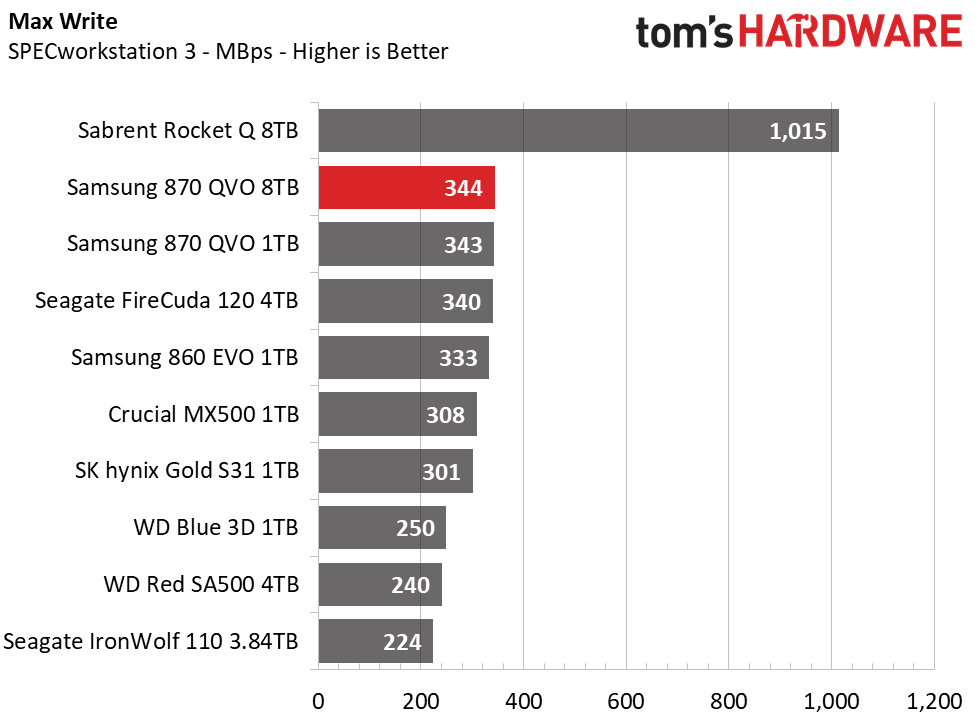
With 8TB of free space and a larger SLC write cache, the 8TB QVO performs the SPECworkstation 3 traces much faster than the 1TB model. The 8TB model ranks in third place, but still lags the TLC competition in the completion time metric due to the QLC flash and the device not recovering fast enough when we’ve hammered beyond the TurboWrite cache’s limits.
Synthetic Testing - ATTO / iometer
iometer is an advanced and highly configurable storage benchmarking tool, while ATTO is a simple and free application that SSD makers commonly use to assign sequential performance specifications to their products. Both of these tools give us insight into how the device handles different file sizes.
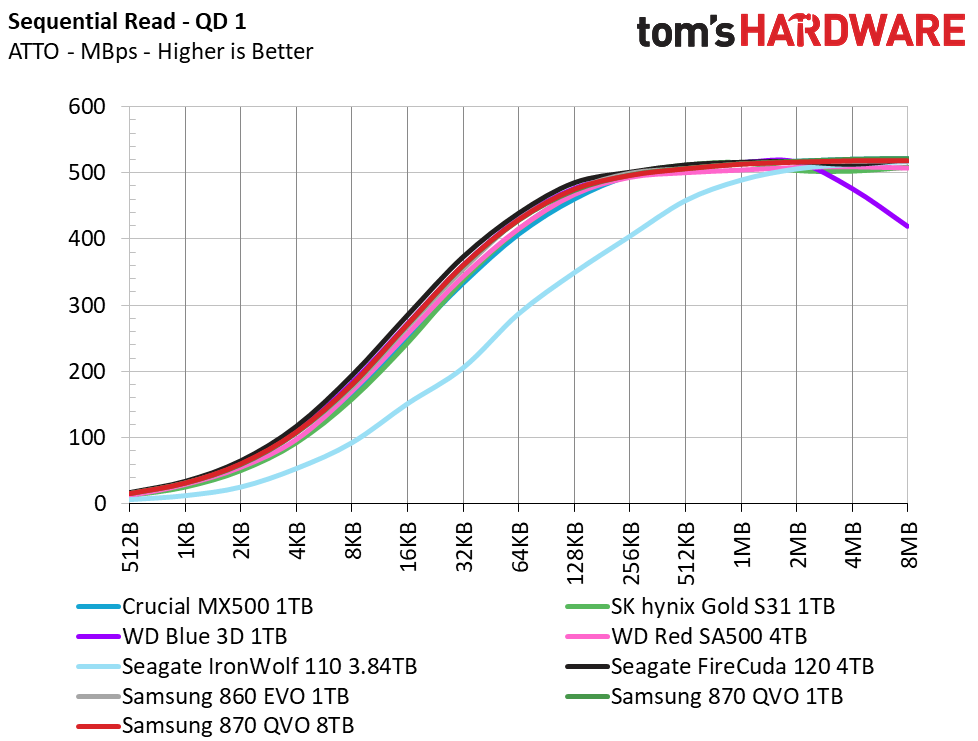
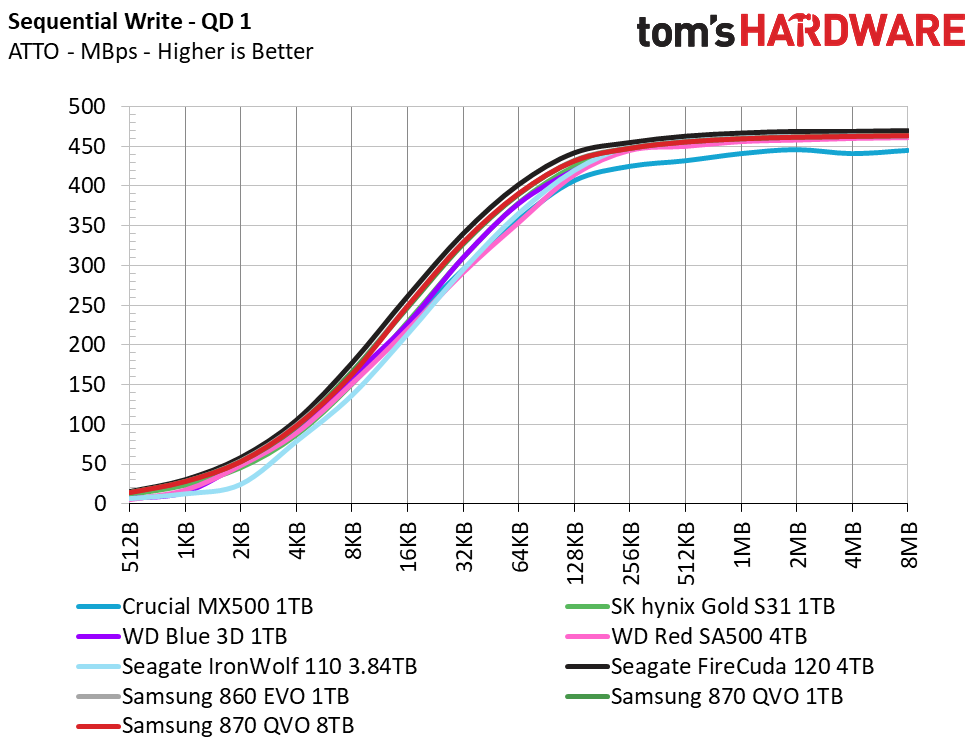
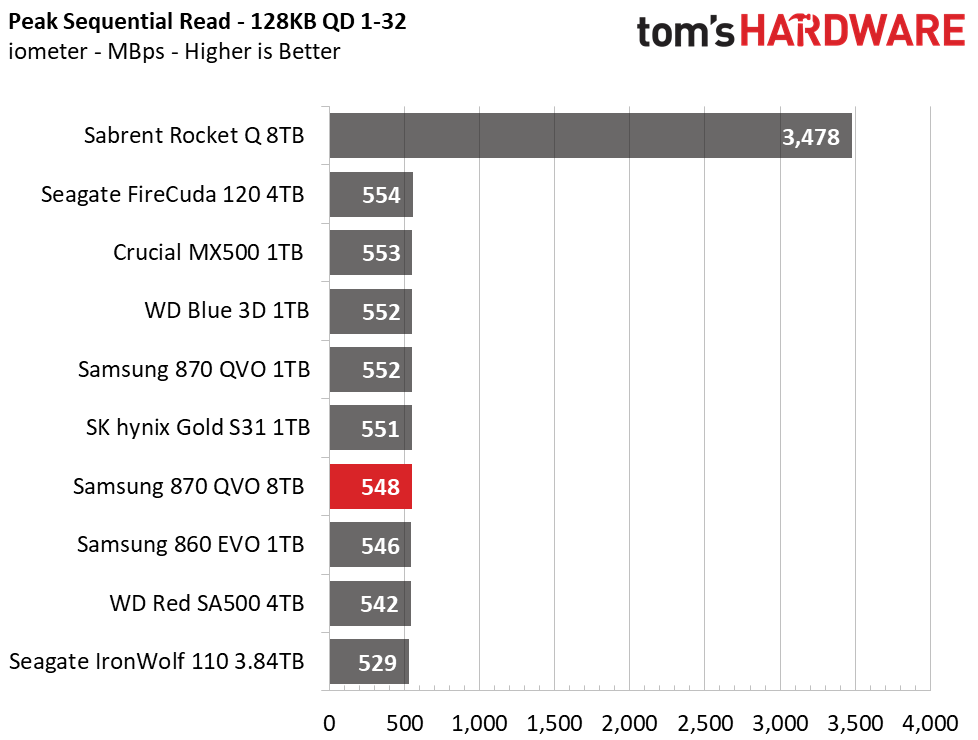
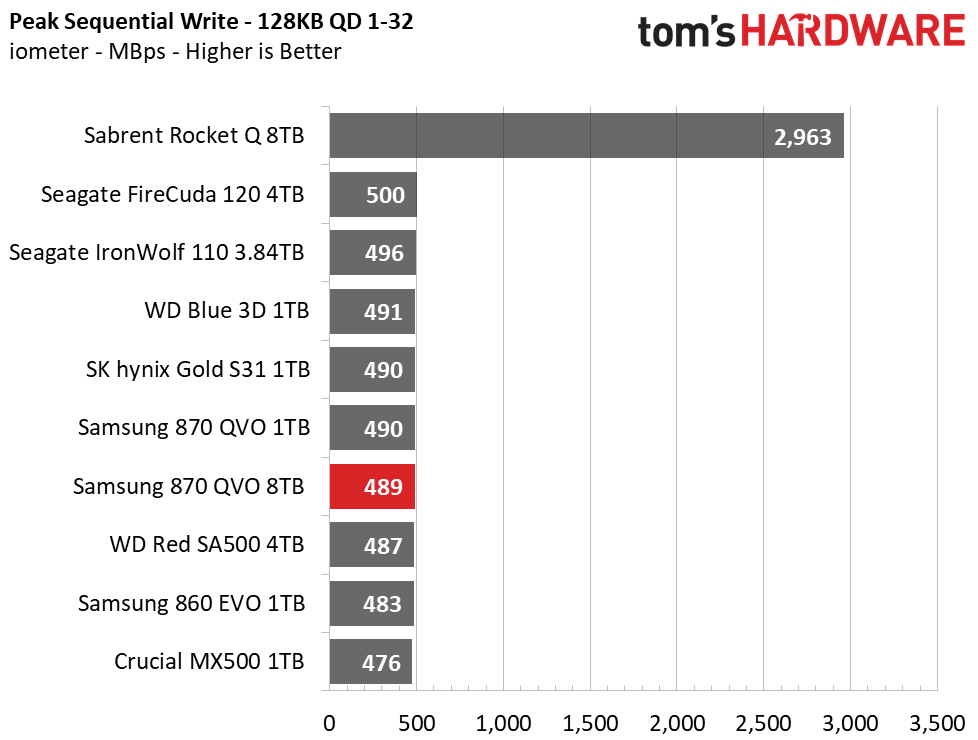
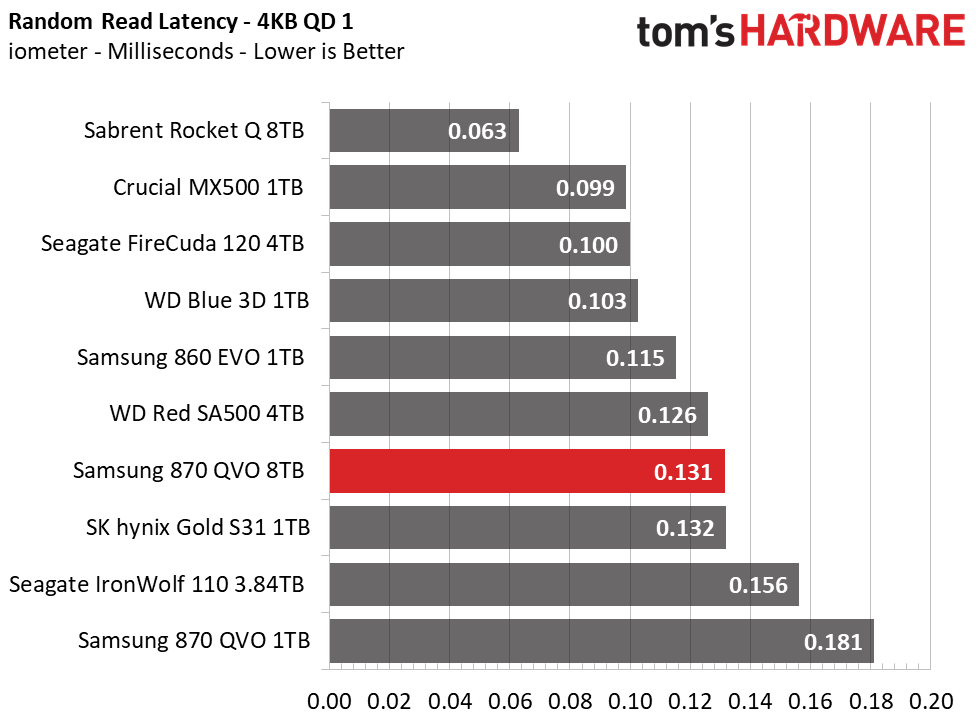
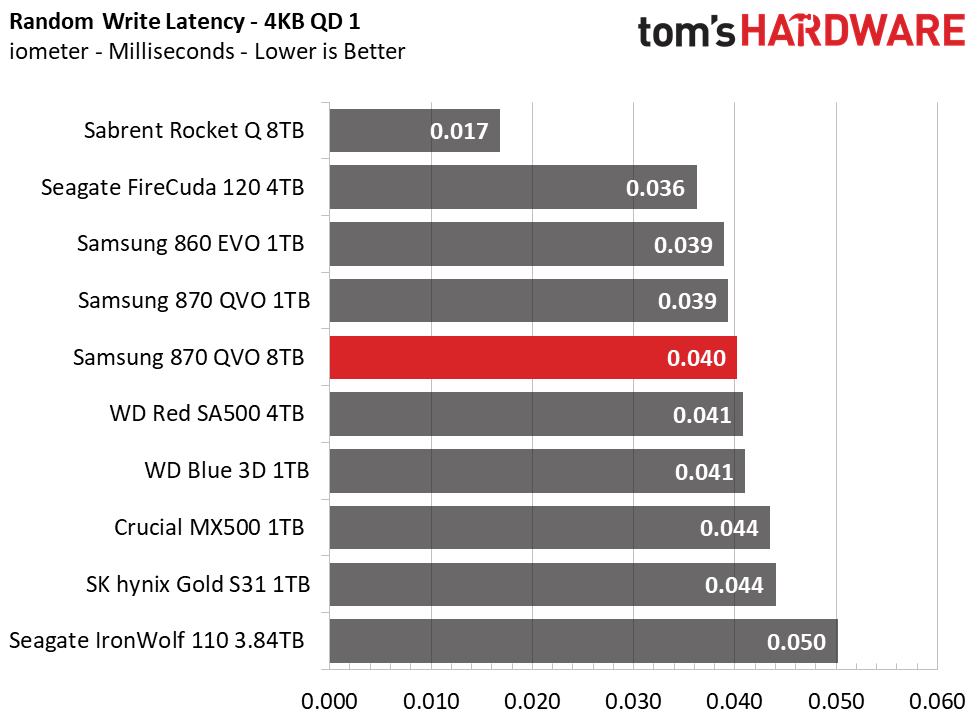
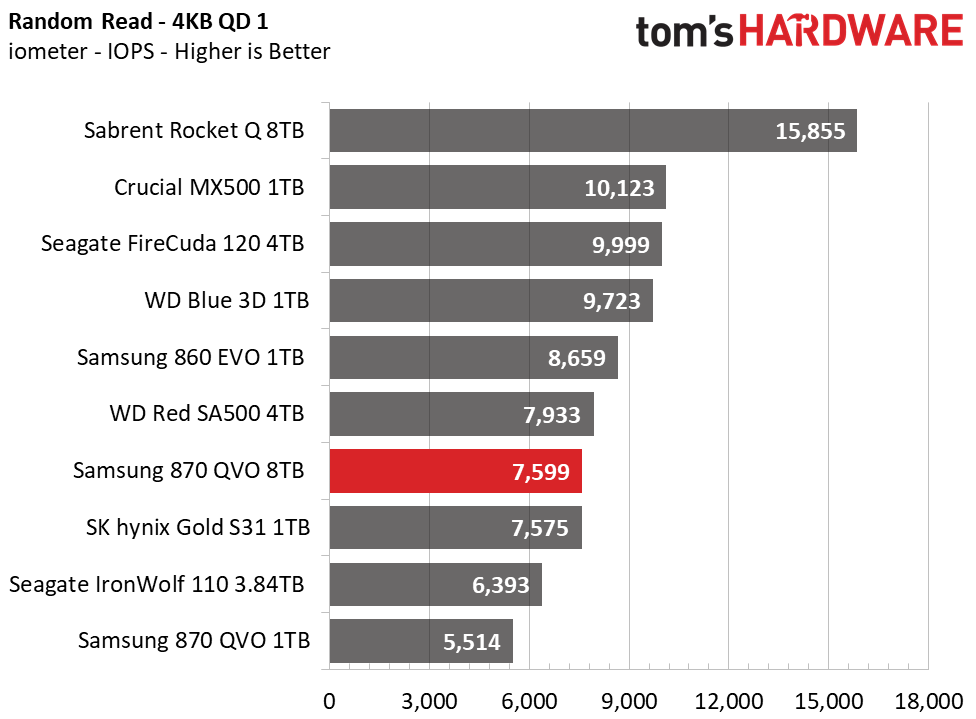
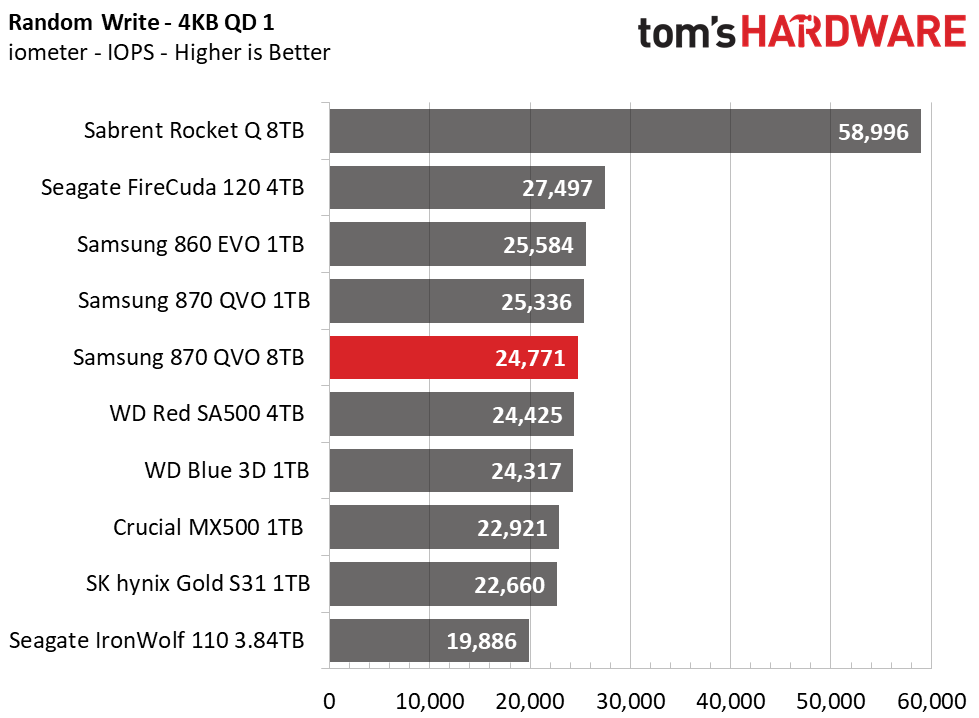
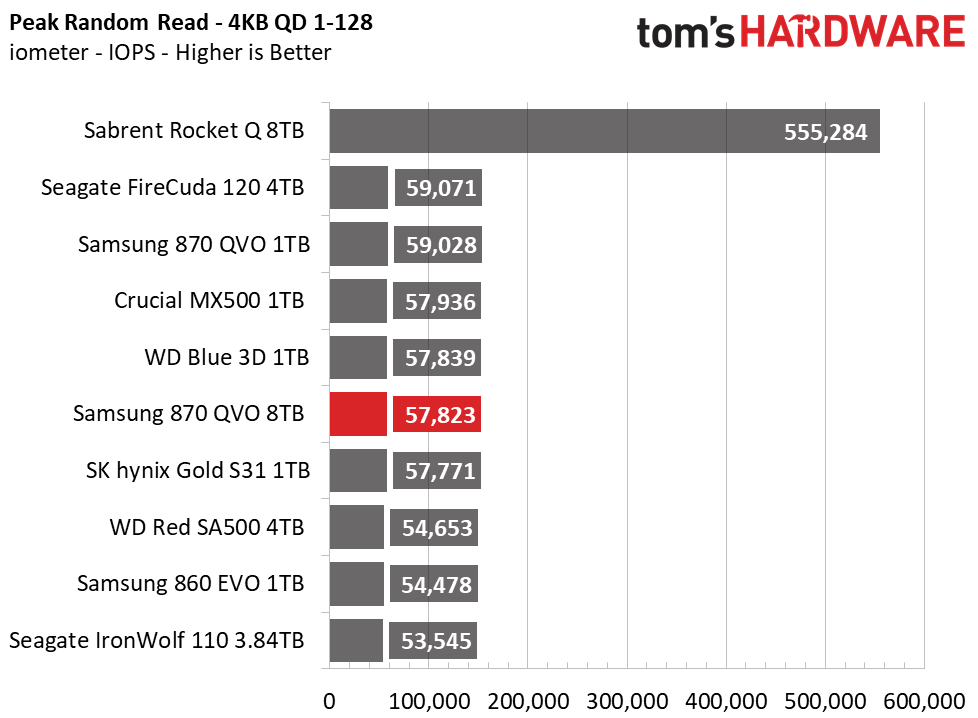
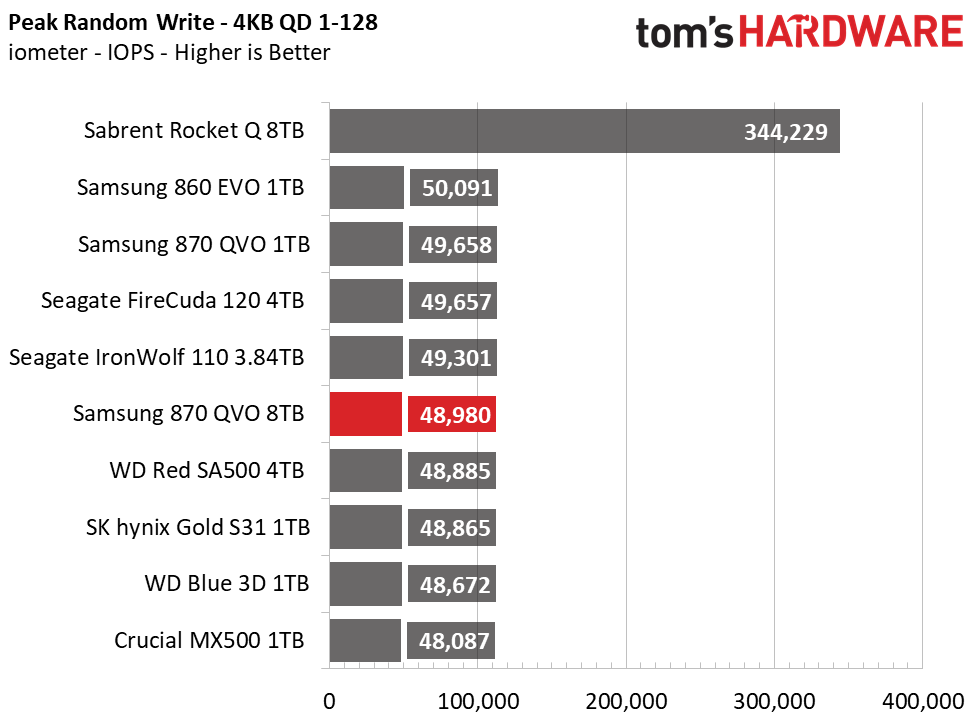
We tested Samsung’s 8TB 870 QVO at a QD (queue depth) of 1, representing most day to day file access at various block sizes. With reads and writes hitting roughly 520/464 read/write MBps at QD1, overall results show the drive is quite similar to most other drives. Increasing to QD2 increases performance to 548/489 MBps. It’s not the fastest, but the 8TB QVO is fairly quick to respond to small-block random requests, too.
Sustained Write Performance and Cache Recovery
Official write specifications are only part of the performance picture. Most SSDs implement a write cache, which is a fast area of (usually) pseudo-SLC programmed flash that absorbs incoming data. Sustained write speeds can suffer tremendously once the workload spills outside of the cache and into the "native" TLC or QLC flash. We use iometer to hammer the SSD with sequential writes for 15 minutes to measure both the size of the write cache and performance after the cache is saturated. We also monitor cache recovery via multiple idle rounds.
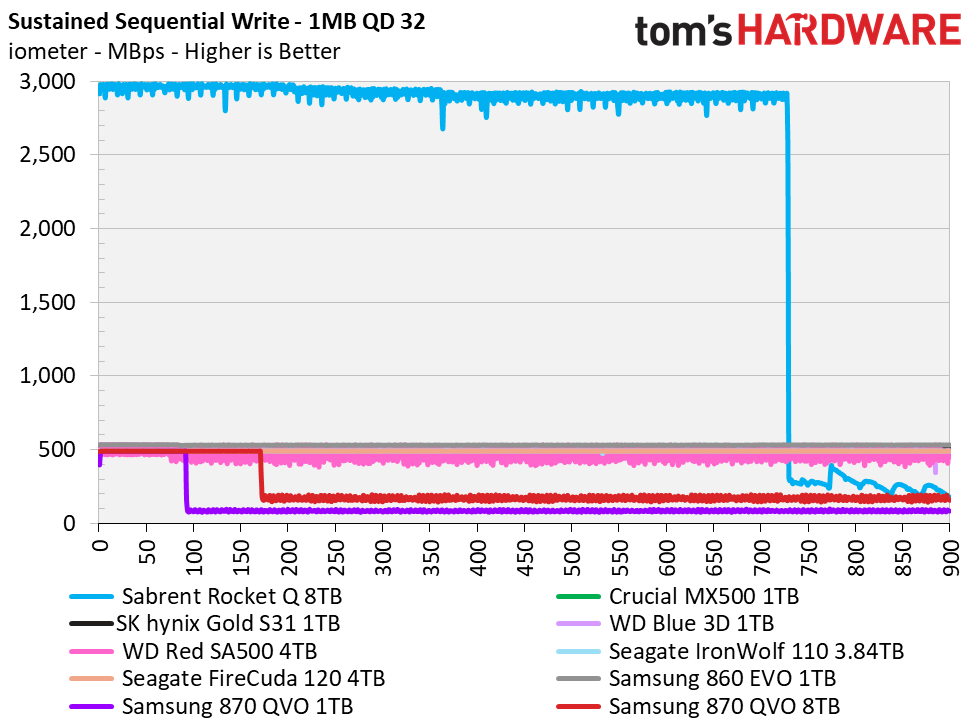
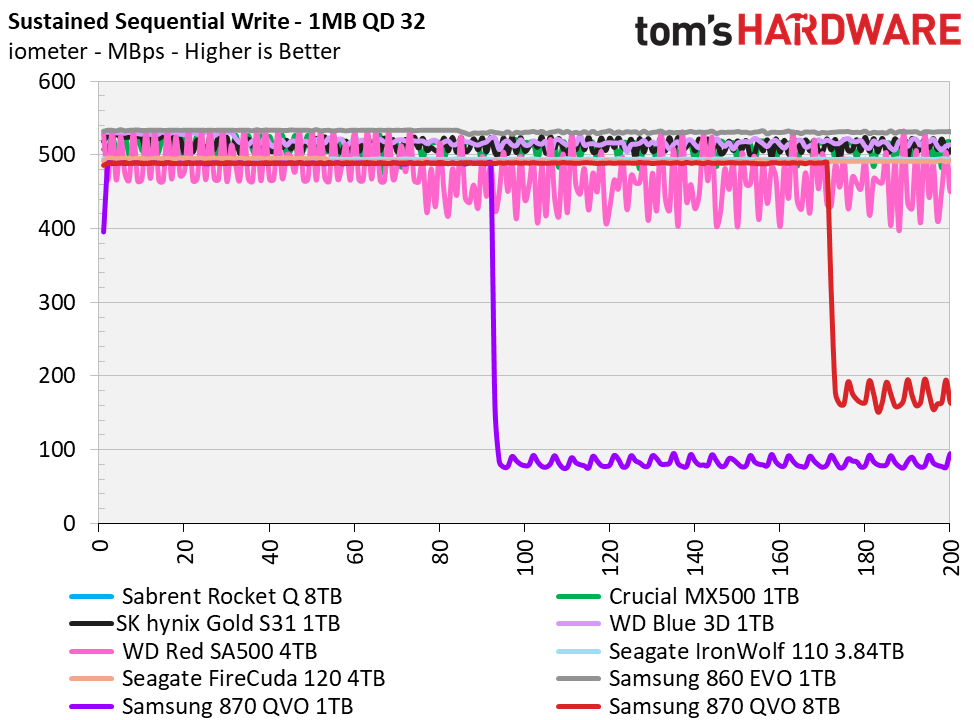
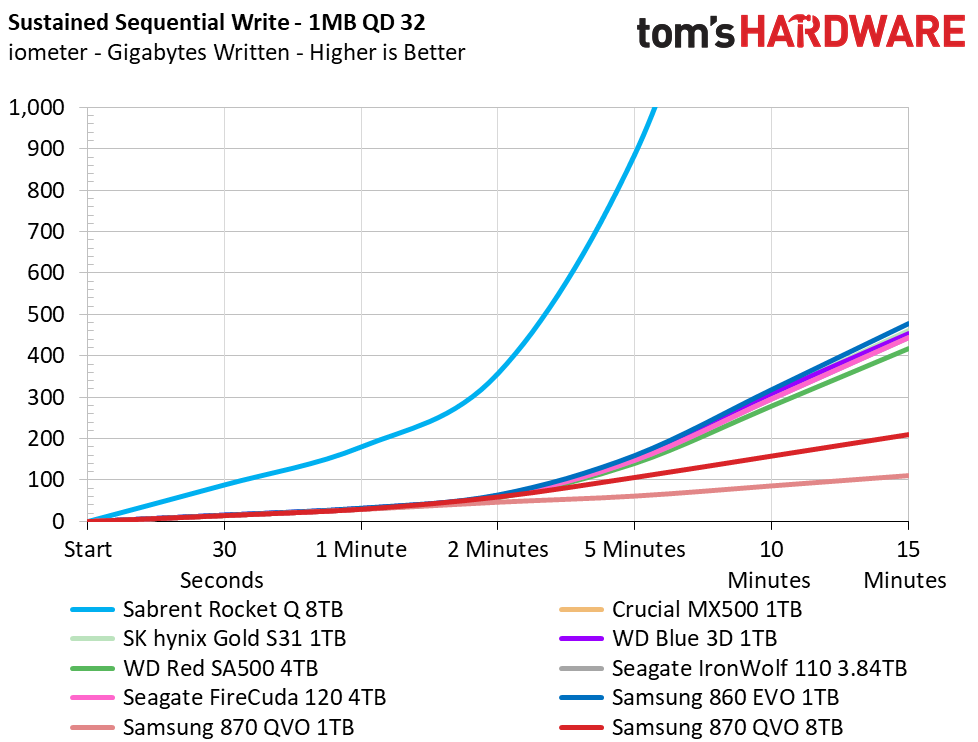
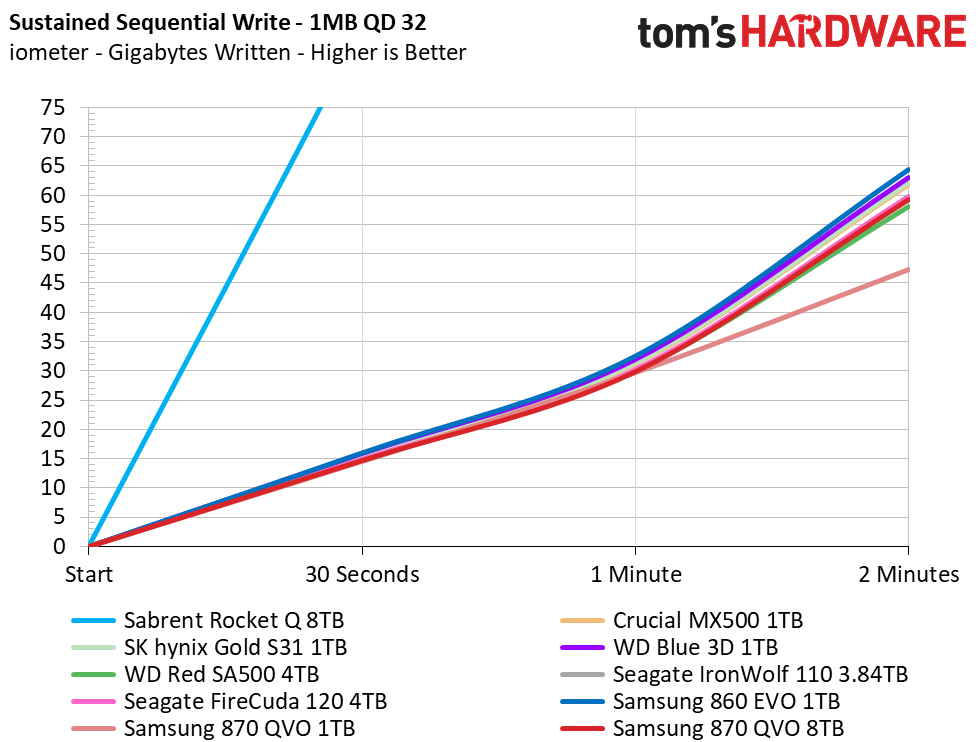
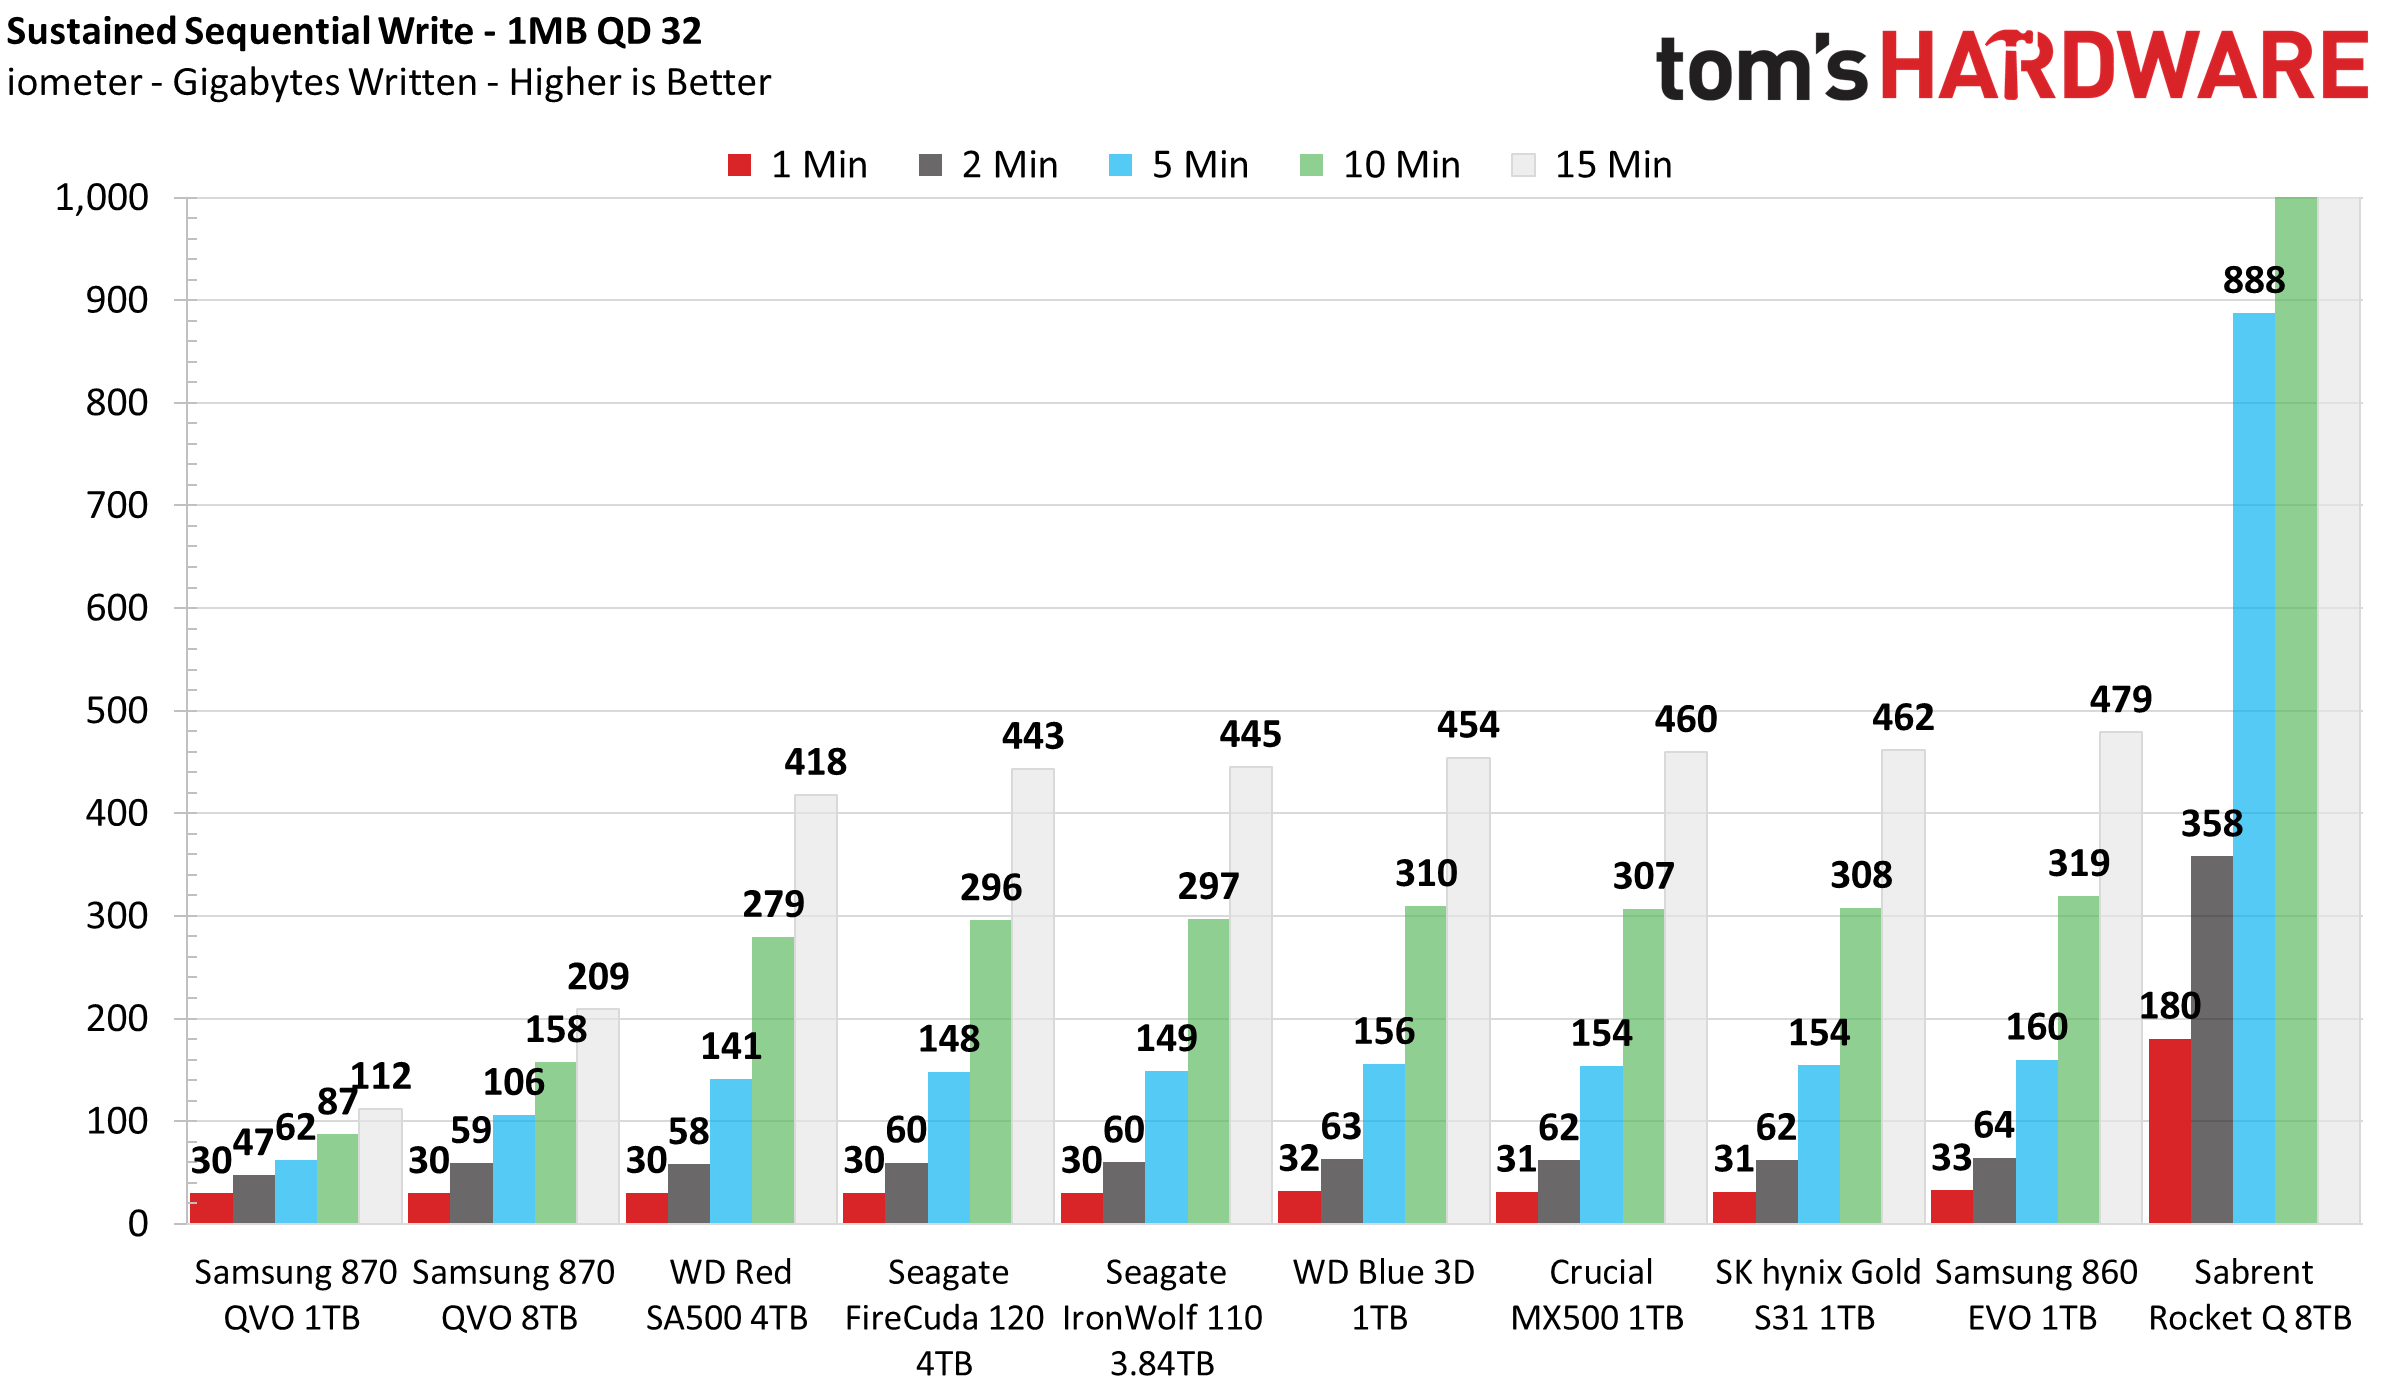
Samsung’s 870 QVO writes at a rate of 490 MBps for 84GB, neck in neck with the competition until the before degrading to slower folding speeds. That 84GB of cache capacity actually slightly exceeds Samsung’s specs. After the TurboWrite exhausts, the SSD’s after-cache write performance degrades to an average of 172 MBps.
As we noticed with the 1TB model, the 8TB model’s cache recovery mechanisms work similarly. After letting the drive rest at idle for 30 seconds, the 870 QVO gains back 6GB of its cache. It recovers fully with 5 minutes of idle time.
Power Consumption and Temperature
We use the Quarch HD Programmable Power Module to gain a deeper understanding of power characteristics. Idle power consumption is an important aspect to consider, especially if you're looking for a laptop upgrade. Some SSDs can consume watts of power at idle while better-suited ones sip just milliwatts. Average workload power consumption and max consumption are two other aspects of power consumption, but performance-per-watt is more important. A drive might consume more power during any given workload, but accomplishing a task faster allows the drive to drop into an idle state faster, which ultimately saves power.
We also monitor the temperature of the drive via the S.M.A.R.T. data and an IR thermometer to see when (or if) thermal throttling kicks in and how it impacts performance. Bear in mind that results will vary based on the workload and ambient air temperature.
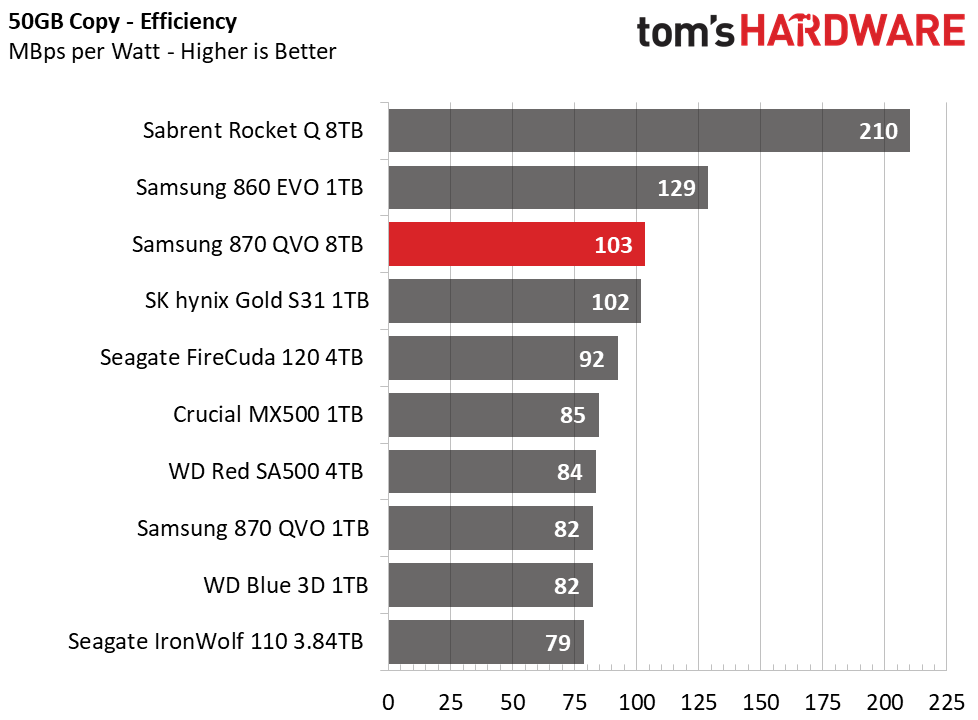
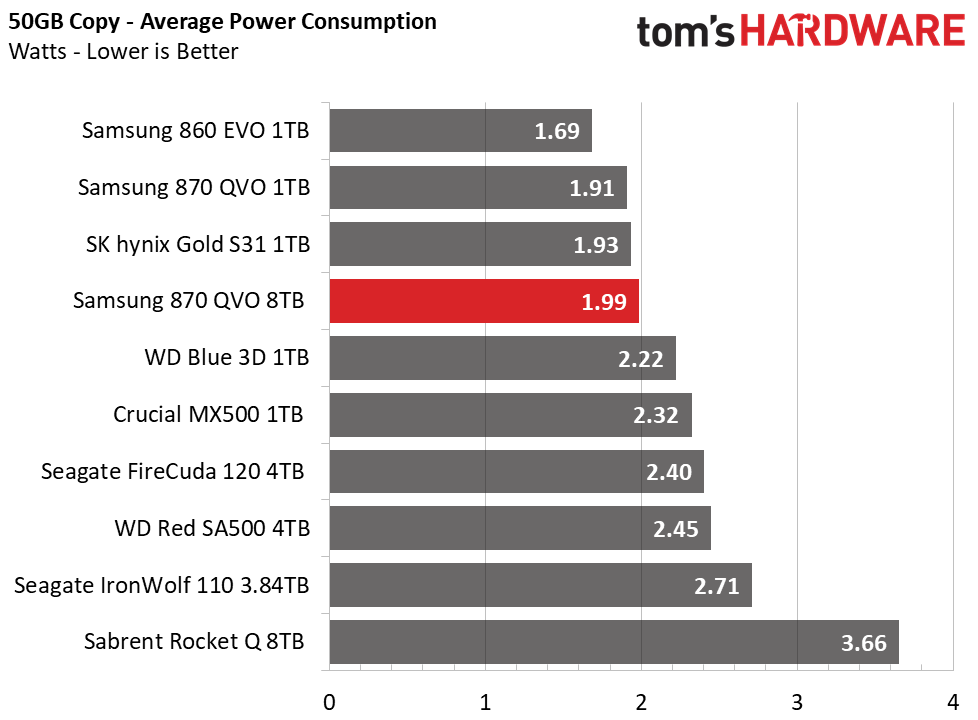
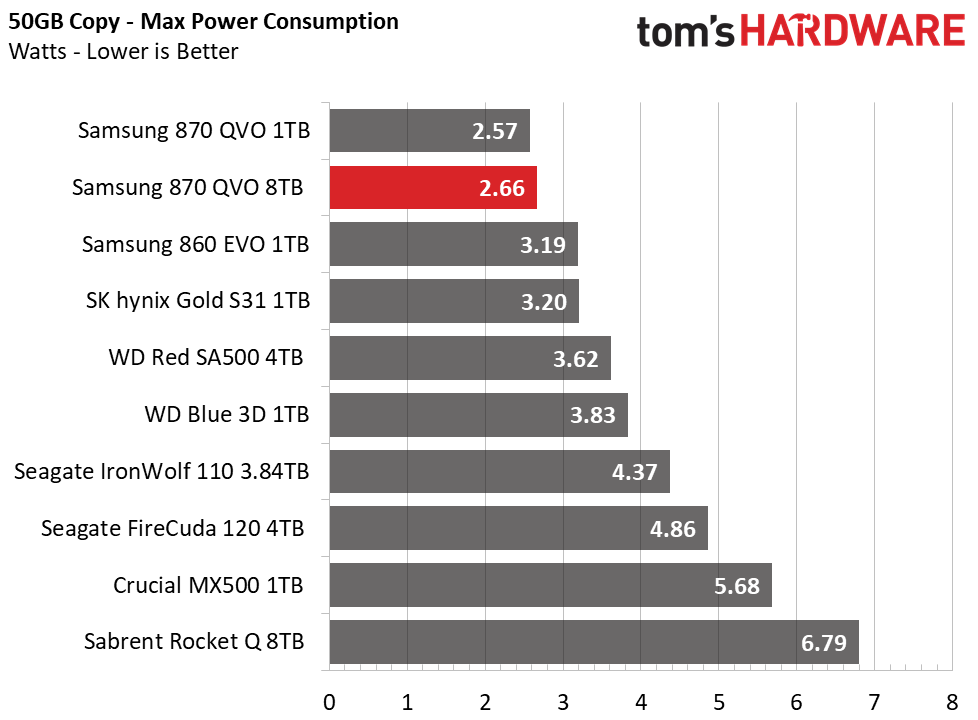
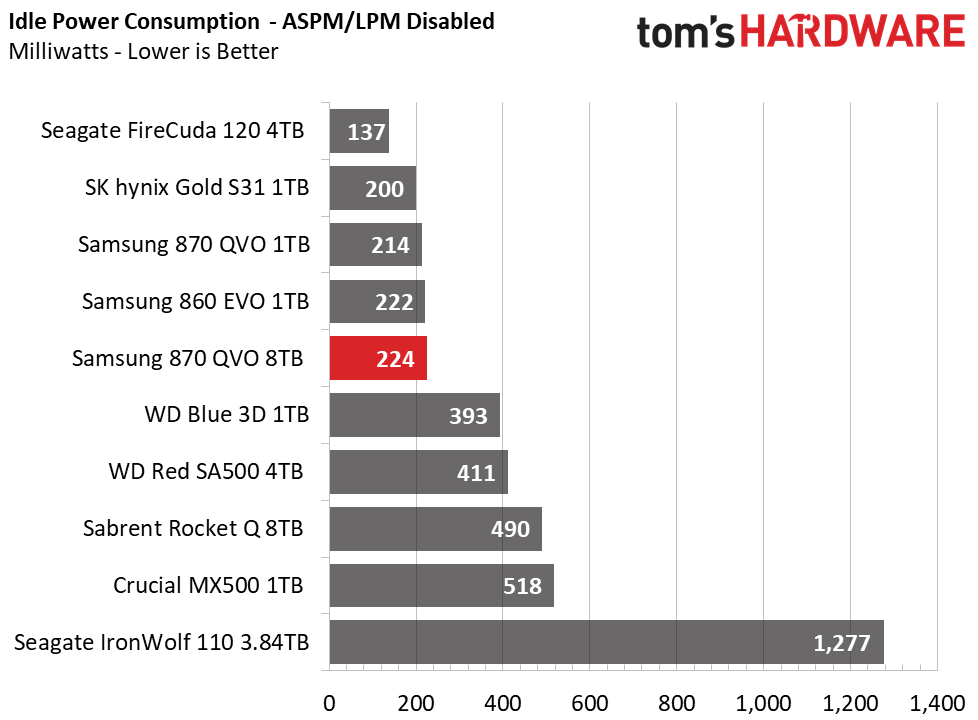
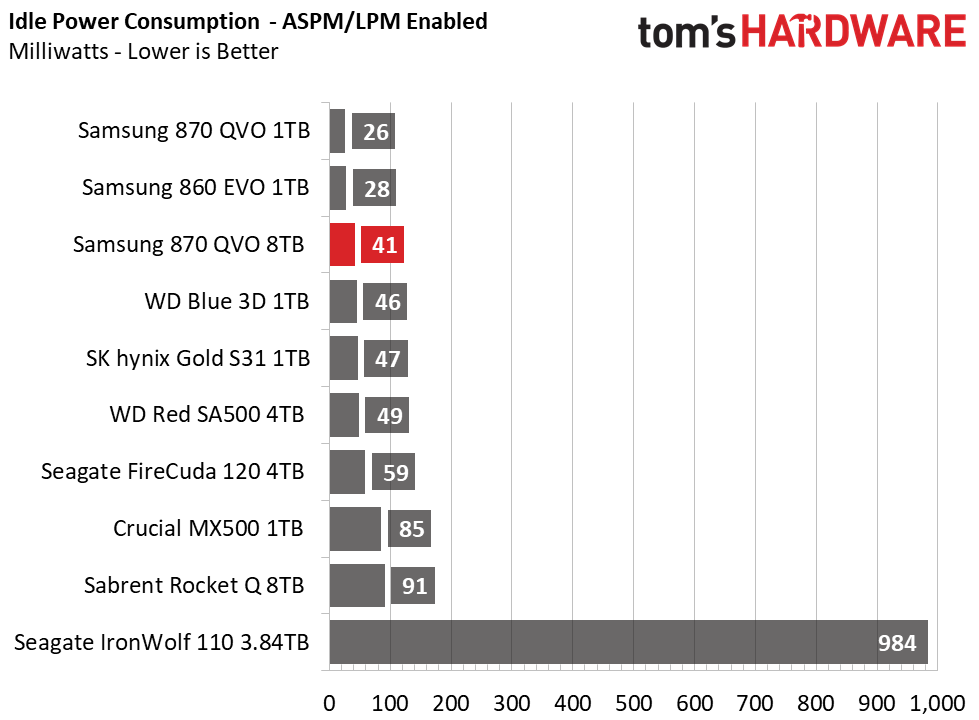
The 8TB QVO manages its Idle power consumption well. However, the QVO sucks more power when it is active than competing drives - Seagate’s FireCuda consumes roughly half of the power. Average power consumption while copying our test folder is only 2W, a minor increase from the 1TB model’s consumption. Plus, the drive places second only to the 1TB model in peak power draw, meaning that it should remain cool under any workload you throw its way. We measured controller temperatures within the low to mid-30s throughout testing, even with no airflow in a 24 degrees Celsius room.
Current page: 8TB Performance Results
Prev Page Features and Specifications Next Page 1TB Performance Results
Sean is a Contributing Editor at Tom’s Hardware US, covering storage hardware.
-
deesider ReplySamsung says it doesn't like to jump ahead and introduce a product to the market prematurely
What - which Samsung is this?! -
2Be_or_Not2Be There are a number of terrible QLC-based drives, like the Intel 660p, Sabrent Rocket Q (shame on Sabrent for associating the model name of their better-performing Rocket drive w/TLC!), etc.. I put them on the same low-performance tier as DRAM-less SSDs - that is, the tier of "do not buy". You're basically not saving any money over much higher-performing TLC-based alternatives (not DRAM-less) the way they are pricing the QLC drives.Reply
I would only use a QLC-based SSD for large storage wherein you can make backups to it that happen overnight or some time when you don't care about the much slower performance of the drive. Also, your use case dictates that you can only fit a SSD instead of a cheaper (and larger) 3.5" HDD (or two). -
Sn3akr Reply2Be_or_Not2Be said:There are a number of terrible QLC-based drives, like the Intel 660p, Sabrent Rocket Q (shame on Sabrent for associating the model name of their better-performing Rocket drive w/TLC!), etc.. I put them on the same low-performance tier as DRAM-less SSDs - that is, the tier of "do not buy". You're basically not saving any money over much higher-performing TLC-based alternatives (not DRAM-less) the way they are pricing the QLC drives.
I would only use a QLC-based SSD for large storage wherein you can make backups to it that happen overnight or some time when you don't care about the much slower performance of the drive. Also, your use case dictates that you can only fit a SSD instead of a cheaper (and larger) 3.5" HDD (or two).
Form a pure performance standpoint you're slightly right right.. But it all depends on the use case!
For Youtubers/streamers recording and making videos those lower level disks makes a bad purchase, but for storage, movies, games libraries and backup their excellent value.
Most people don't overwrite their movie libraries, game libraries or backups that often, and the main downside of TLC is their endurance.. But if you use it for weekly backup, they should be good for about 20 years of backup before you hit the 1000 rewrite MTBF (and i know NOBODY that runs 20 year old HW), Reading is not the problem for these discs, it's writing.
I run a 660P for my steam library, and I'm more than happy with the performance. I know its a few seconds slower than the fastest SSD's, but most people won't notice the difference.
A game like Metro Exodus, will load as follows:
High end NVME SSD : 18,27 sec
Low end SATA SSD : 24.08 sec (slower than 660p)
HDD : 45,13 sec
you'll save (MAYBE) about 5 seconds of loadtime, but the price/performance is out of proportion in that scenario, as 5x SSD speed doesn't mean 5x load times. and with the low amount of rewrites, it will last plenty of time..
For my OS and more write intensive tasks, I run faster disks with lower capacity, but higher endurance.
When buying a new SSD consider this..
Long term storage (game libraries, backup, movies library) QLC will do just fine, and real world performance will be almost identical.
For video/foto editing, rendering, CAD etc with lots of writes, a disc with higher endurance will be preferable.. And when done with your project.. Store it on QLC :whistle:
Also.. If benchmarks means the world to you.. Go buy the most blazing fast you can afford, just don't be disappointed if you games don't load faster. -
daeros I bought a Micron 5100 ECO 4tb drive almost 2 years ago, new, for $300US. It's a TLC drive, and has both DRAM for cache and a capacitor for power loss. The issue with the QVO now is the same as it was then - there's no value there. I can spend less and get more with other manufacturers.Reply -
MoxNix High price, low endurance, terrible warranty and very poor performance, that's what you get with low end (QLC or DRAMless) SSDs. Decent TLC *with DRAM solutions that perform better, last longer and have better warranties are available at similar prices. The only thing this drive has over them is you can get it in a larger capacity and that simply isn't worth all the drawbacks that come with it.Reply
There's plenty of competition for high performance SSDs now. Samsung can't price gouge the high end the way they used to anymore so they're trying to make it up with overpriced low end junk instead.
For that matter, their price fixing RAM prices has fallen apart too and now this. They must be really desperate to gouge buyers any way they can. -
chickenballs $130 for a 1tb SATA ssd with QLC nand in 2020 is just laughable. I paid just over $130 for the mp510 1tb nvme ssdReply
That O stands for Overpriced. -
Adz_au Reply
You shouldn't store anything you want to keep on flash memory. It all has a tendency to go bad (bit rot) if not plugged in, in as little as two weeks, you can start to lose your data in corruption.Sn3akr said:
........
Most people don't overwrite their movie libraries, game libraries or backups that often, and the main downside of TLC is their endurance.. But if you use it for weekly backup, they should be good for about 20 years of backup before you hit the 1000 rewrite MTBF (and i know NOBODY that runs 20 year old HW), Reading is not the problem for these discs, it's writing.
For video/foto editing, rendering, CAD etc with lots of writes, a disc with higher endurance will be preferable.. And when done with your project.. Store it on QLC :whistle:
Also.. If benchmarks means the world to you.. Go buy the most blazing fast you can afford, just don't be disappointed if you games don't load faster.
A HDD is still superior for storage, yet not perfect. Magnetism will deteriorate over time. Long-Life DVD/B-Ray storage is the best currently for consumers.
Certainly NOT Flash RAM for backups/long term storage though. A big no-no.
https://www.quora.com/Is-an-SSD-the-better-option-than-an-HDD-for-backing-up-files-photos-audio-data-The-drive-will-only-be-used-externally-and-will-not-be-powered-on-or-attached-to-a-PC-continuously-1?share=1 -
Hartemis Reply
You're exaggerating. Not two weeks, but two years. Even your source says so.Adz_au said:You shouldn't store anything you want to keep on flash memory. It all has a tendency to go bad (bit rot) if not plugged in, in as little as two weeks, you can start to lose your data in corruption.
A HDD is still superior for storage, yet not perfect. Magnetism will deteriorate over time. Long-Life DVD/B-Ray storage is the best currently for consumers.
Certainly NOT Flash RAM for backups/long term storage though. A big no-no.
https://www.quora.com/Is-an-SSD-the-better-option-than-an-HDD-for-backing-up-files-photos-audio-data-The-drive-will-only-be-used-externally-and-will-not-be-powered-on-or-attached-to-a-PC-continuously-1?share=1
I've already tried it, with an QVO 870 8Tb left unplugged for a time. No bit rot found when I checked the integrity of my data (checksum) 15 months later. I don't know if 100 devices in the same conditions would all have given me the same result, and I certainly wouldn't have ventured any longer, but several mounths unpowered is definitely safe for an sdd, even QLC.
But for more than a couple of years, you're right. Prefer a HDD, and rewrite the data from time to time.
