Thermaltake Toughpower DPS G 1200W PSU Review
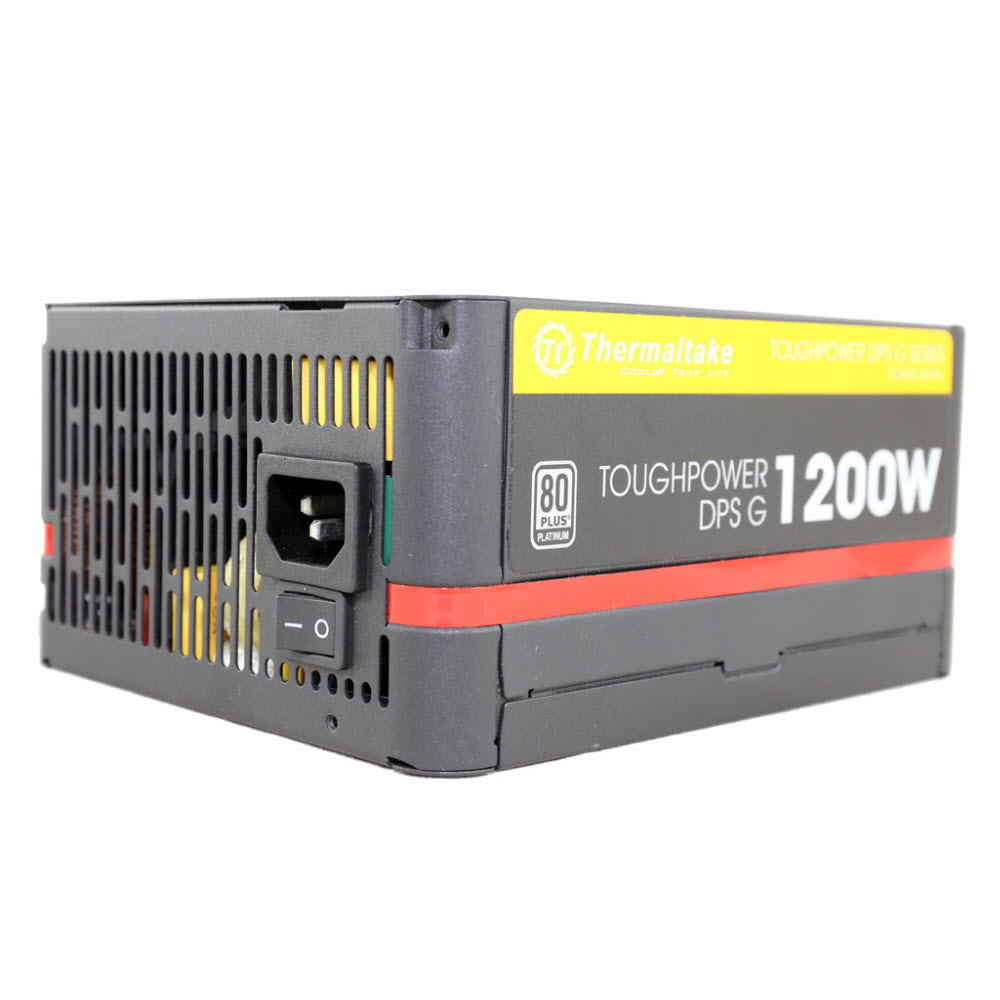
Thermaltake introduced the Toughpower DPS G Platinum line that consists of three new, semi-digital and fully modular PSUs made by Enhance Electronics. The highest-capacity 1200W model is our test subject in today's review.
Why you can trust Tom's Hardware
Load Regulation, Hold-Up Time And Inrush Current
To learn more about our PSU tests and methodology, please check out How We Test Power Supply Units.
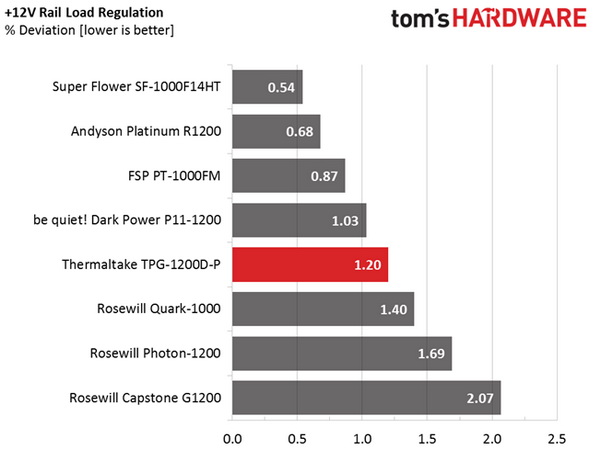
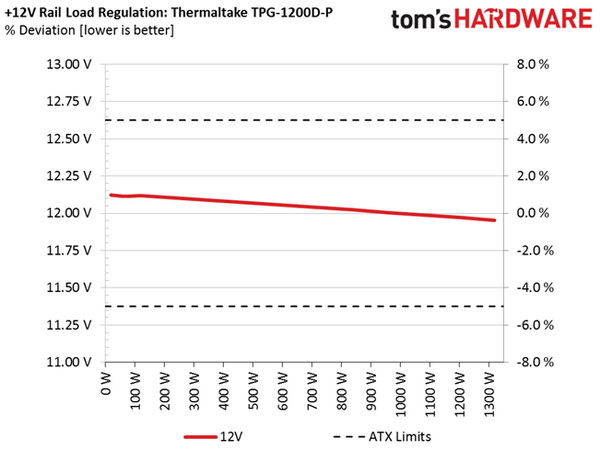
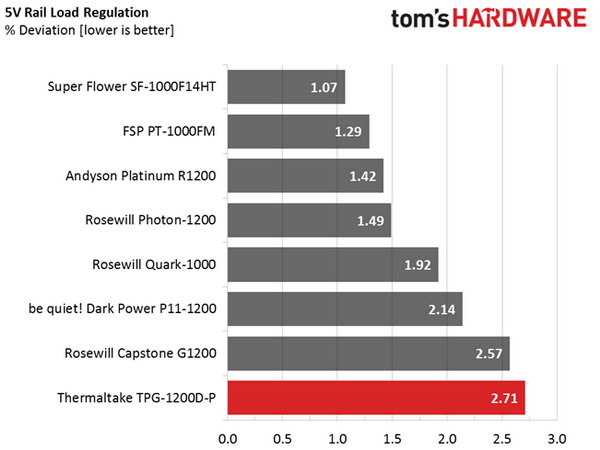
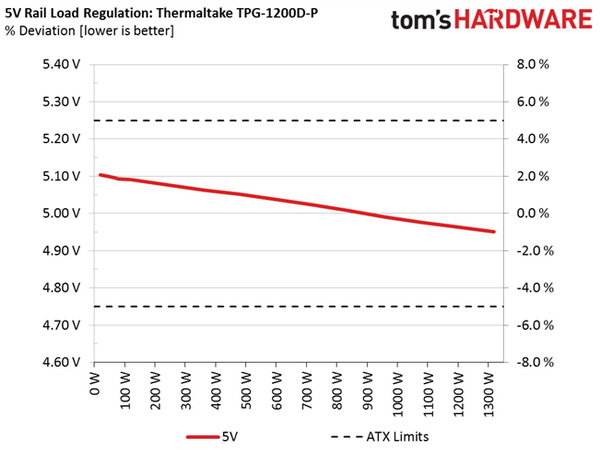
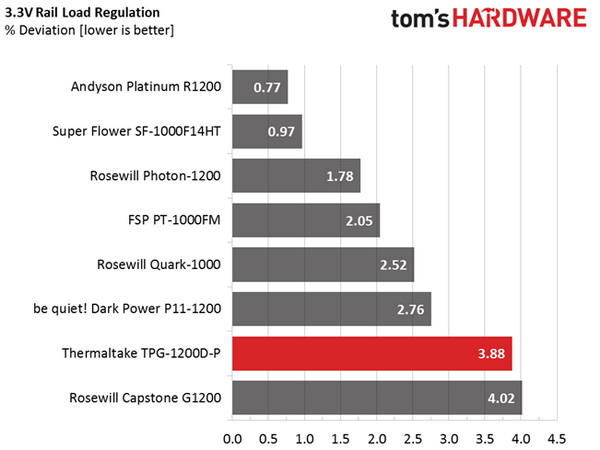
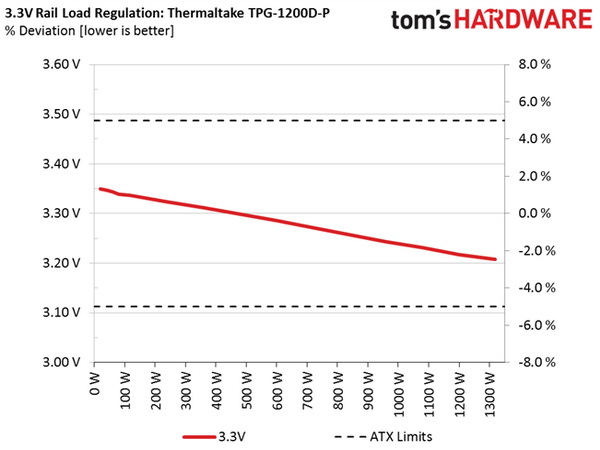
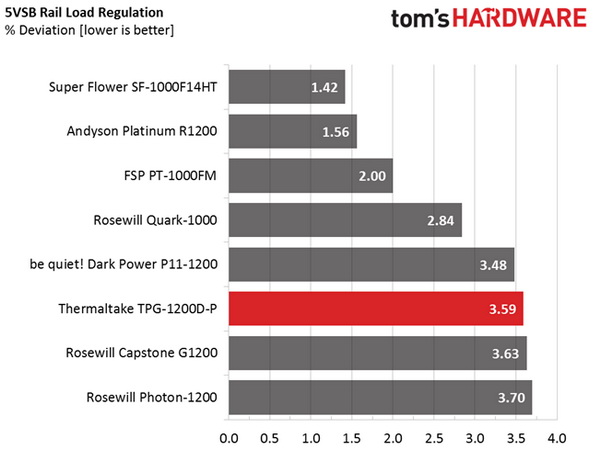
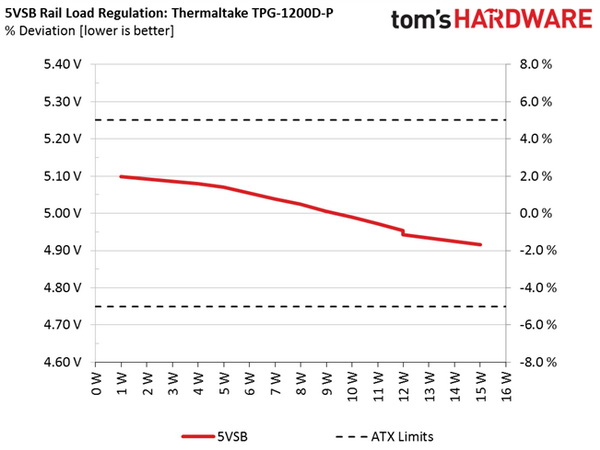
Primary Rails And 5VSB Load Regulation
Load Regulation testing is detailed here.
Hold-Up Time
Our hold-up time tests are described in detail here.
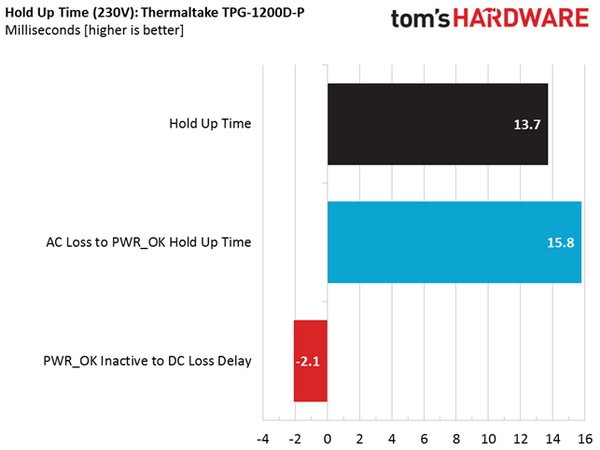
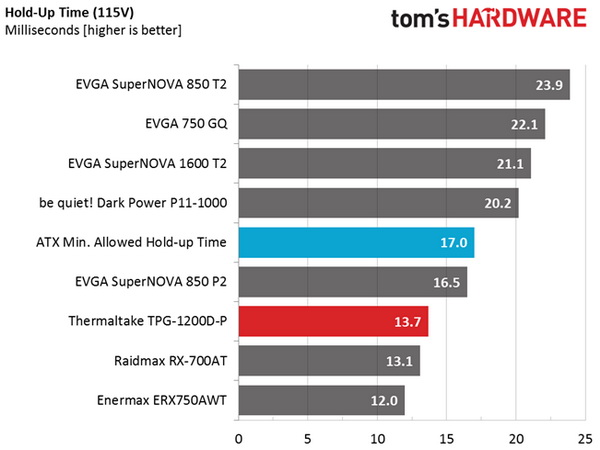
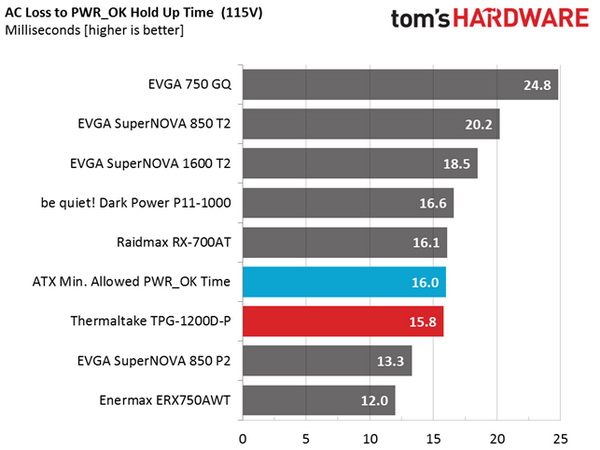
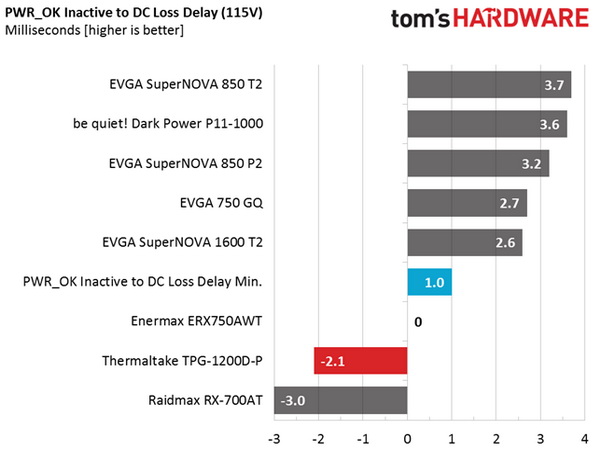
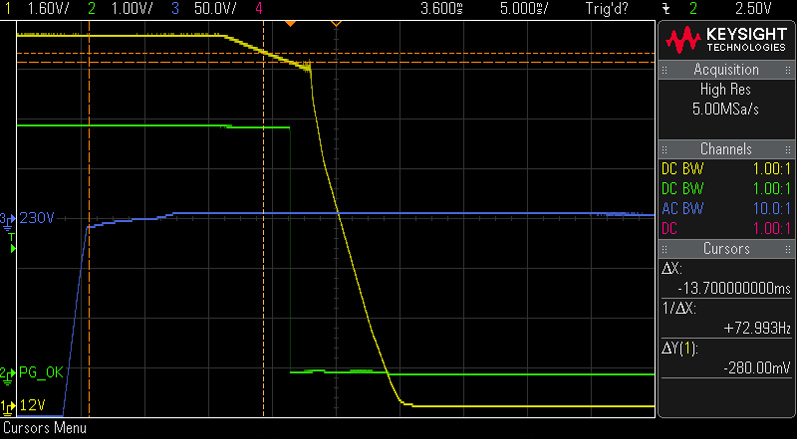
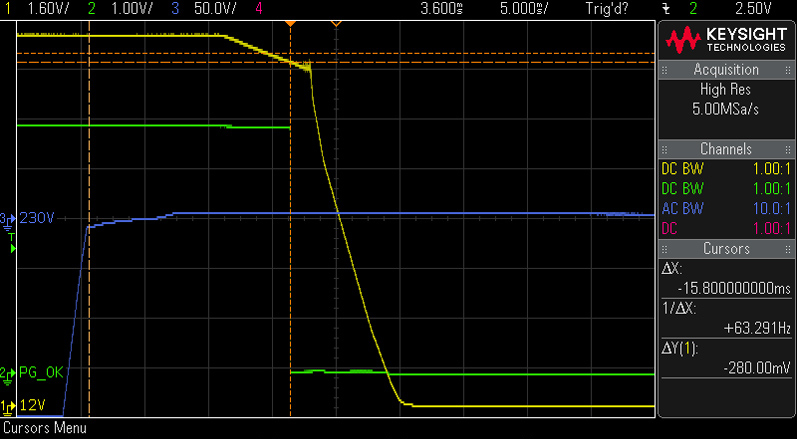
The TPG-1200D-P's hold-up time isn't only lower than the ATX spec's requirement, but it is also lower than the power-good signal's hold-up time. In other words, once the power-good signal drops, the rails are already out of spec. This is something we hate to see, especially in expensive high-end PSUs. Hopefully OEMs start using bulk caps with the right capacity. After all, it's a lot harder to cheat in this discipline since we can easily expose shortcomings and warn our readers to watch out for them.
Inrush Current
For details on our inrush current testing, please click here.
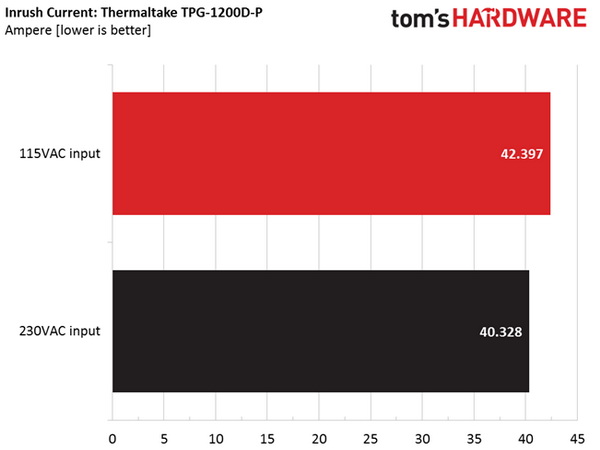
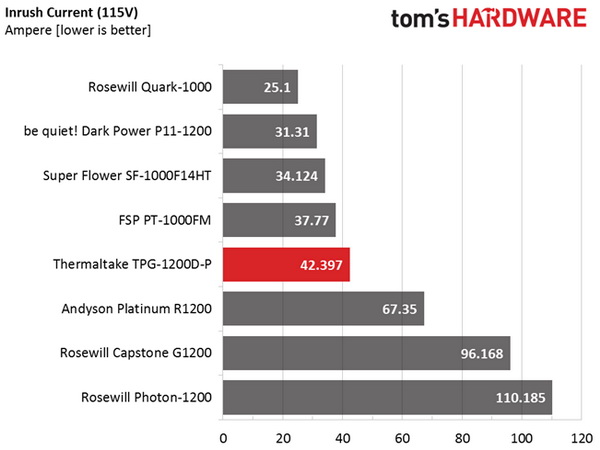
The inrush current is low in both cases (115V and 230V).
Load Regulation And Efficiency Measurements
The first set of tests reveals the stability of the voltage rails and the PSU's efficiency. The applied load equals (approximately) 10 to 110 percent of the maximum load the supply can handle, in increments of 10 percentage points.
Get Tom's Hardware's best news and in-depth reviews, straight to your inbox.
We conducted two additional tests. During the first, we stressed the two minor rails (5V and 3.3V) with a high load, while the load at +12V was only 0.10A. This test reveals whether a PSU is Haswell-ready or not. In the second test, we determined the maximum load the +12V rail could handle with minimal load on the minor rails.
| Test # | 12V | 5V | 3.3V | 5VSB | DC/AC (Watts) | Efficiency | Fan Speed (RPM) | Fan Noise (dB[A]) | Temps (In/Out) | PF/AC Volts |
|---|---|---|---|---|---|---|---|---|---|---|
| 1 | 8.104A | 1.963A | 1.975A | 0.985A | 119.78 | 88.44% | 840 | 29.9 | 38.71 °C | 0.948 |
| 12.118V | 5.091V | 3.336V | 5.071V | 135.43 | 41.81 °C | 115.1V | ||||
| 2 | 17.250A | 2.948A | 2.977A | 1.186A | 239.61 | 92.08% | 840 | 29.9 | 39.04 °C | 0.969 |
| 12.102V | 5.077V | 3.323V | 5.055V | 260.23 | 42.49 °C | 115.1V | ||||
| 3 | 26.787A | 3.455A | 3.500A | 1.385A | 359.84 | 92.62% | 840 | 29.9 | 39.45 °C | 0.978 |
| 12.087V | 5.063V | 3.312V | 5.039V | 388.52 | 43.11 °C | 115.1V | ||||
| 4 | 36.329A | 3.954A | 3.999A | 1.591A | 479.65 | 92.49% | 864 | 30.2 | 40.74 °C | 0.984 |
| 12.070V | 5.052V | 3.299V | 5.024V | 518.62 | 45.46 °C | 115.1V | ||||
| 5 | 45.551A | 4.968A | 5.020A | 1.795A | 599.62 | 91.98% | 864 | 30.2 | 41.07 °C | 0.988 |
| 12.055V | 5.037V | 3.286V | 5.006V | 651.93 | 46.20 °C | 115.1V | ||||
| 6 | 54.803A | 5.973A | 6.050A | 2.000A | 719.50 | 90.66% | 1224 | 44.7 | 41.90 °C | 0.990 |
| 12.038V | 5.023V | 3.272V | 4.990V | 793.64 | 47.64 °C | 115.1V | ||||
| 7 | 64.072A | 6.993A | 7.089A | 2.209A | 839.36 | 89.85% | 1560 | 45.4 | 43.69 °C | 0.991 |
| 12.022V | 5.007V | 3.257V | 4.972V | 934.14 | 49.71 °C | 115.1V | ||||
| 8 | 73.381A | 8.015A | 8.138A | 2.420A | 959.31 | 88.97% | 1824 | 49.8 | 45.33 °C | 0.992 |
| 12.005V | 4.990V | 3.243V | 4.954V | 1078.27 | 51.81 °C | 115.1V | ||||
| 9 | 83.136A | 8.541A | 8.697A | 2.425A | 1079.30 | 88.10% | 2128 | 52.3 | 46.30 °C | 0.992 |
| 11.989V | 4.976V | 3.231V | 4.943V | 1225.09 | 53.31 °C | 115.1V | ||||
| 10 | 92.673A | 9.069A | 9.230A | 3.050A | 1199.17 | 87.11% | 2184 | 52.3 | 47.83 °C | 0.992 |
| 11.972V | 4.963V | 3.217V | 4.915V | 1376.66 | 55.62 °C | 115.1V | ||||
| 11 | 102.863A | 9.088A | 9.261A | 3.056A | 1319.20 | 86.21% | 2184 | 52.3 | 44.52 °C | 0.994 |
| 11.953V | 4.951V | 3.207V | 4.904V | 1530.23 | 51.01 °C | 115.1V | ||||
| CL1 | 0.101A | 14.022A | 14.005A | 0.004A | 117.96 | 83.20% | 1080 | 38.8 | 42.23 °C | 0.945 |
| 12.122V | 5.036V | 3.292V | 5.066V | 141.78 | 46.98 °C | 115.1V | ||||
| CL2 | 99.950A | 1.002A | 1.003A | 1.002A | 1209.57 | 87.37% | 2184 | 52.3 | 45.38 °C | 0.993 |
| 11.969V | 5.001V | 3.253V | 4.986V | 1384.49 | 52.32 °C | 115.1V |
With 20 percent load, efficiency is much higher than the 80 PLUS Platinum spec's 90 percent requirement. Under 50 percent load, efficiency is on-point with an almost 92 percent reading. Meanwhile, under full load, the PSU is 1.9 percent away from the corresponding threshold (89 percent). Obviously the high temperatures we use for testing play a part in keeping the PSU from hitting 89 percent.
Load regulation is pretty tight at +12V, but that's not the case for the other rails. Still, +12V is what matters most since it's used by a majority of components nowadays. The other rails are only used lightly, so their load regulation isn't as important. We don't want to see ~3.2V readings on the 3.3V rail though, which is what happens during our full load and overload tests.
The fan profile is relaxed up to our 50 percent load test. It starts getting out of hand at 60 percent load, and then exceeds 50 dB(A) during the last tests. If you push the TPG-1200D-P as hard as we did, the high-speed fan will hurt your ears. It's worth mentioning that we set the fan profile mode to Performance through DPSApp. However, even that wasn't enough to let the TPG-1200D-P deliver its full power once the ambient temperature crested 48 degrees C. The problem wasn't hardware related. Rather, it had to do with DPSApp itself. The software raises an alarm once the PSU's internal temperature reaches 60 degrees C. This alarm doesn't shut down the PSU, but it continuously shows an annoying message that makes the program unresponsive. Thermaltake should raise the temperature triggering point since, according to the company's specifications, full power can be delivered continuously at up to 50 degrees C. Bottom-line, if you don't use DPSApp, then you probably won't have any problems running in environments up to 50 degrees C. But with the software running, all hell breaks loose and you have to close the application.
DPSApp Screenshots
You will find several screenshots of the DPSApp software below, which we took during our test sessions.
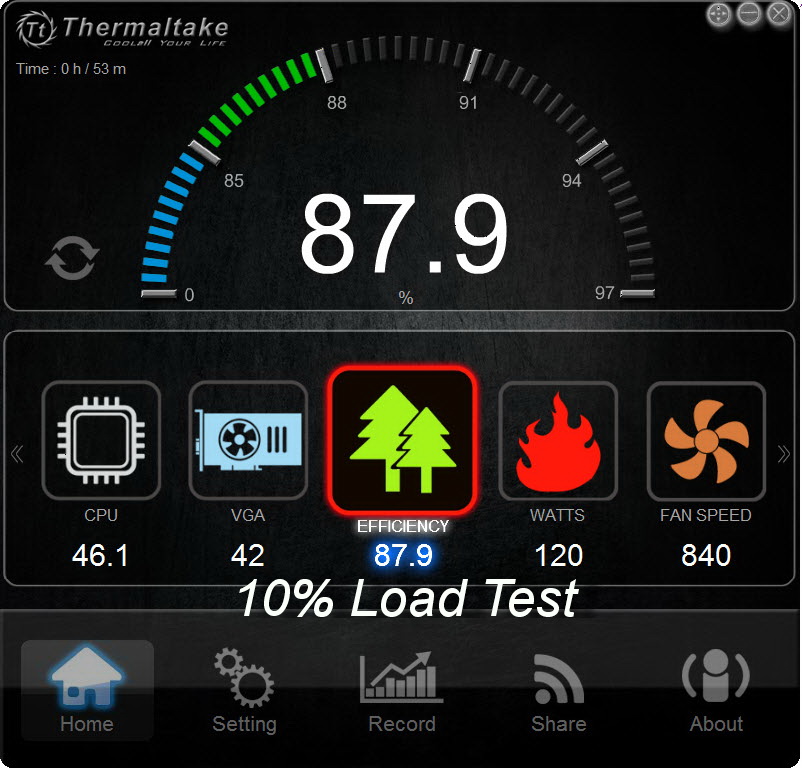
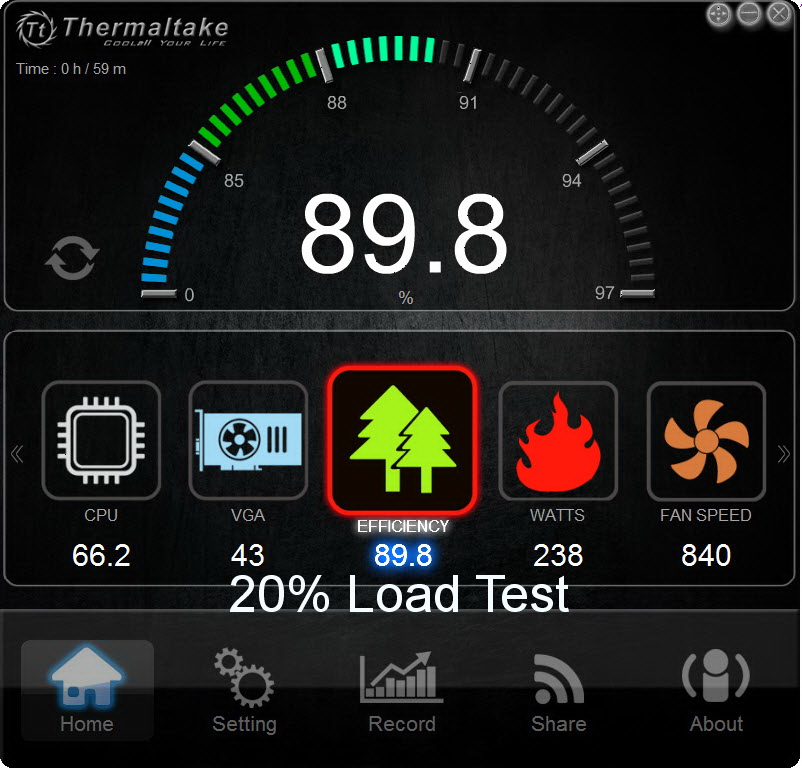
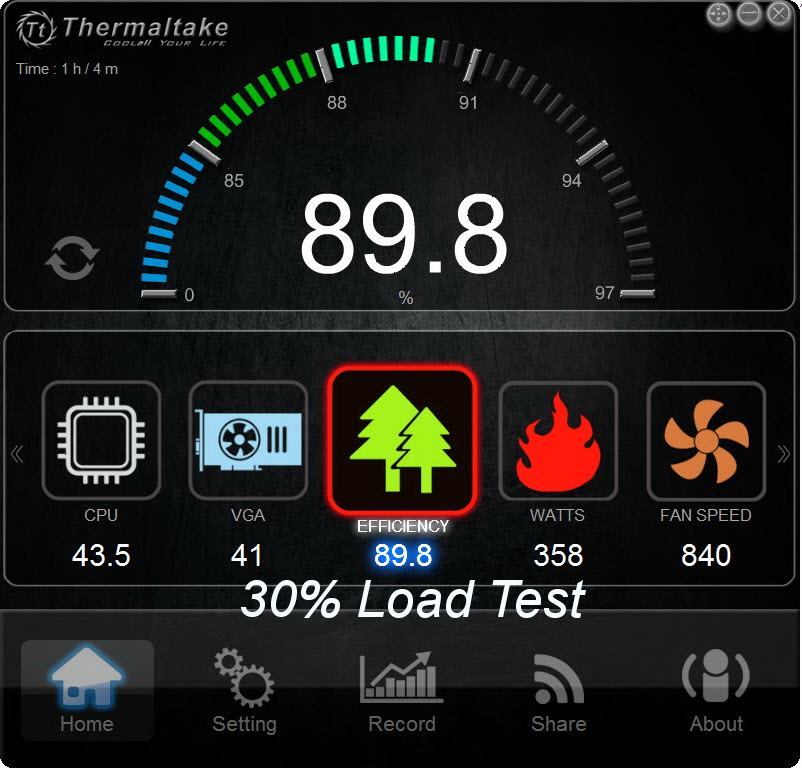
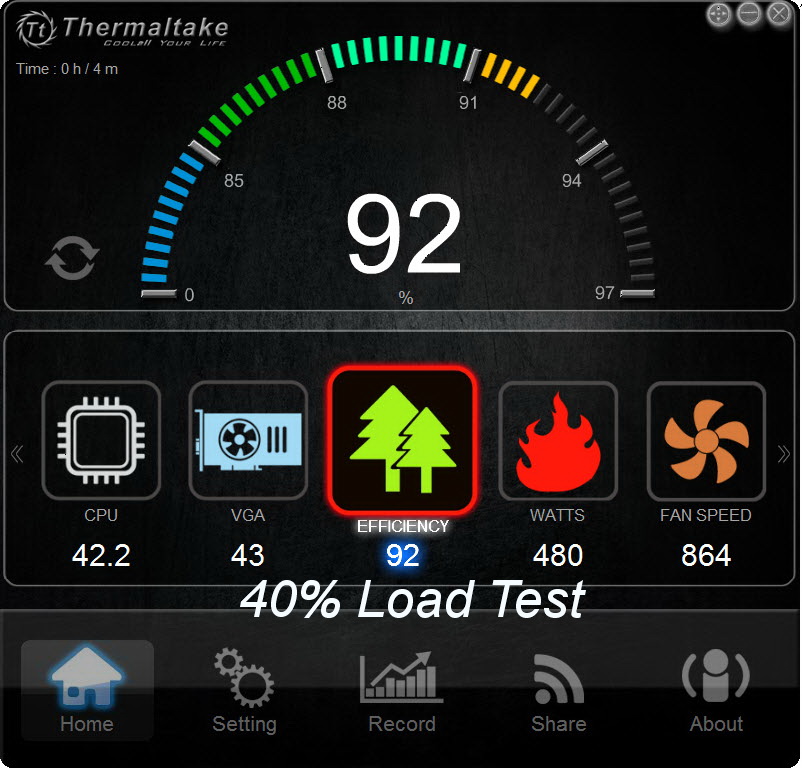
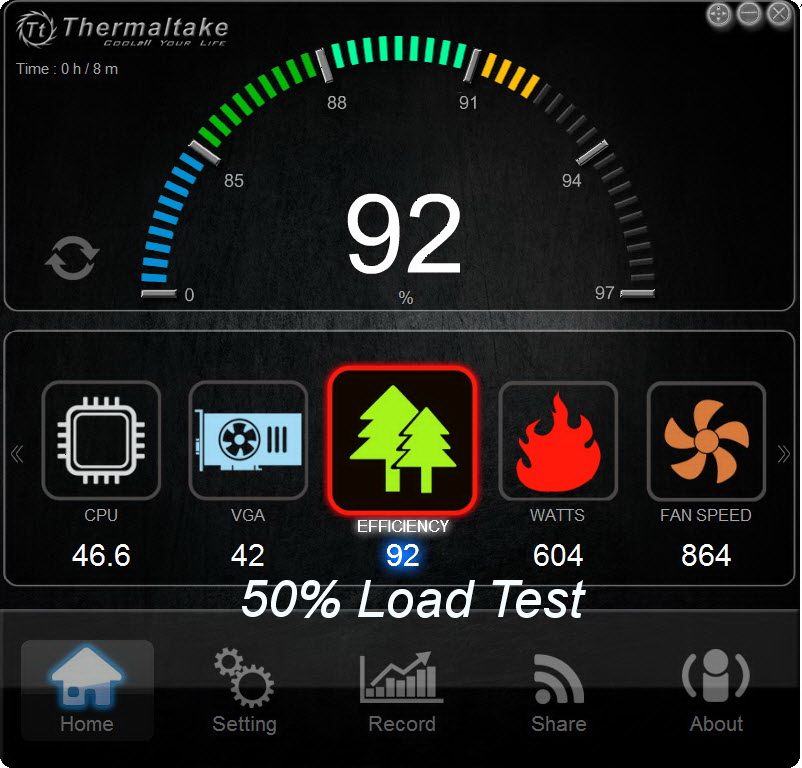
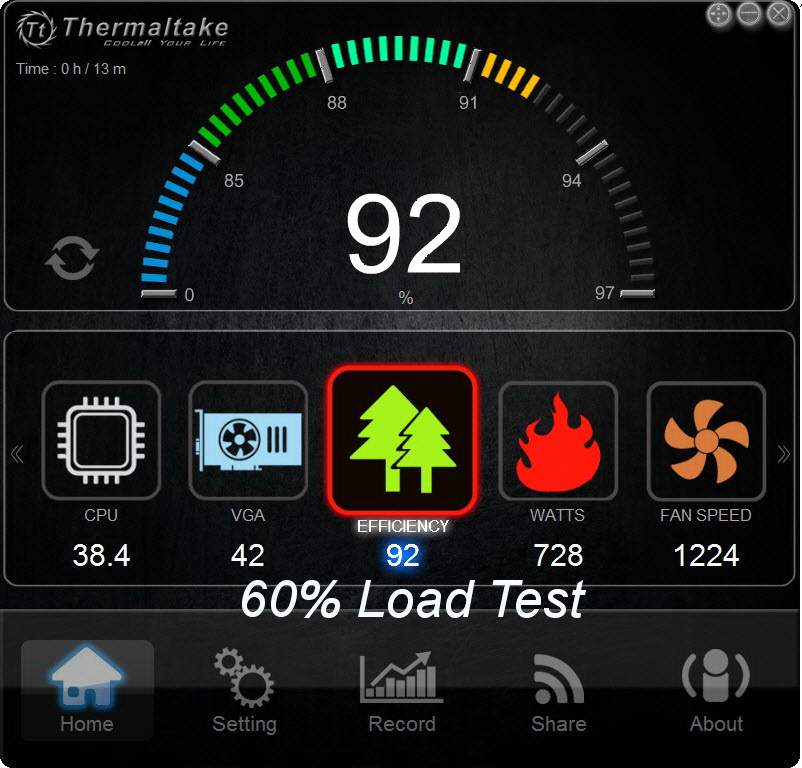
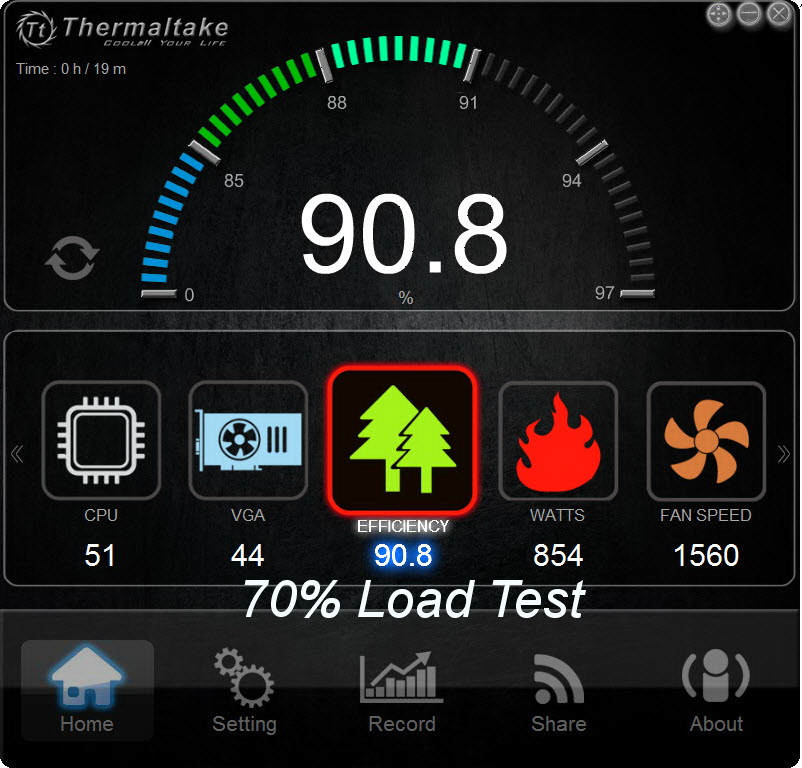
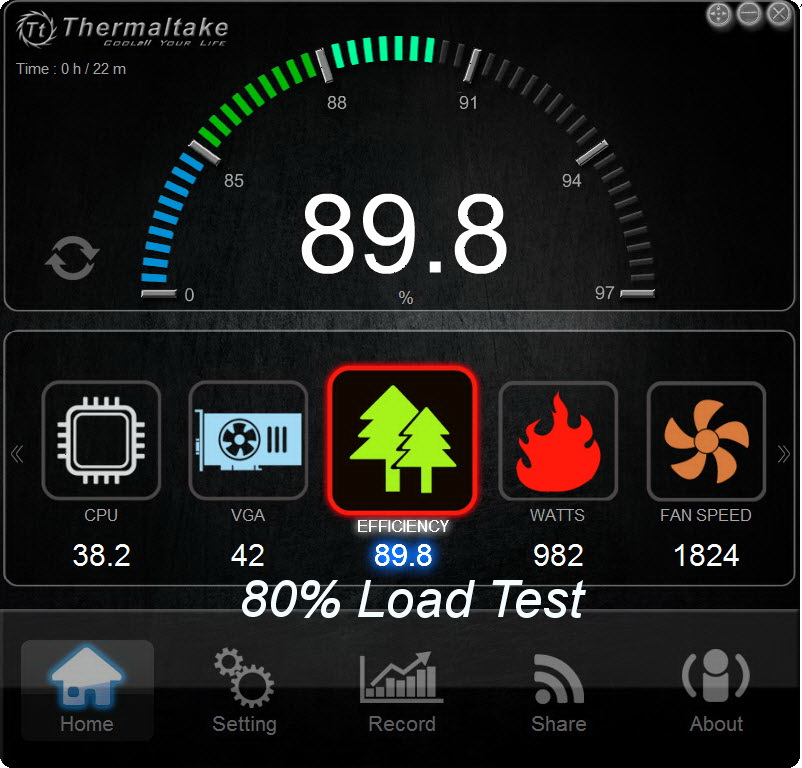
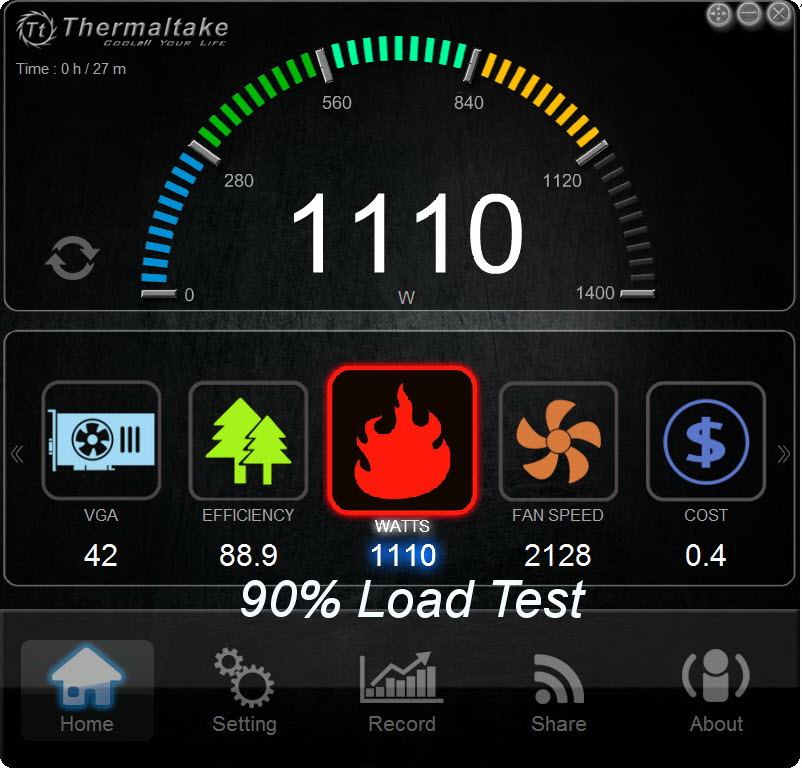
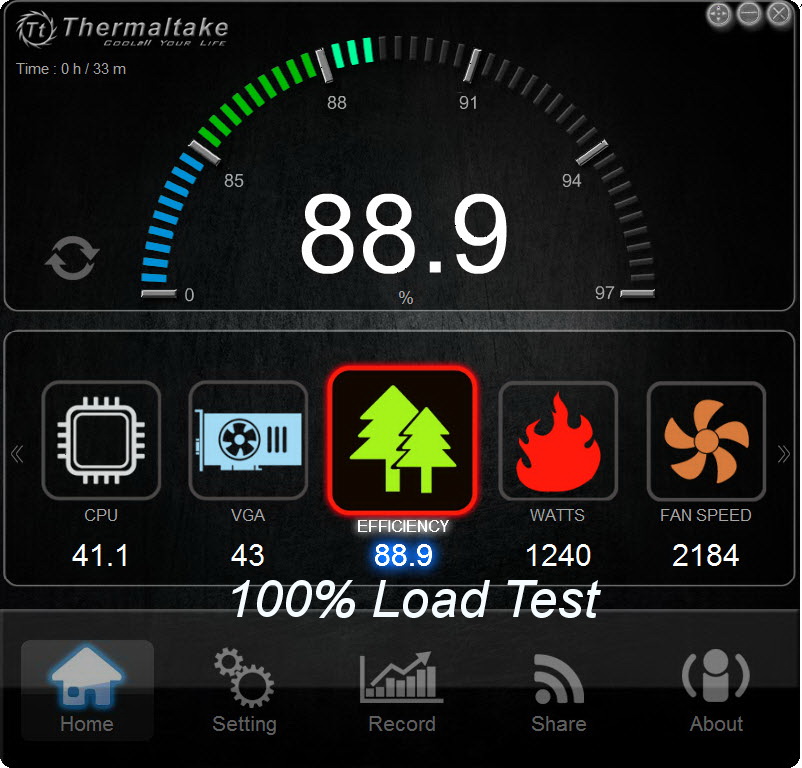
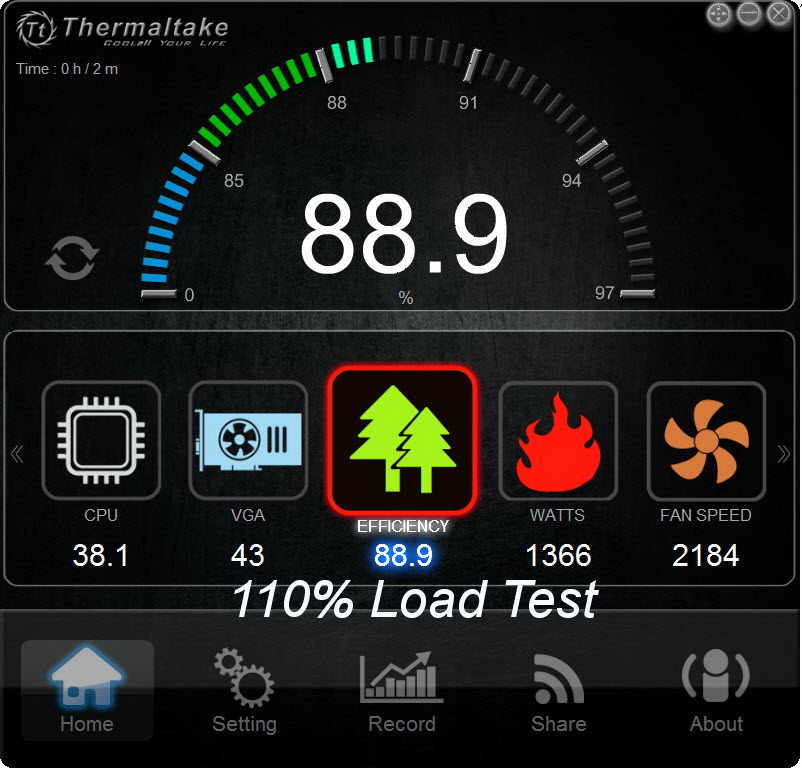
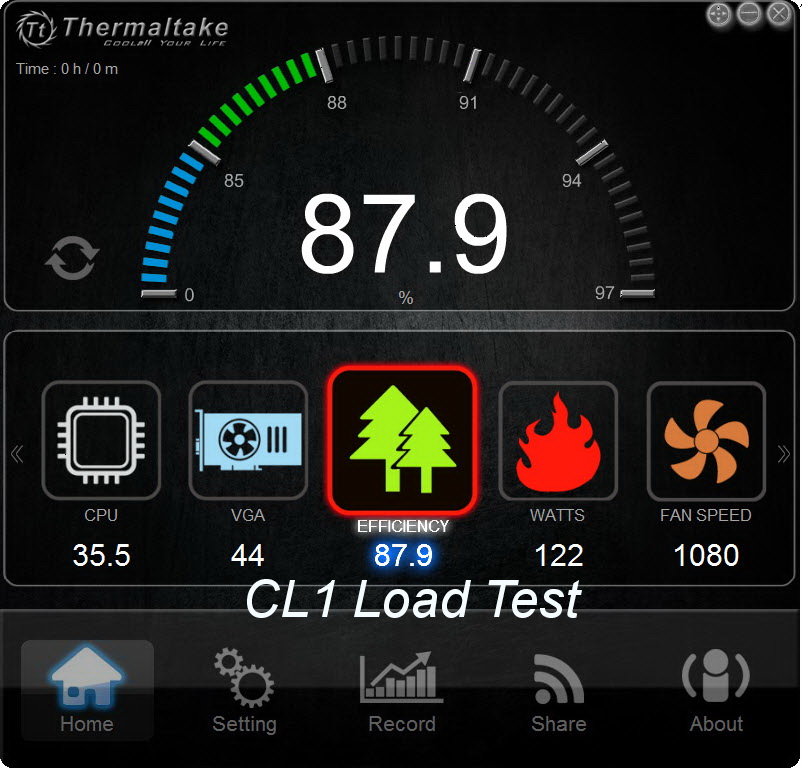
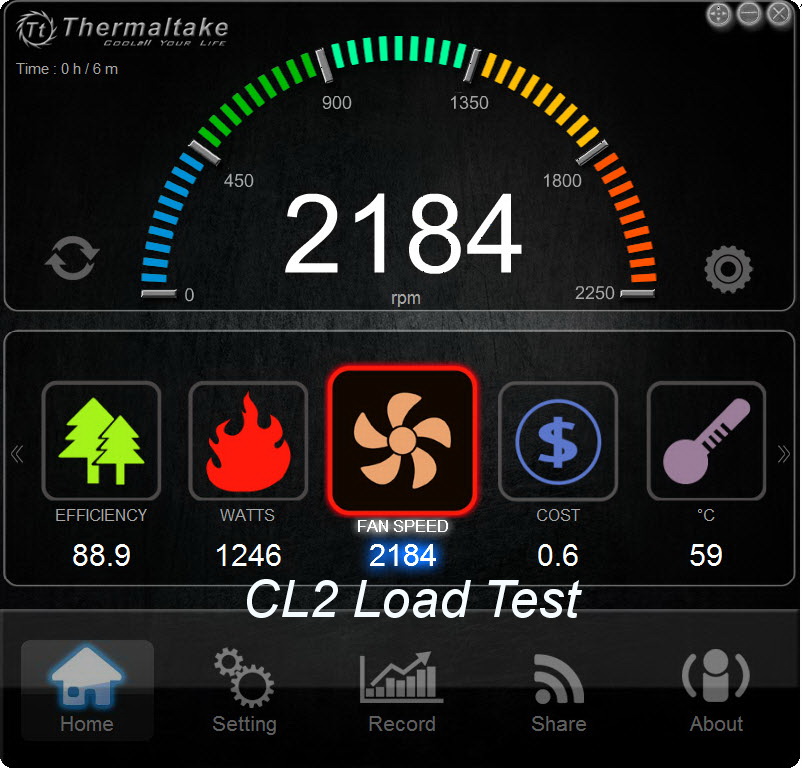
Up to the 50 percent load test, the power out readings are spot-on. With 60 percent load, the difference is quite small. At 70 percent load and up, the power delivery accuracy takes a hit that gets larger as load levels increase. Strangely enough, in all but one test (50 percent load), the efficiency readings are way off. And given the accuracy of the power-out levels, the problem seems to be with the power-in readings. This is most likely the reason why Thermltake decided not to expose the wattage drawn from the mains network through its DPSApp.
Current page: Load Regulation, Hold-Up Time And Inrush Current
Prev Page A Look Inside And Component Analysis Next Page Efficiency, Temperature And Noise
Aris Mpitziopoulos is a contributing editor at Tom's Hardware, covering PSUs.
-
Myrmidonas I do not see anywhere the limitation regarding the need of Flash Active X 15 and only that, in order the PSU's software DPSapp to operate. Is there anything changed? I own one of its little brothers the Toughpower 550W and on my system the DPSApp refuses to run on an Active X version higher than 15.In fact on the download page there is a note sayingReply
"※Note: The Adobe Flash Player ActiveX 20.0.0 version or above might NOT be compatible DPS G PC App."
http://www.thermaltake.com/dpsappdownload.aspx?type=dpsapp
or
"※Note: The DPS G PC App requires Adobe Flash Player Version 2.0.0.270 or above and Microsoft .NET Version 4.5 or above."
http://www.thermaltake.com/DPSGApp2download.aspx?type=dpsgapp2 -
TechyInAZ ReplyThis is a wimpy power supply. Bring on 5 KW units!
:lol: It would be great for litecoining machines. :) -
Aris_Mp hm I am not aware of this flash/directX issue. In my system I just installed the DPSApp and it ran fine. I have all updates installed. However this App still needs work and they should abandon the flash platform IMO.Reply -
Myrmidonas Reply18063833 said:hm I am not aware of this flash/directX issue. In my system I just installed the DPSApp and it ran fine. I have all updates installed. However this App still needs work and they should abandon the flash platform IMO.
In my case, I had no Flash on my system at all. I consider it dangerous and useless. But in order to operate DPSApp I first installed the latest version of Flash and the DPSApp crashes every time i try to open the GUI. Only on the v15 I manage to make it work. :sarcastic: -
TheUnhandledException ReplyPSUs in the >1kW range should deliver at least 3.5A-4A on 5VSB.
Why? It is the standby power? What modern system needs more than 15W standby? -
Aris_Mp it isn't the system that needs it, but the devices that you might try to charge through 5VSB when the PSU is in standby.Reply -
terroralpha so, there is absolutely no reason to buy this over the aging AX1200i or even the not-as-fancy HX1200i... in fact, if you buy this unit you either live in a country where corsair PSUs are hard to get or you are a moron.Reply
it failed the hold up requirement, regulation and ripple is mediocre at best, it's hideous and single rail designs really need to go from PSUs this powerful. 100 amperes is enough to arc weld! if the DSP malfunctions and send 100 amps down your motherboard or GPU, it'll set your house on fire. this isn't really a problem with old school analog designs. but with anything digitally controlled, bugs are always a concern.
AX1200i is a way better performer in pretty much every metric, has a 10 year warranty these days, and individually sleeved cables are relatively cheap and readily available.
