AMD Ryzen 5 1600X CPU Review
Why you can trust Tom's Hardware
Temperatures And Many Questions
The Tctl Sensor Results Pose Many Questions
One of the lessons learned during the Ryzen 7 launch was that AMD's temperature sensor output has its share of problems. The company configured some of the models to report an additional 20°C on top of the actual temperature in order to guarantee adequate cooling. We’re still puzzled by this choice.
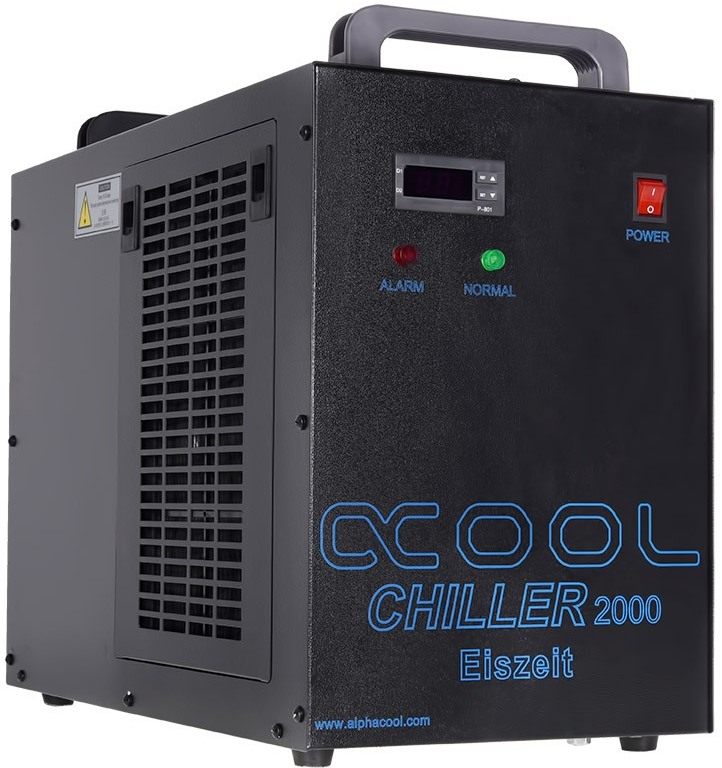
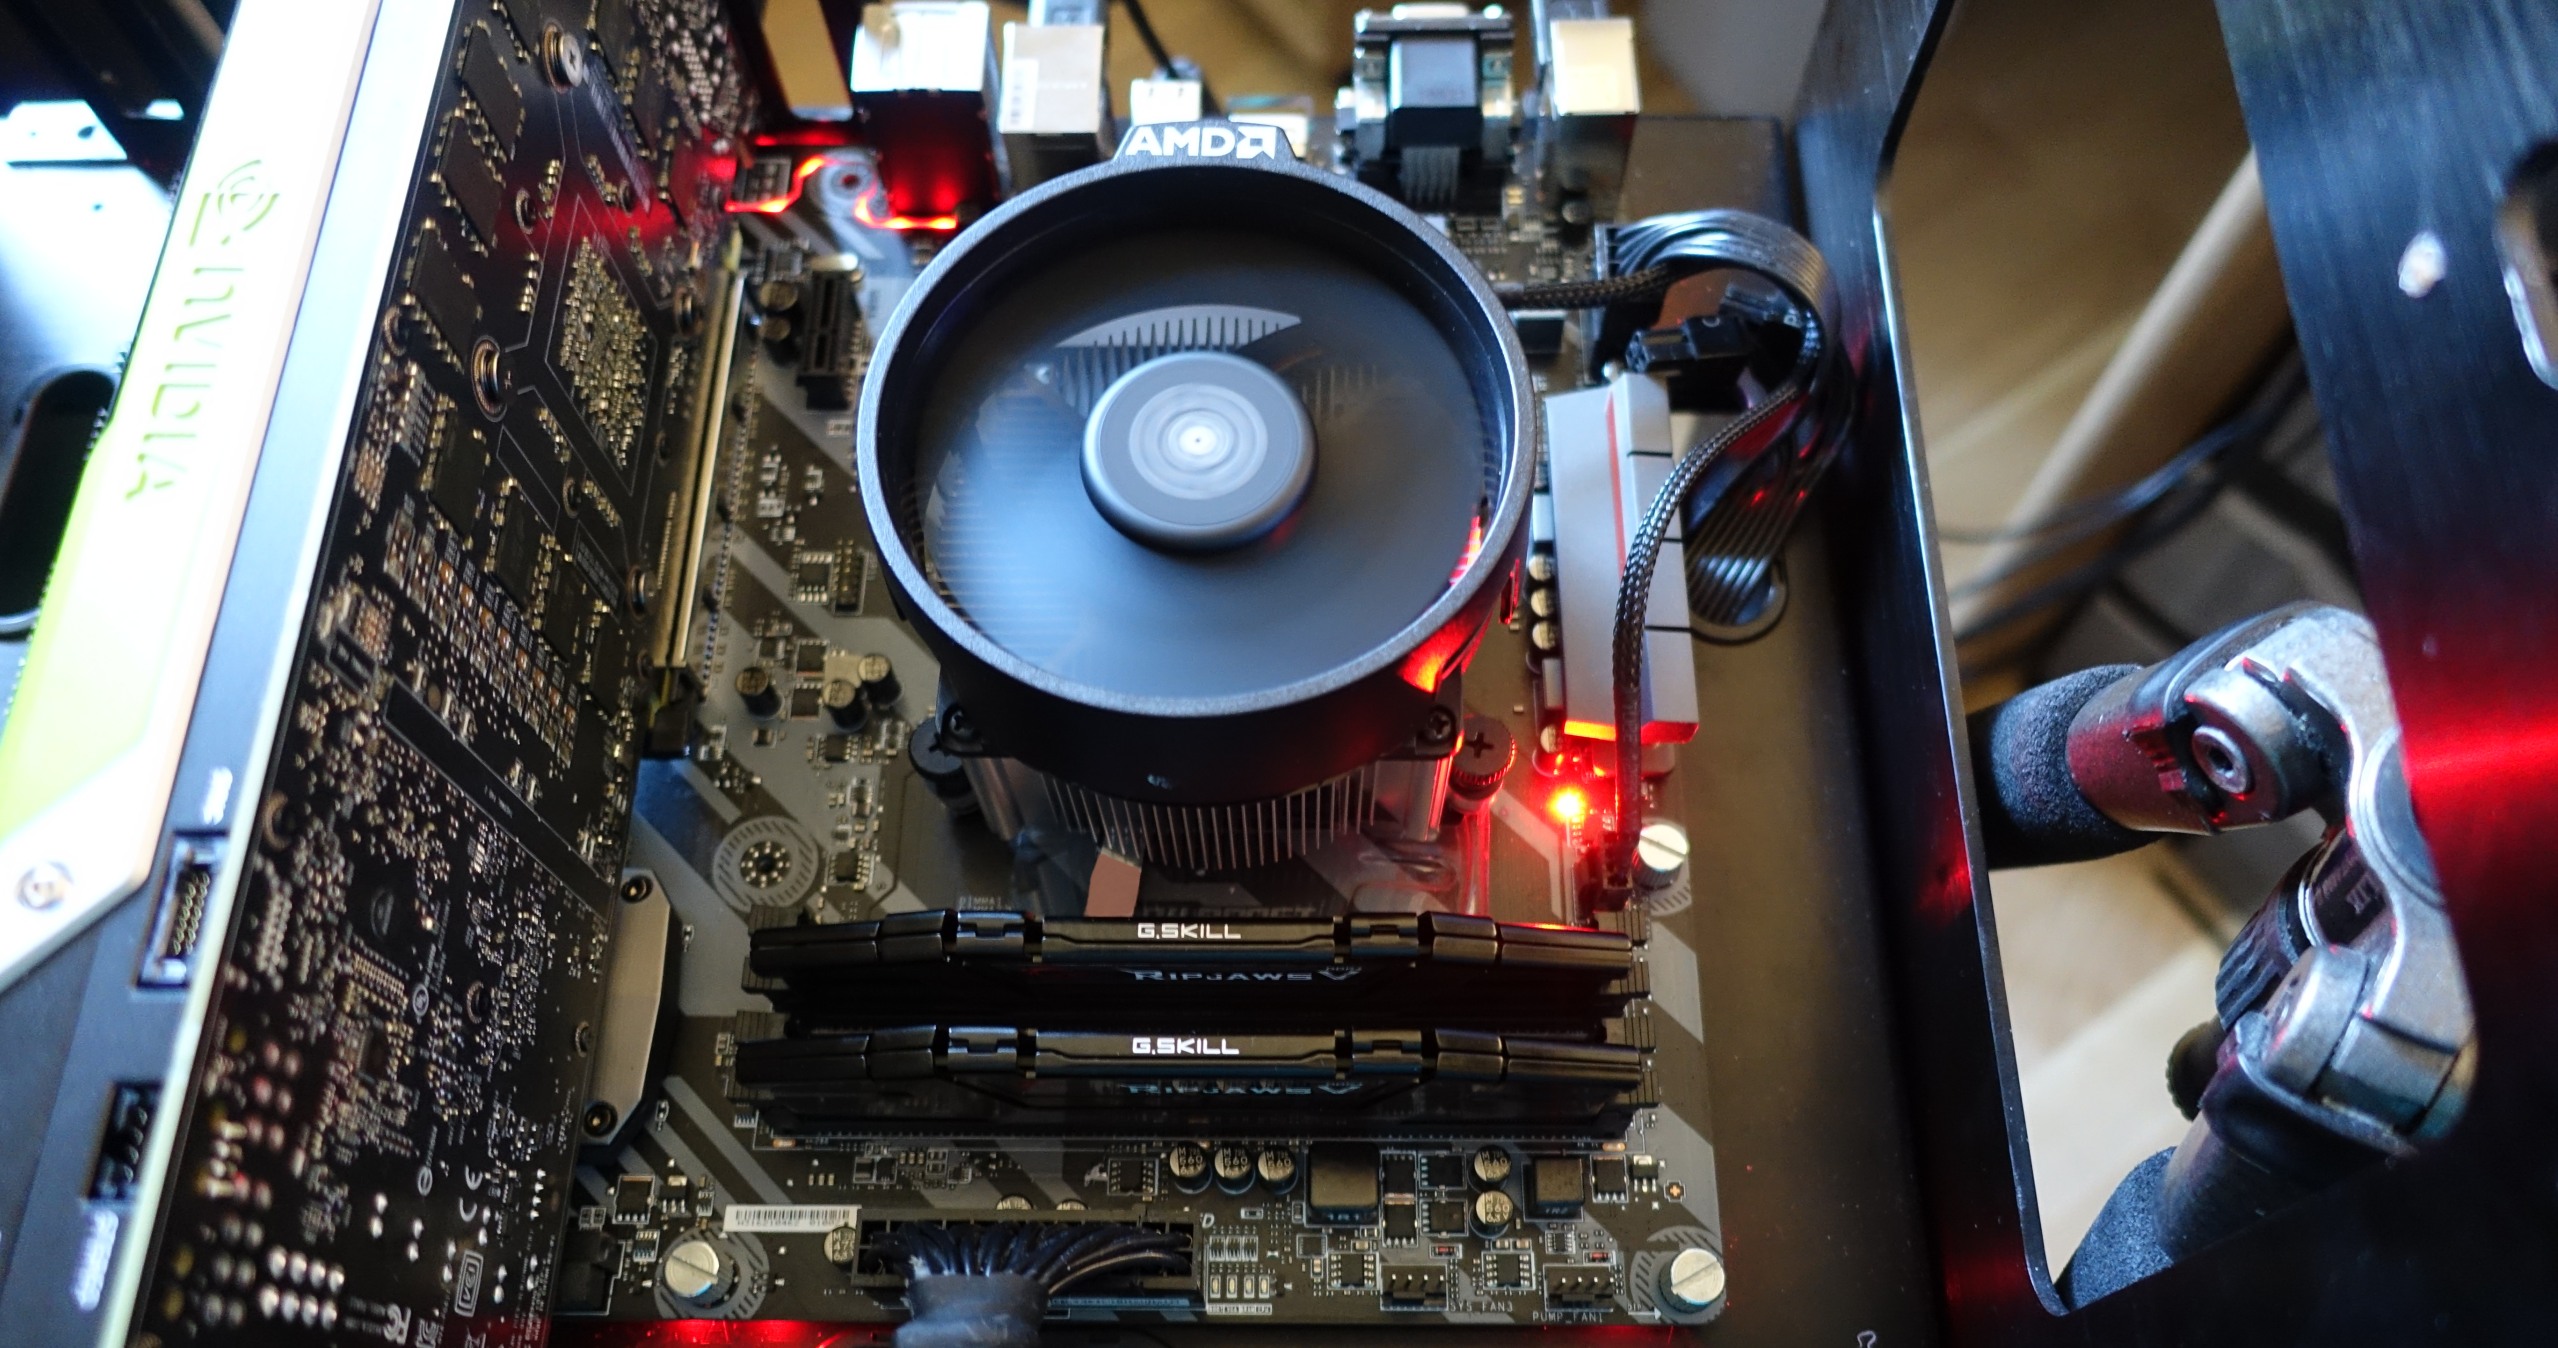
Nevertheless, we're accepting it as reality and going all-out on cooling for Ryzen 5's introduction. Alphacool offers a modified version of an industrial compression cooler under the name "Eiszeit 2000 Chiller." It has a powerful pump, and it’s compatible with the usual 1/4" connectors, thus making the technology accessible to enthusiasts like us.
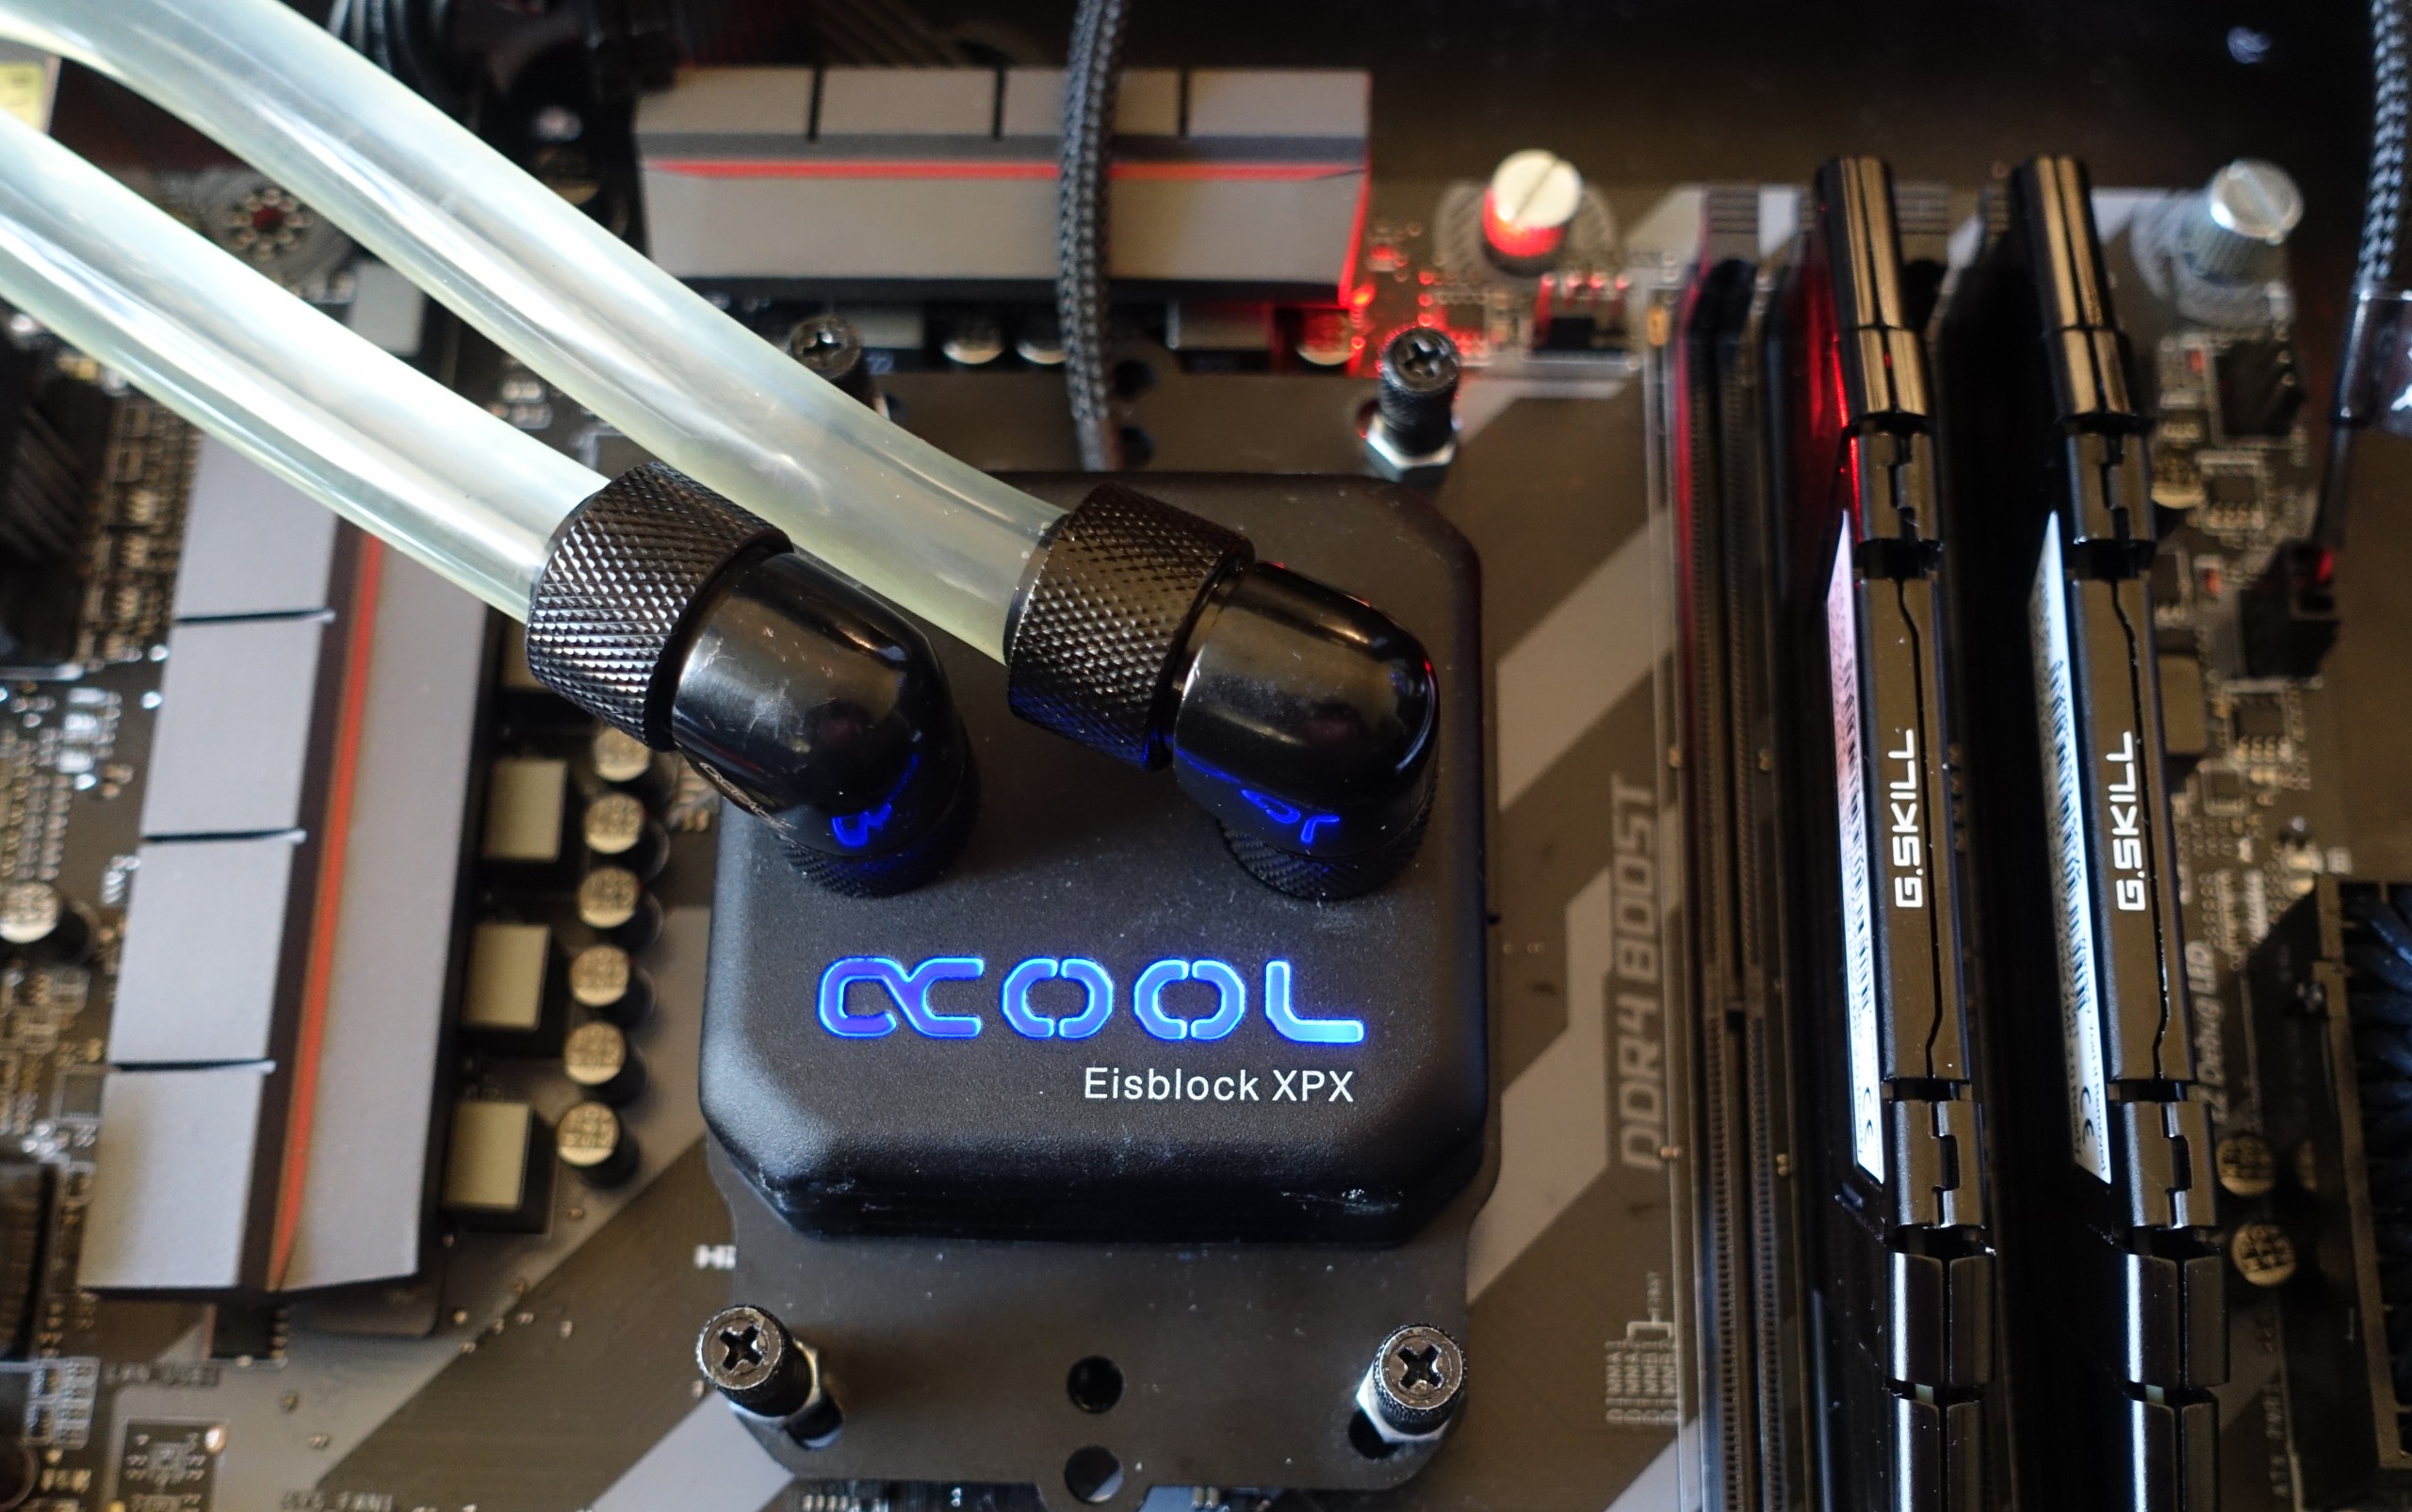
We’re cooling the processors by connecting an Alphacool Eiszeit XPX CPU block directly to the Eiszeit 2000 Chiller. The compression cooler’s reservoir has a capacity of almost eight liters, serving double duty as a storage tank and compensating reservoir. This provides a large thermal buffer. At 40L per minute, the flow rate is high enough for our purposes as well.
One of the Eiszeit 2000 Chiller’s standout features is its programmable temperature controller, which can keep the cooling fluid’s temperature very close to a level set by the user. We chose 20°C, which the Eiszeit 2000 Chiller handled without any problems, in spite of it being below the ambient temperature.
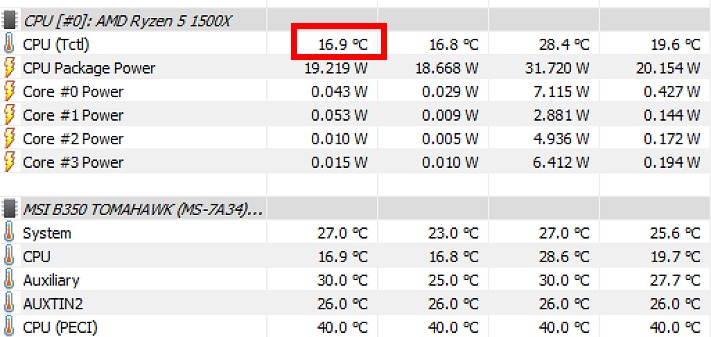
At first, we just wanted to see if we could explore how AMD's XFR feature behaved under perfect conditions, and how leakage current would compare to measurements taken with other cooling solutions. However, the first test run delivered a huge surprise:
At just under 17°C, the Ryzen 5 1500X’s reported Tctl temperature values at 19W total power consumption of the CPU package come in a full 3°C below the cooling fluid’s temperature of a constant 20°C!
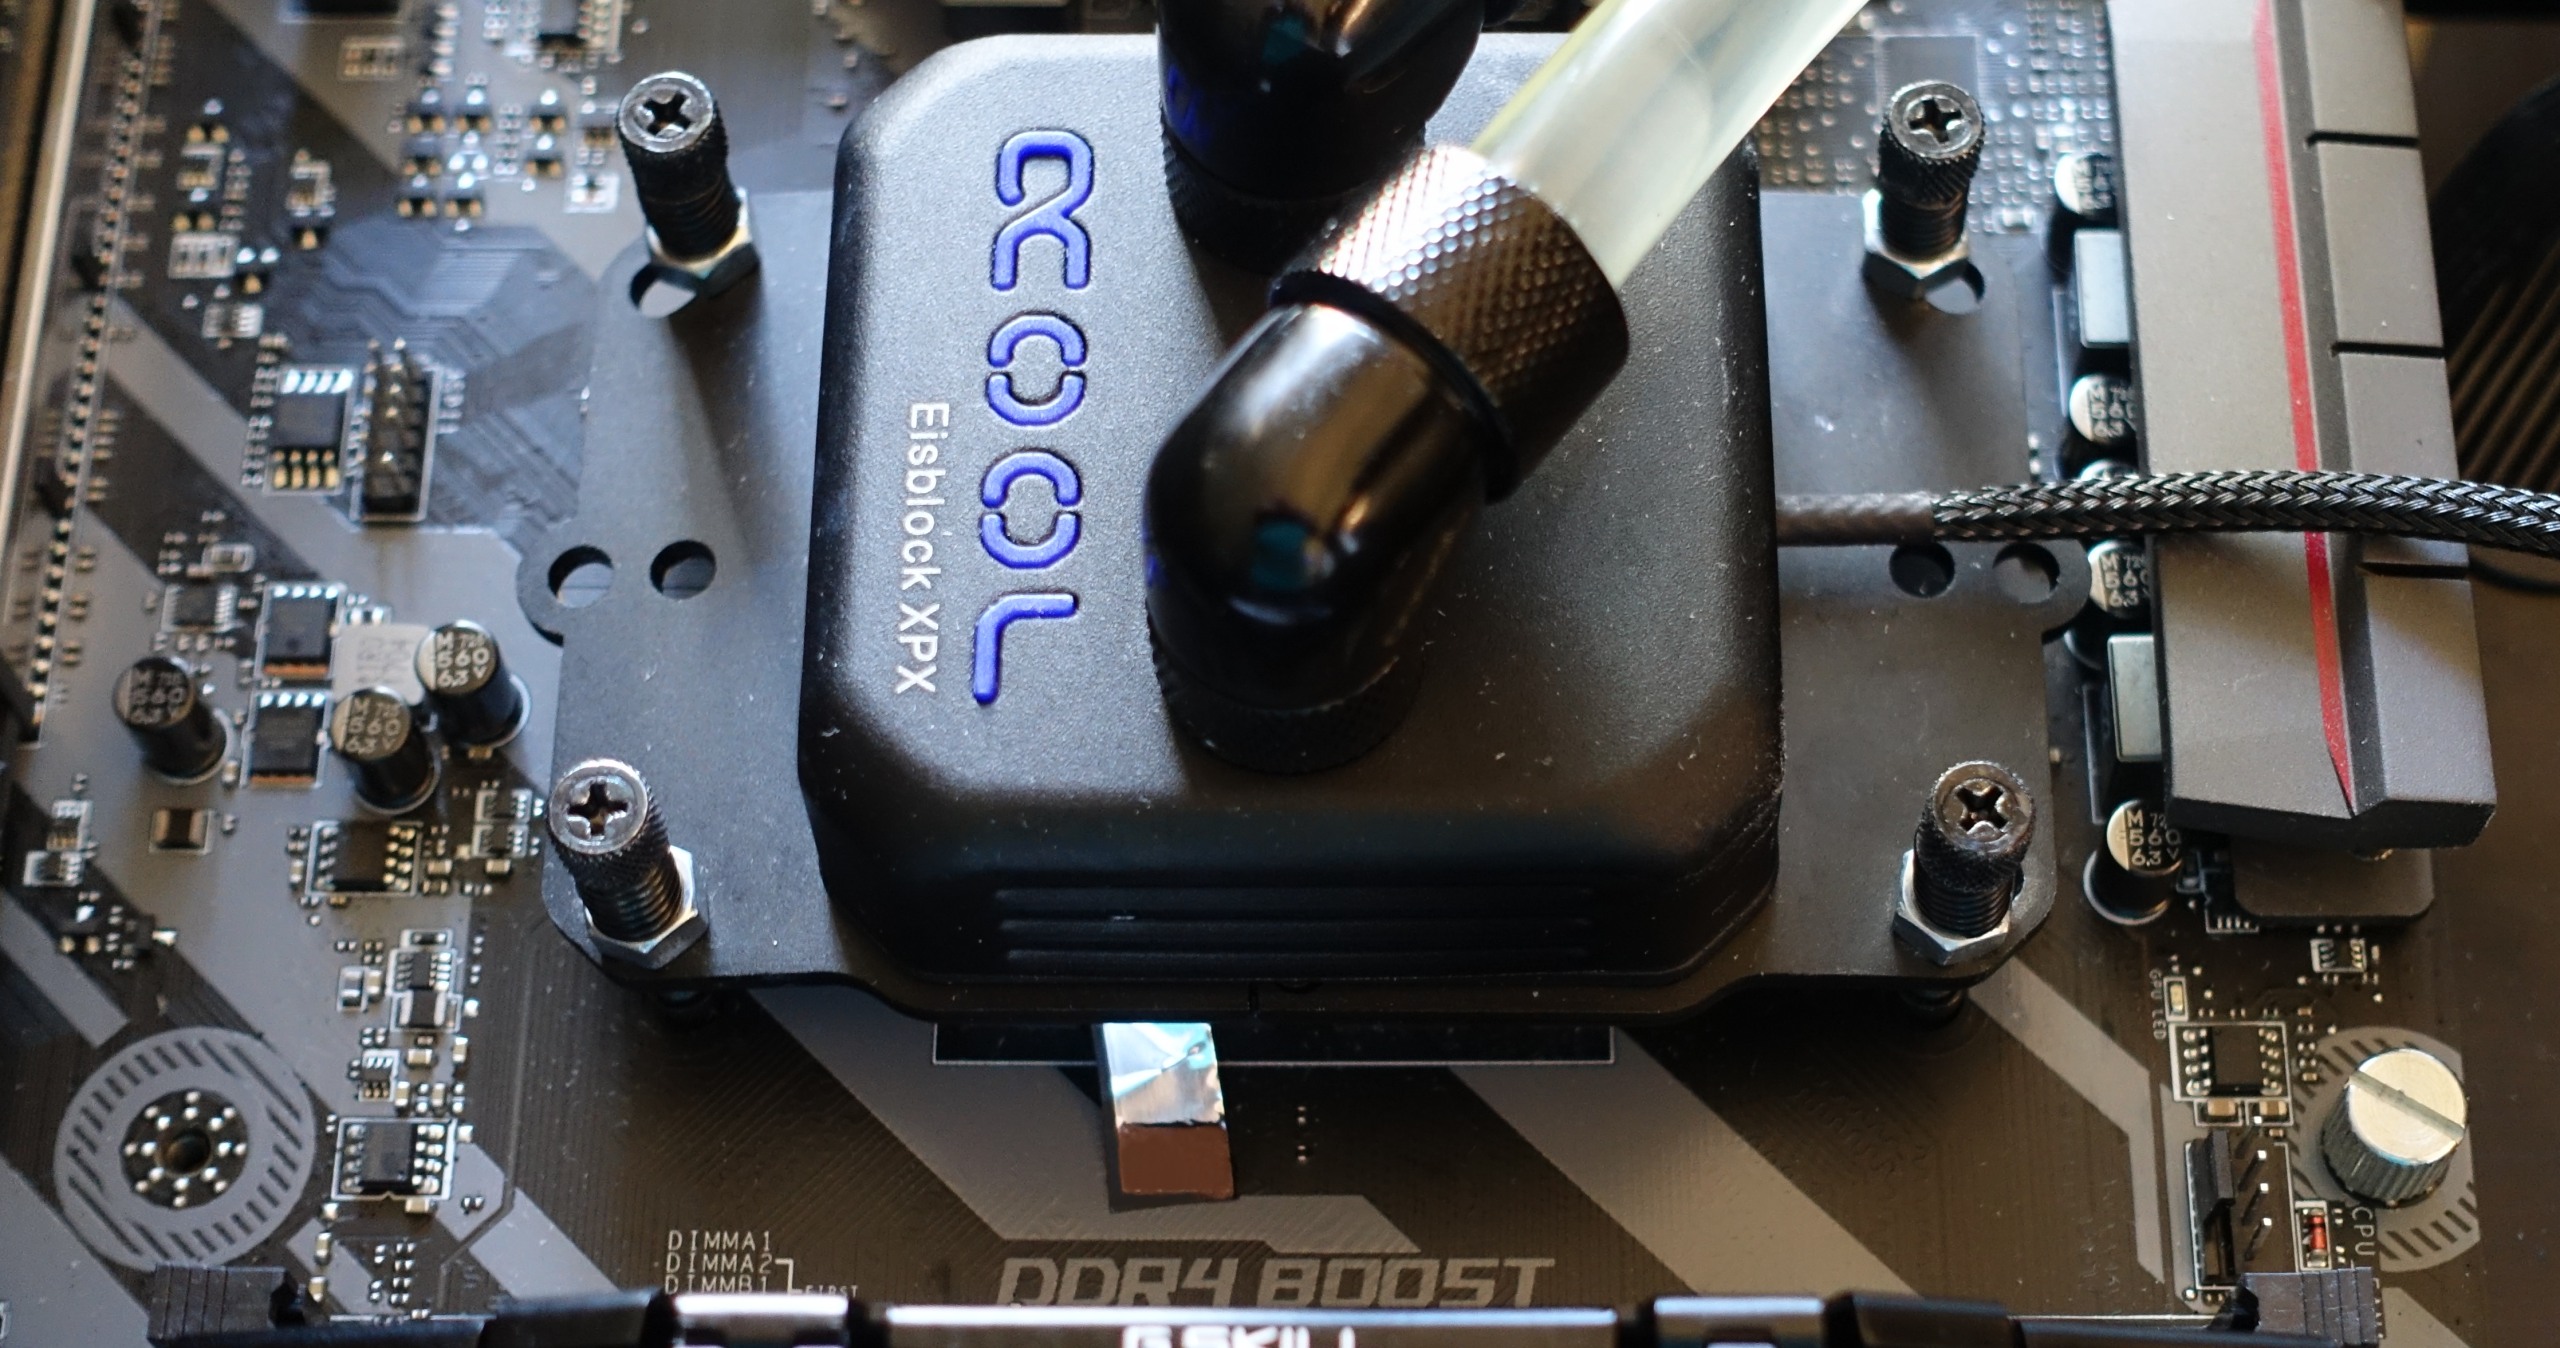
We don’t really need to explain why these results can’t be correct. Consequently, we dug deep into our toolbox and found a liquid metal pad that was originally developed as a substitute for thermal paste. Our potent cooler kept the temperatures well below the pad’s melting point, so that it didn’t fuse with the processor’s heat spreader or the water block’s heat sink. We placed a thin strip between the heat spreader and the heat sink during our water-cooled measurements, making sure to cut the strip thin enough for it not to result in a measurable change in cooling performance. We used a tiny copper plate milled into a very thin strip for the stock cooler measurements.
Get Tom's Hardware's best news and in-depth reviews, straight to your inbox.
The plan was simple: find the exact difference between the temperatures reported by the processor and the temperatures we measured for the processor’s heat spreader with the help of our constant cooling fluid temperature setup and infrared camera. Unfortunately, we found that the resulting differences between the temperature curves weren’t consistent and, consequently, still didn’t make any sense. There were two points at which the temperature curves changed drastically and clearly diverged from a linear pattern.
Based on these findings, we hypothesized that the behavior of the processors’ temperature sensors changed once certain temperature thresholds were reached. If this was the case, we could predict the sensors’ behavior for different temperature ranges and correct the temperature readings.
Temperature vs. Power Consumption
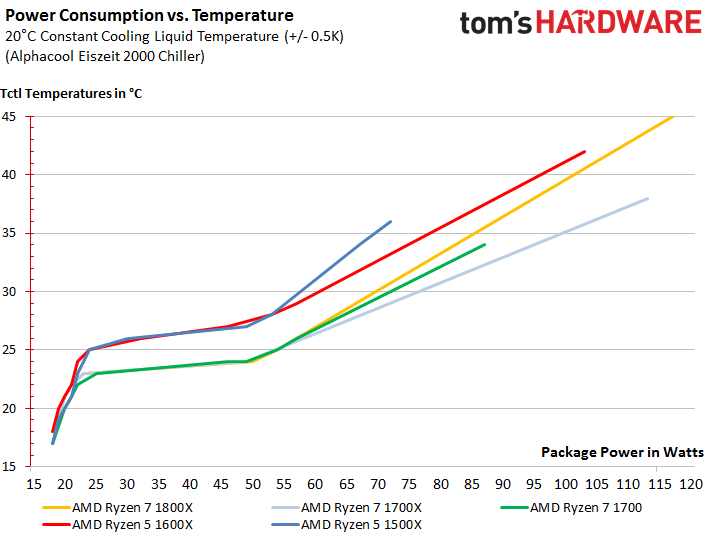
For our second round of testing, we compared the Tctl values to actual power consumption. A software tool developed in-house allowed us to generate different loads over long time periods, avoiding any jumps or delays that could skew the results. The tool would do its best to spread the loads equally across all possible threads. The results proved our previous hypothesis:
The reported temperatures are complete nonsense below ~20 to 25W. It’s also plain to see that there are significant differences between the Tctl reporting patterns of AMD’s Ryzen 5 and 7.
In general, we saw that upwards of 20 to 22W, there was a difference of approximately 4 to 6°C between AMD’s Ryzen 5 and 7 when using our cooling solution with its constant fluid temperature. The Ryzen 5 processors’ sensors consistently displayed higher temperature readings than the Ryzen 7 processors at the same power consumption level!The additional 20°C that AMD builds into some of its Ryzen processor models are already taken into account in this calculation.
One more thing to consider is the potential difference in heat transfer between components for our particular cooling solution. Plugging in numbers based on our experience and then comparing the final figures to our infrared measurements yields the following results for the three wattage ranges:
| Package Power Consumption | Temperature DifferenceRyzen 7 | Temperature DifferenceRyzen 5 |
|---|---|---|
| 18 to app. 25W | 12 to 10°C (Falling) | 8 to 6°C (Falling) |
| App. 25 to 50W | 10 to 8°C (Falling) | 6 to 4°C (Falling) |
| 50W to Pmax | 8 to 4°C (Falling) | 4 to 0°C (Falling) |
Across the entire wattage range, the Ryzen 5 produces a difference of approximately 8°C. That's pretty significant. We ran several control tests and got the same results every time.
Which One’s Right: Ryzen 5 or Ryzen 7?
The next question is whether Ryzen 5's temperature displays too high, or if Ryzen 7 is too low by 4 to 6°C.
The following graph shows the CPU heat spreader’s temperatures over a time period of approximately 30 minutes in degrees Celsius. The Ryzen 7 1800X’s leakage current is approximately 58 to 60W. Comparing that to the curve in the graph above shows that Tctl and heat spreader temperatures should not be the same. The expected difference of approximately 3 to 5°C between the Tctl and heat spreader temperatures is reached by the Ryzen 5 1500X, though. These finding are consistent with what we thought.
The tentative bottom line seems to be that all Ryzen 7 processors report their temperatures as being approximately 4 to 6°C lower compared to the two Ryzen 5 processors at the same leakage current level.
Consequences for Air Cooling
The bend in the curve at approximately 50W becomes more interesting once we get to the gaming power consumption results. The smaller CPUs may stay in this range during gaming, which means that it might be beneficial to take our results into account when setting fan curves. Most people don’t have a compression cooler at home, after all. The lower your cooling performance, the more important it is to change sensor characteristics!
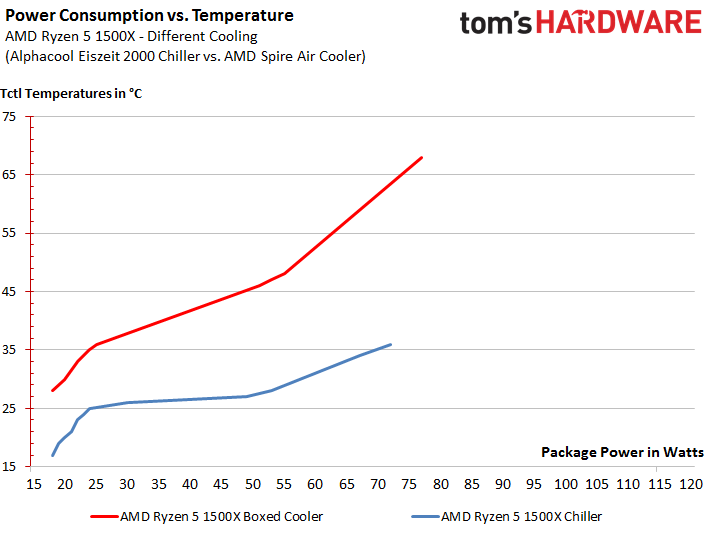
We measured the Ryzen 5 1500X with AMD's stock air cooler to illustrate our point further. Its fan was set to a fixed speed we chose after first running a stress test. The curve's two bends are easy to see in spite of the curves being much steeper. A closer look shows that the total power consumption increased by approximately 5W. This is due to increased leakage currents that accompany the much higher temperatures.
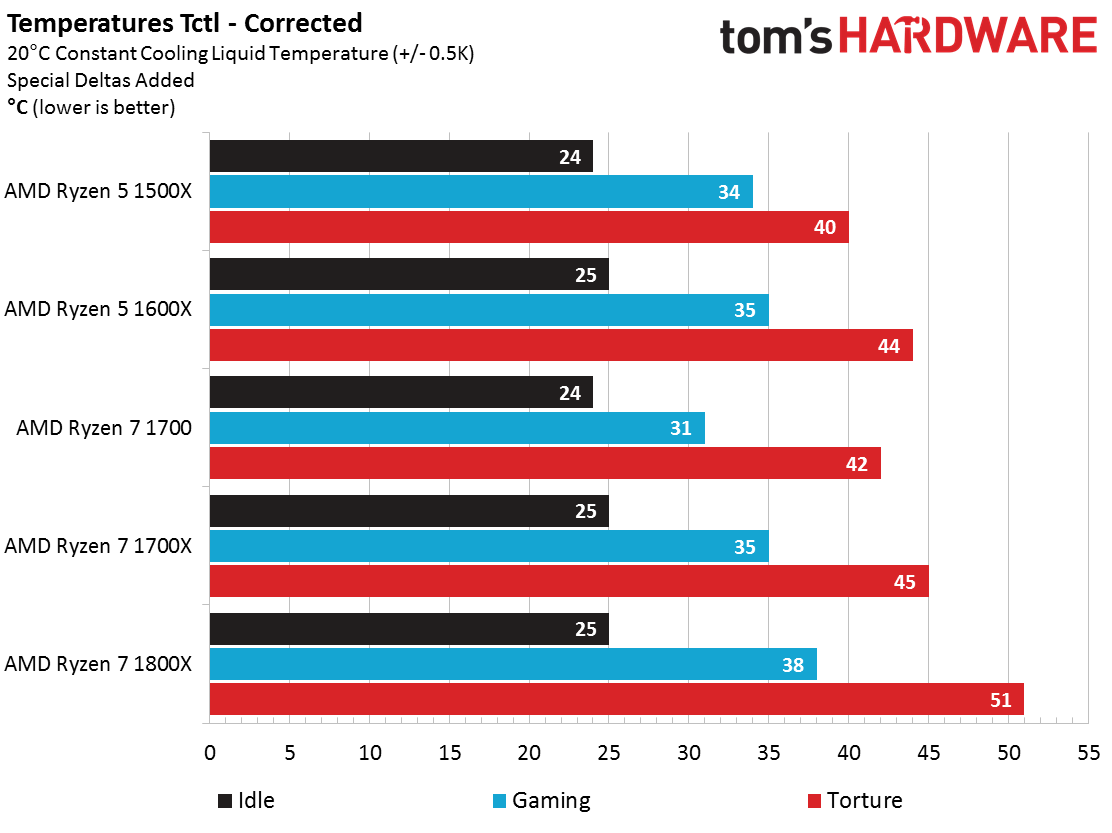
We stay with the temperature results a little while longer and take a look at all of the Ryzen processors’ temperatures. These are corrected for the temperature differences due to the three wattage ranges and the two processor lines.
Here’s a computational example for the Ryzen 7 1800X during the stress test:
67°C (Tctl, Sensor) - 20°C (AMD Ryzen Offset) + 4°C (Additional Offset for Ryzen 7) = 51°C
If you feel confused by all of this, then you’re certainly in good company. Nobody knows what prompted AMD to take the approach it did. If we didn’t use our offsets, then Ryzen 7 would be much cooler than Ryzen 5 at the same level of leakage current, which is physically impossible.
Before we close, we’d like to point out one more time that the temperature differences and offsets only apply to our particular test setup. Different hardware may very well affect behave some other way. The general principle shouldn’t change, though. A final judgement can’t be reached before these – admittedly elaborate – measurements have been repeated with a wide variety of setups.
Doing this just wasn’t possible under the time constraints of a product launch. The measurements took us three days for just the one setup.
MORE: Best CPUs
MORE: Intel & AMD Processor Hierarchy
MORE: All CPU Content
Current page: Temperatures And Many Questions
Prev Page Project CARS, Rise of the Tomb Raider, The Division Next Page Power Consumption Results
Paul Alcorn is the Editor-in-Chief for Tom's Hardware US. He also writes news and reviews on CPUs, storage, and enterprise hardware.
-
ninja_warrior If you can reliably overclock any of the ryzen 5/7 to 4.0, why would you get the 1600x over the 1700? Comparing a 1600x at 4.0 to a 1700 at 3.0 and then concluding that it's a better CPU when the 1700 can overclock exactly the same seems pretty stupidReply -
bloodroses A little disappointing for the Ryzen 5's imo. You'd think with the reduced core count you'd get better frequencies (and OC'ing) than what you get with the Ryzen 7.Reply
I honestly don't see a reason why to get a Ryzen 5 at this point since the i5 is definitely better for gaming and the Ryzen 7 is better for workstation use. The price alone takes it out of its own market. -
tamban A CPU review with only gaming benchmarks? Tom's hardware really likes Intel's hardware.Reply -
FormatC Reply
Try page 10 :P19547998 said:A CPU review with only gaming benchmarks? Tom's hardware really likes Intel's hardware.
31(!) Workstation benchmarks. Too less?
-
Oranthal How about a real world test where you play a game and run a 1080p stream then compare performance? How about 1440p? How about broadening the scope of testing? Nah just ignore the strength of more cores and focus on single thread work and a few games.Reply -
irish_adam you say that the i5 7600k comes out on top at stock but just on the gaming benchmarks i make it 4-4 with 2 draws. I wouldnt say that it came out on top at all. I would say they are pretty evenly matched at the moment. Also apart from the odd couple from both sides their frame difference was less than 10, at over 100FPS i'd pay good money that no one would be able to distinguish a difference between either system.Reply -
elbert Great review Paul and Igor. Best review I have seen given its the only review with 2 intel cpu's in the price range of Ryzen 5. The RAM info is great which shows that Ryzen gains a real 9ns latency advantage using higher clocked RAM on the Ryzen 5. Given the Ryzen 7 has less cache per core I would expect that gain to be higher.Reply
An issue that does stick out here is high price of the overclocking solution. How does the 7600k fair with a stock intel heatsink compared to the 1600x wraith spiral best overclocks? I think Ryzen has a real price advantage given the cooler required for a reasonable overclock.
Also how does the 7600K compare in games while twitch streaming against the 1600X? -
dstarr3 Reply19548037 said:How about a real world test where you play a game and run a 1080p stream then compare performance? How about 1440p? How about broadening the scope of testing? Nah just ignore the strength of more cores and focus on single thread work and a few games.
Maybe that's your real-world test, but that isn't mine. And am I the only one that can see the workstation benchmarks on page 10? Everyone seems to be ignoring them and then complaining that they aren't there.
