SanDisk X210 256 And 512 GB: Enthusiast Speed; OEM Reliability
SanDisk's X210 SSD is both an OEM drive for major vendors and an aftermarket product for the enthusiast world. Having passed a gauntlet of validation tests, can it break into the consumer space as a true alternative to the quickest power user products?
Results: Write Saturation And Over-Provisioning Tests
Random Performance Over Time
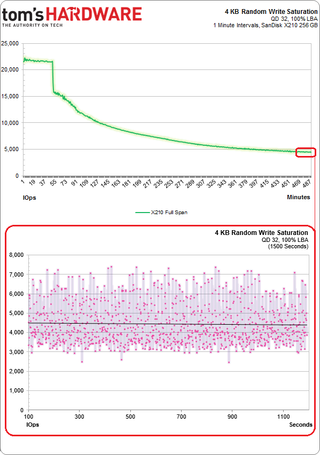
A saturation test consists of writing to a drive for a specific duration with a defined workload. Technically, this is an enterprise-class write saturation test, where the entire LBA space of the SSD is utilized by a random write at high queue depths.

This is 500 minutes worth of one-minute averages, with a 20 minute breakout on a per-second basis. Again, this sort of arbitrary workload on a fresh drive results in a peak of just 22,000 IOPS (though few random workloads will continuously pepper the entire LBA space with random writes at a queue depth of 32). In this test specifically, SanDisk's clever nCache technology imparts lower performance. In most of the workloads the X210 will be exposed to, nCache should do the opposite, speeding up benchmarks instead of the other way around.
As far as the raw data goes, our 20-minute slice of steady-state performance breaks down fairly well considering the X210 has just 7% spare area to rely on. It averages 4445 IOPS, showing a minimum of 2472 IOPS and a maximum of 7384. That's not bad. But we want to know more. Perhaps a quick look at various levels of over-provisioning will tell us something.
Over-Provisioning
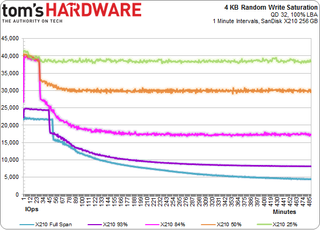
We can't truly over-provision a drive in the lab. There are numerous ways to trade capacity for better performance; we could convince the OS that our drive has fewer logical block addresses for example, but the SSD knows otherwise. Even so, certain workloads are much better off if we sacrifice a bit of capacity. That leaves more room for the drive to perform background processes (like garbage collection), and the results can be profound, even if the controller still has to map the existing space. If we start with the number of bytes available to the user (256,052,966,400 in this case), we can run the write saturation test again. Each successive time (after a secure erase), the amount of accessible space is reduced.
The following chart shows five separate points: the full span (as above), 93%, 84%, 50%, and 25%.

There is a near-doubling of performance when we sacrifice an additional 7% of the addressable LBA space. The next step up, leaving 84% of the drive's capacity, allows the X210 to sustain almost 17,000 IOPS. To multiply that number, you need to give up 50% of the 256 GB SSD's space, a hefty price to pay, for sure.

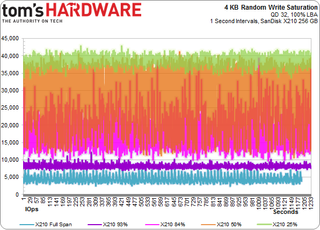
Lastly, this is a 20 minute breakdown of the same over-provisioning experiment taken from the end of the multi-hour plot and displayed in one-second increments. As you can see, the spread between minimum, maximum, and average IOPS can get pretty massive.
Stay On the Cutting Edge: Get the Tom's Hardware Newsletter
Join the experts who read Tom's Hardware for the inside track on enthusiast PC tech news — and have for over 25 years. We'll send breaking news and in-depth reviews of CPUs, GPUs, AI, maker hardware and more straight to your inbox.
Current page: Results: Write Saturation And Over-Provisioning Tests
Prev Page Results: Performance Vs. Capacity Next Page Results: Tom's Hardware Storage Bench-
TeraMedia Is the warranty 5 years or 3? Last page says one thing, an early page says another.Decent review, decent drives. Has THG considered doing something similar to what the car mags do, where they take certain products and use them for a year? It would be great to capture that kind of longer-term info on certain types of products, especially the kind that wear out (ODDs, fans, cases, HDDs, SSDs, etc.).Reply -
Quarkzquarkz What about Samsung SSD pro 512GB? I bought 2 of these and on that chart is only 128 and 256GBReply -
vmem @vertexxthere isn't anything particularly exciting about Kaveri going by Anand's review. I shall want for the A10 version with higher clocksReply -
smeezekitty MLC with 5k write endurance!And affordable and fast?We may very well have a new solid contender in the SSD worldReply -
RedJaron I agree with Chris. I don't need the fastest bench speeds in a SSD. Most models now are very fast and the user won't see the performance difference. I want reliability and longevity. Looks like this is a smart choice for any new builder.Reply -
jake_westmorley Can we PLEASE have some normal graphs for once? The graph on page 5 in stupid 3D is so bad it's comical. The "perspective" effect completely screws with the data. This has zero added value and is almost as bad as still using clipart.Reply -
Duff165 I find it hard to believe that the author has had "literally dozens of SSd's die" on him over the years. This would suggest that many systems have contributed to the demise of many of the SSD's being used, which seems somewhat outlandish. Just the cost factor involved in the purchase of so many SSD's and then having over a dozen of them fail, supposedly also from various companies, since if they were all from the same company it would not really be conducive to good sales. One, or maybe two I could live with, but dozens? No.Reply
Most Popular


