SanDisk X210 256 And 512 GB: Enthusiast Speed; OEM Reliability
SanDisk's X210 SSD is both an OEM drive for major vendors and an aftermarket product for the enthusiast world. Having passed a gauntlet of validation tests, can it break into the consumer space as a true alternative to the quickest power user products?
Get Tom's Hardware's best news and in-depth reviews, straight to your inbox.
You are now subscribed
Your newsletter sign-up was successful
Results: Tom's Hardware Storage Bench
Storage Bench v1.0 (Background Info)
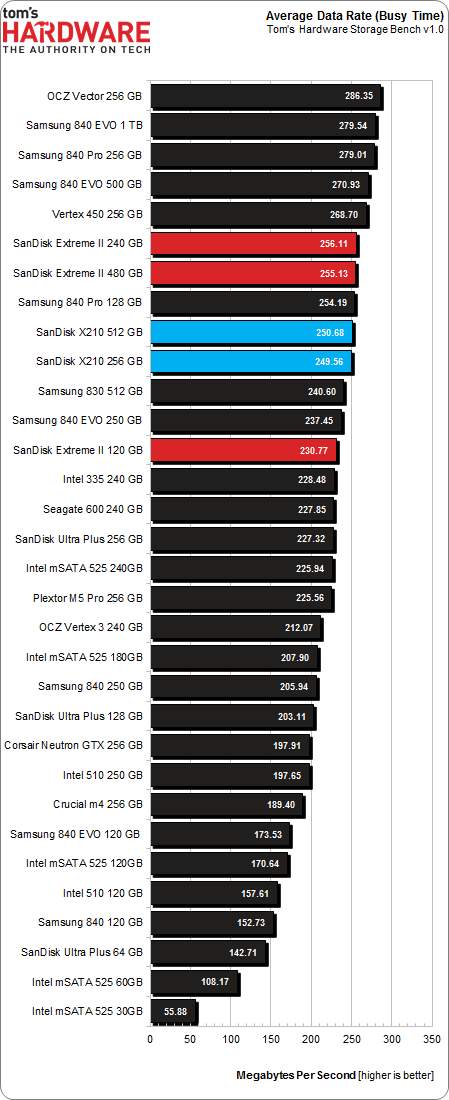
Our Storage Bench incorporates all of the I/O from a trace recorded over two weeks. The process of replaying this sequence to capture performance gives us a bunch of numbers that aren't really intuitive at first glance. Most idle time gets expunged, leaving only the time that each benchmarked drive was actually busy working on host commands. So, by taking the ratio of that busy time and the the amount of data exchanged during the trace, we arrive at an average data rate (in MB/s) metric we can use to compare drives.
It's not quite a perfect system. The original trace captures the TRIM command in transit, but since the trace is played on a drive without a file system, TRIM wouldn't work even if it were sent during the trace replay (which, sadly, it isn't). Still, trace testing is a great way to capture periods of actual storage activity, a great companion to synthetic testing like Iometer.
Incompressible Data and Storage Bench v1.0
Also worth noting is the fact that our trace testing pushes incompressible data through the system's buffers to the drive getting benchmarked. So, when the trace replay plays back write activity, it's writing largely incompressible data. If we run our storage bench on a SandForce-based SSD, we can monitor the SMART attributes for a bit more insight.
| Mushkin Chronos Deluxe 120 GBSMART Attributes | RAW Value Increase |
|---|---|
| #242 Host Reads (in GB) | 84 GB |
| #241 Host Writes (in GB) | 142 GB |
| #233 Compressed NAND Writes (in GB) | 149 GB |
Host reads are greatly outstripped by host writes to be sure. That's all baked into the trace. But with SandForce's inline deduplication/compression, you'd expect that the amount of information written to flash would be less than the host writes (unless the data is mostly incompressible, of course). For every 1 GB the host asked to be written, Mushkin's drive is forced to write 1.05 GB.
If our trace replay was just writing easy-to-compress zeros out of the buffer, we'd see writes to NAND as a fraction of host writes. This puts the tested drives on a more equal footing, regardless of the controller's ability to compress data on the fly.
Average Data Rate
Get Tom's Hardware's best news and in-depth reviews, straight to your inbox.
The Storage Bench trace generates more than 140 GB worth of writes during testing. Obviously, this tends to penalize drives smaller than 180 GB and reward those with more than 256 GB of capacity.
I haven't included the 120 GB SanDisk Extreme II in many of the highlighted charts, but the drive might be instructive here. Why do SanDisk's Extreme II and X210s at similar capacity points fall behind by such a small, even margin? Is it the lower 4 KB random performance at higher queue depths? Is it the Extreme II's additional over-provisioning? I suspect the former more than the latter, though that's honestly speculation on my part. It's clear that this trace doesn't generate enough writes to dramatically slow SSDs larger than 180 GB, so the fact that one drive has more over-provisioning probably won't help much in terms of average throughput.
Current page: Results: Tom's Hardware Storage Bench
Prev Page Results: Write Saturation And Over-Provisioning Tests Next Page Results: Tom's Hardware Storage Bench, Continued-
TeraMedia Is the warranty 5 years or 3? Last page says one thing, an early page says another.Decent review, decent drives. Has THG considered doing something similar to what the car mags do, where they take certain products and use them for a year? It would be great to capture that kind of longer-term info on certain types of products, especially the kind that wear out (ODDs, fans, cases, HDDs, SSDs, etc.).Reply -
Quarkzquarkz What about Samsung SSD pro 512GB? I bought 2 of these and on that chart is only 128 and 256GBReply -
vmem @vertexxthere isn't anything particularly exciting about Kaveri going by Anand's review. I shall want for the A10 version with higher clocksReply -
smeezekitty MLC with 5k write endurance!And affordable and fast?We may very well have a new solid contender in the SSD worldReply -
RedJaron I agree with Chris. I don't need the fastest bench speeds in a SSD. Most models now are very fast and the user won't see the performance difference. I want reliability and longevity. Looks like this is a smart choice for any new builder.Reply -
jake_westmorley Can we PLEASE have some normal graphs for once? The graph on page 5 in stupid 3D is so bad it's comical. The "perspective" effect completely screws with the data. This has zero added value and is almost as bad as still using clipart.Reply -
Duff165 I find it hard to believe that the author has had "literally dozens of SSd's die" on him over the years. This would suggest that many systems have contributed to the demise of many of the SSD's being used, which seems somewhat outlandish. Just the cost factor involved in the purchase of so many SSD's and then having over a dozen of them fail, supposedly also from various companies, since if they were all from the same company it would not really be conducive to good sales. One, or maybe two I could live with, but dozens? No.Reply
