Battle of the X670E Flagships: Testing MSI, Asus and Gigabyte’s Best
Three flagship-class X670E boards go head to head to see who reigns supreme!
Get Tom's Hardware's best news and in-depth reviews, straight to your inbox.
You are now subscribed
Your newsletter sign-up was successful
Test System / Comparison Products
We’ve updated our test system to Windows 11 64-bit OS with all updates applied. We kept the same Asus TUF RTX 3070 video card from our previous testing platforms but updated the driver. We also updated to F1 22 for our games and kept Far Cry 6. Unless otherwise noted, we use the latest non-beta motherboard BIOS available to the public. The hardware we used is as follows:
Test System Components
| CPU | Intel Core i9-13900K |
| Memory | Kingston Fury Beast DDR5-6000 CL36 (KF560C36BBEAK2-32) |
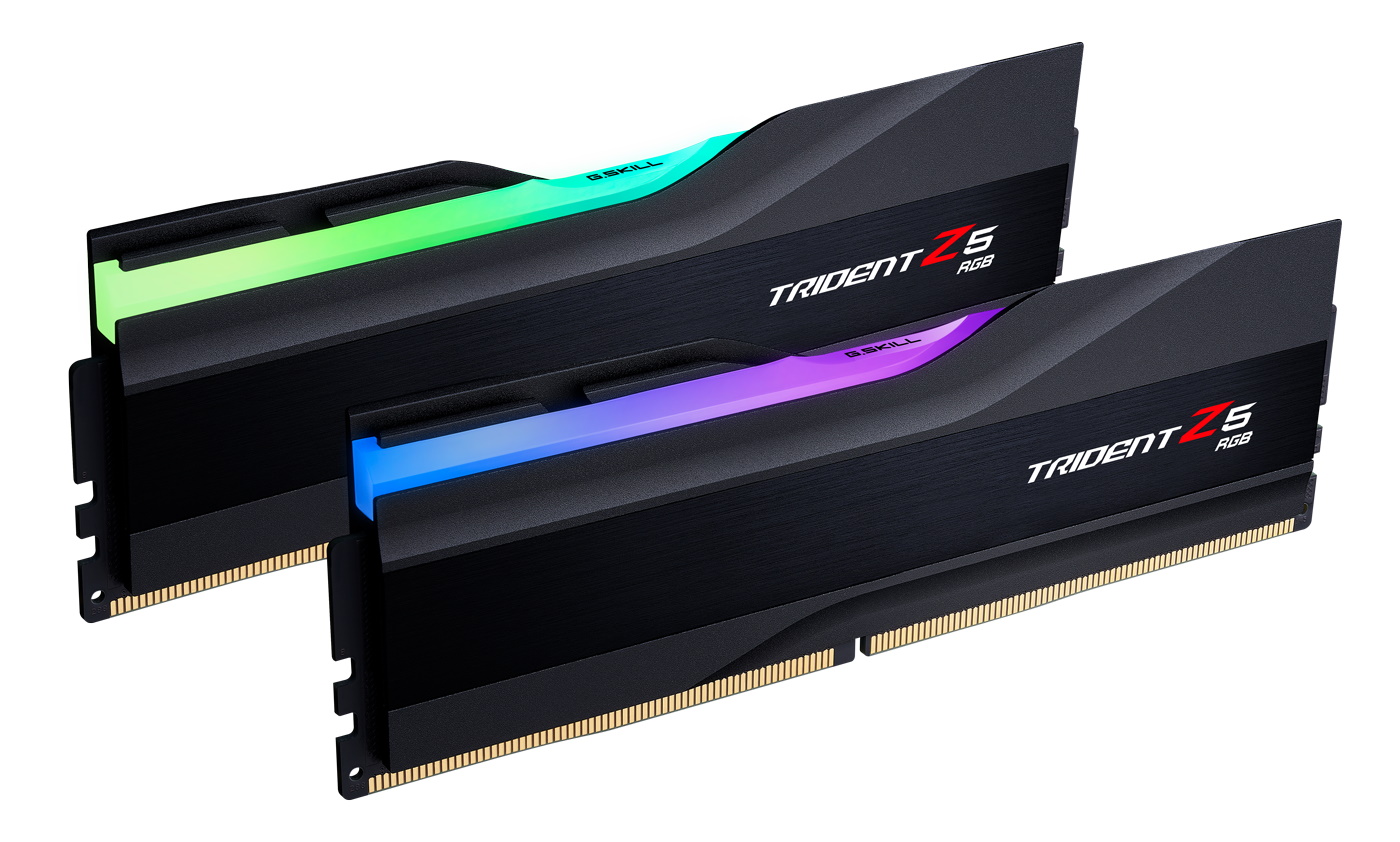
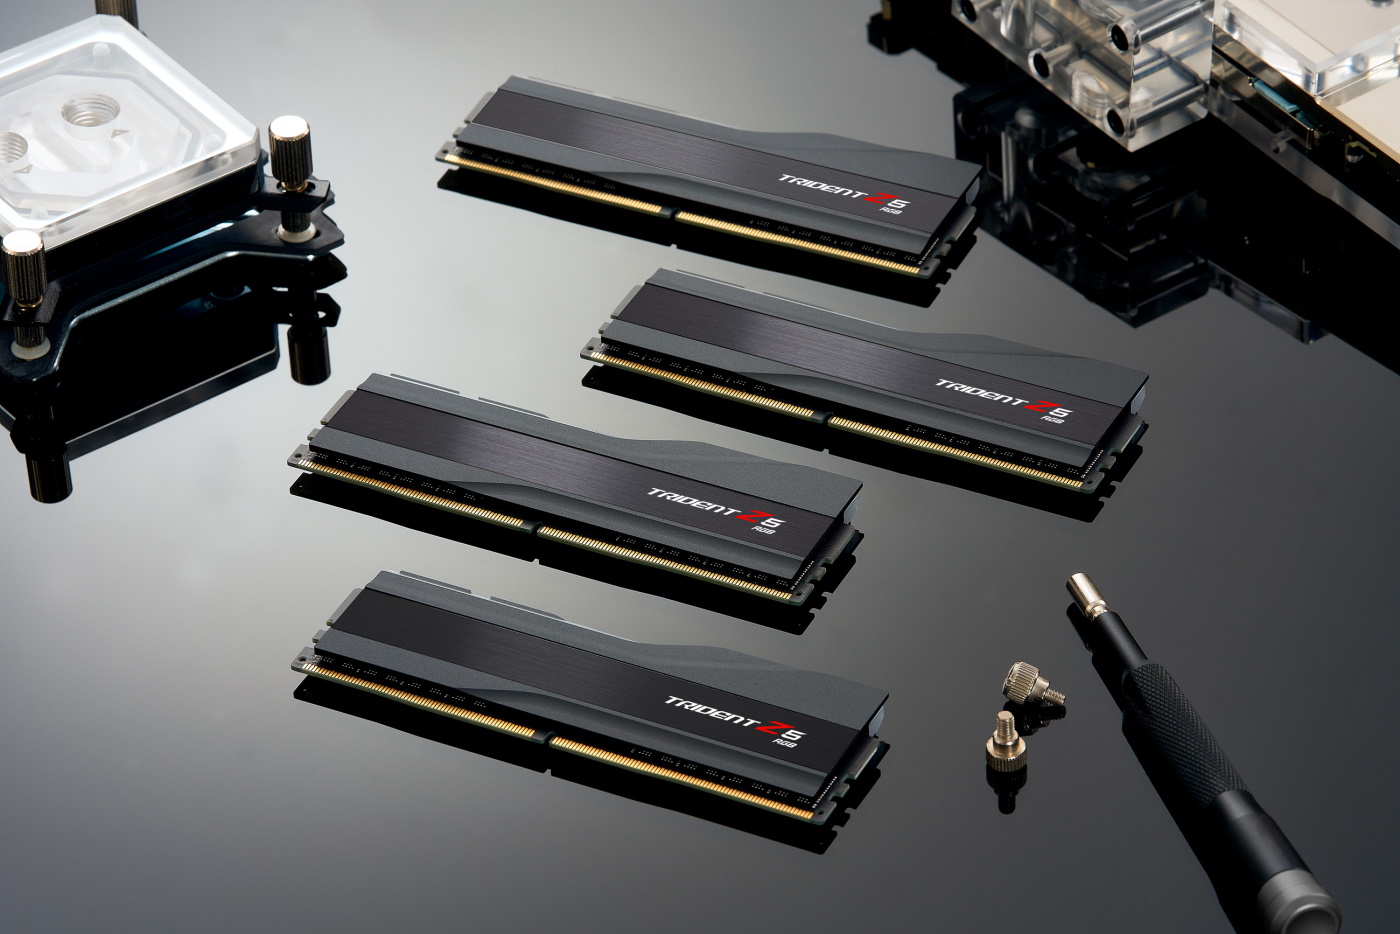
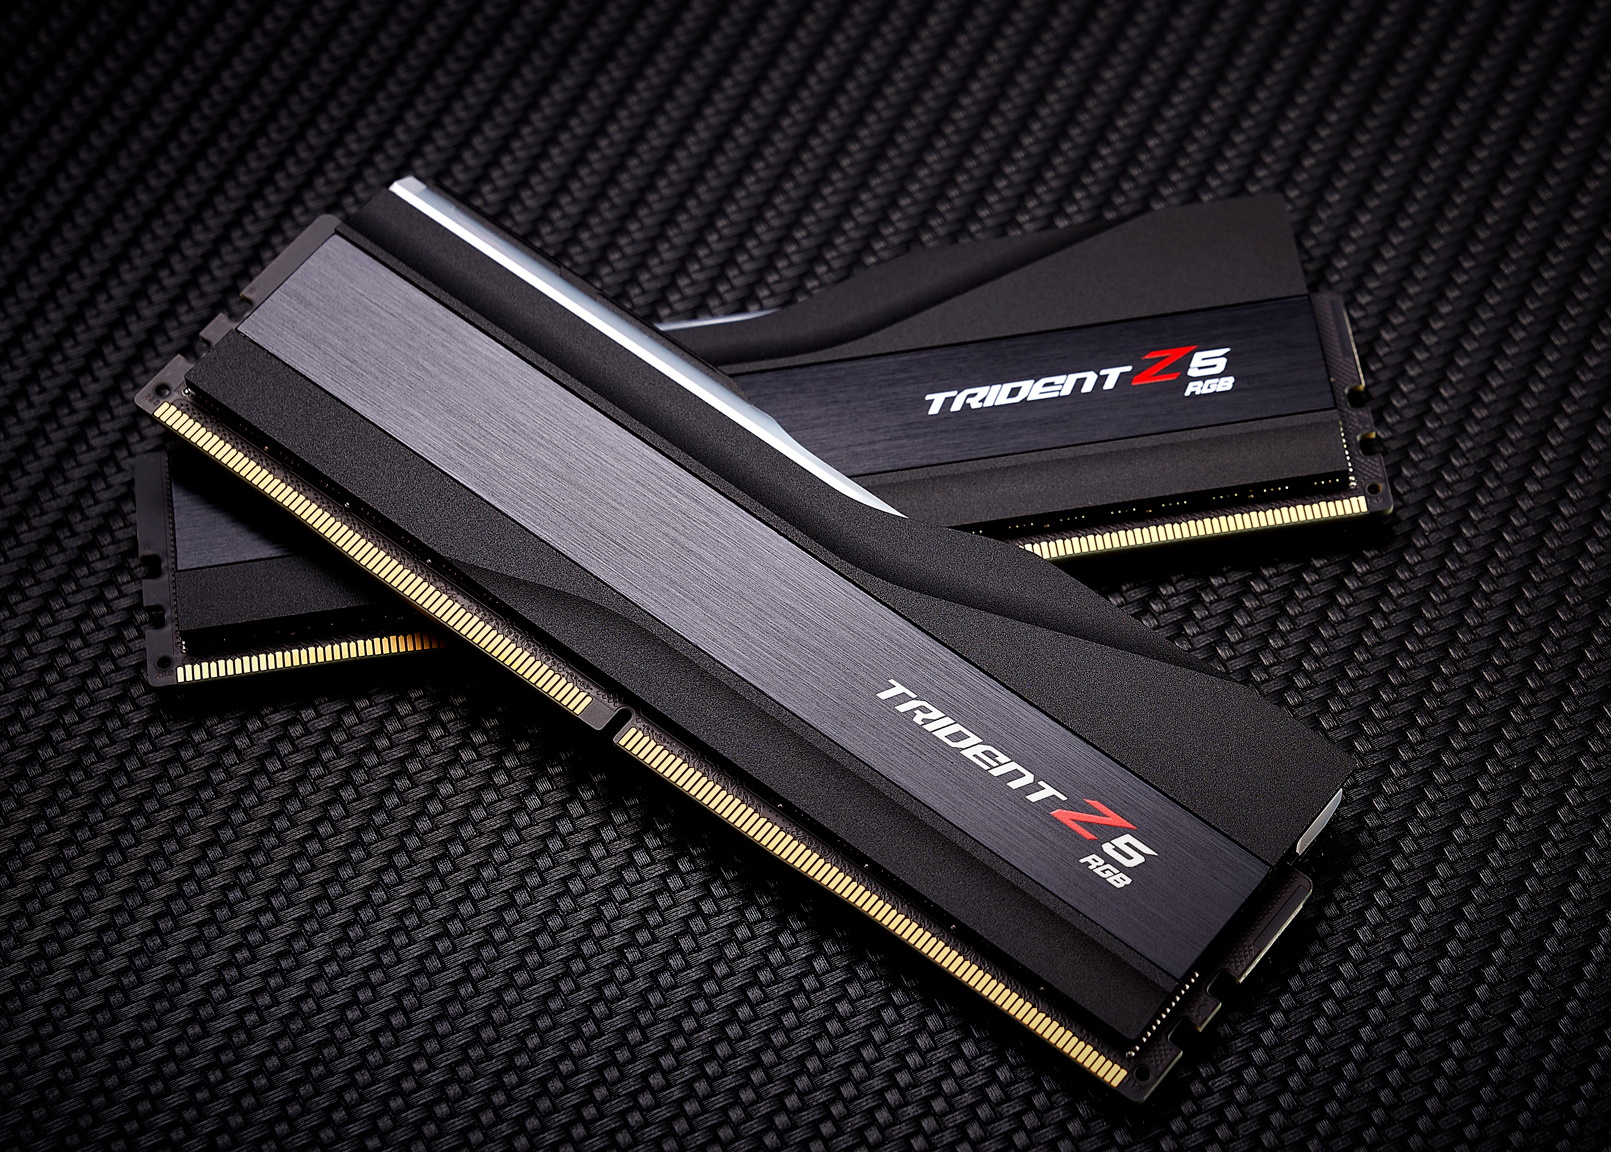
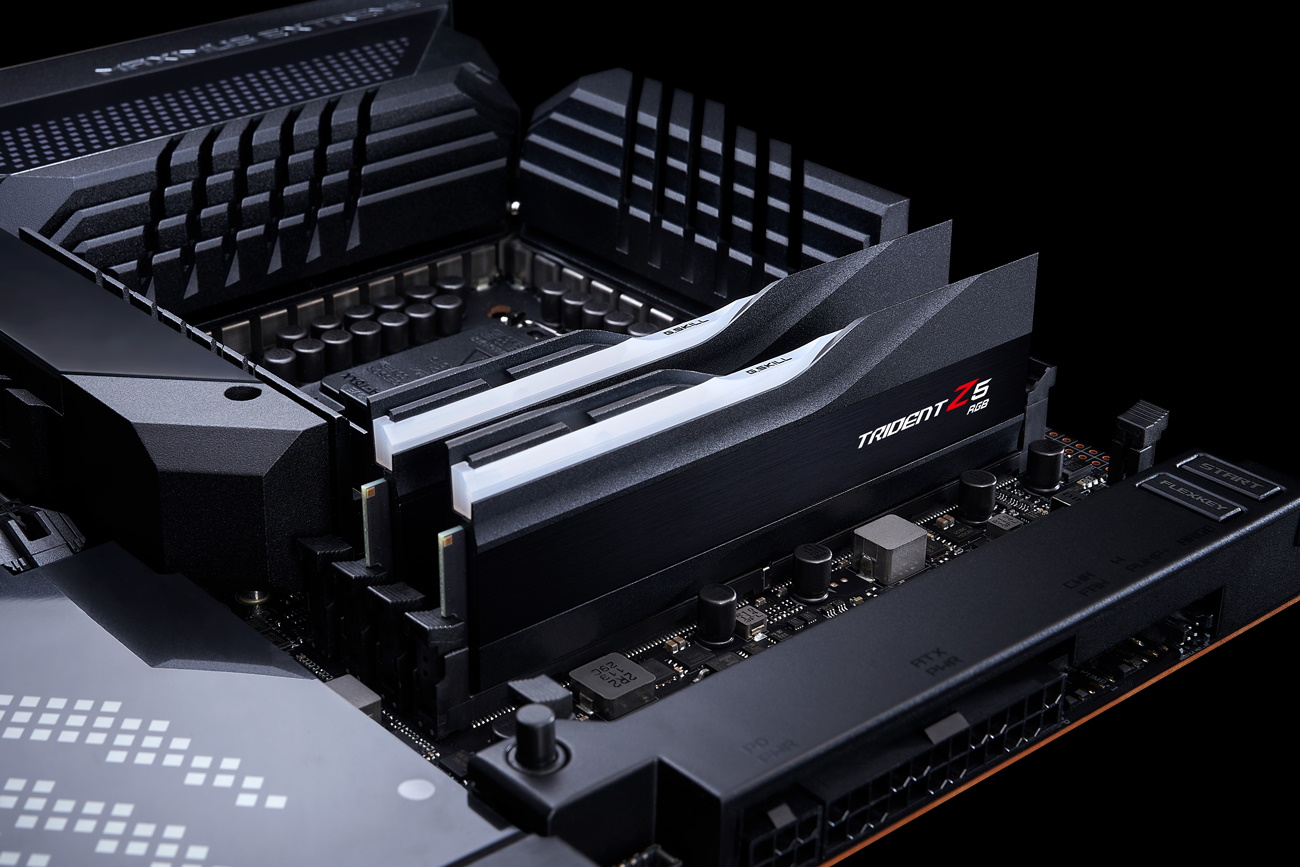
| GSkill Trident Z DDR5-5600 CL36 (F5-5600U3636C16GX2-TZ5RK) | |
| GPU | Asus TUF RTX 3070 |
| Cooling | Coolermaster MasterLiquid PL360 Flux |
| PSU | EVGA Supernova 850W P6 |
| Software | Windows 11 64-bit (22H2) |
| Graphics Driver | Nvidia GeForce Driver 522.25 |
| Sound | Integrated HD audio |
| Network | Integrated Networking (GbE or 2.5 GbE) |
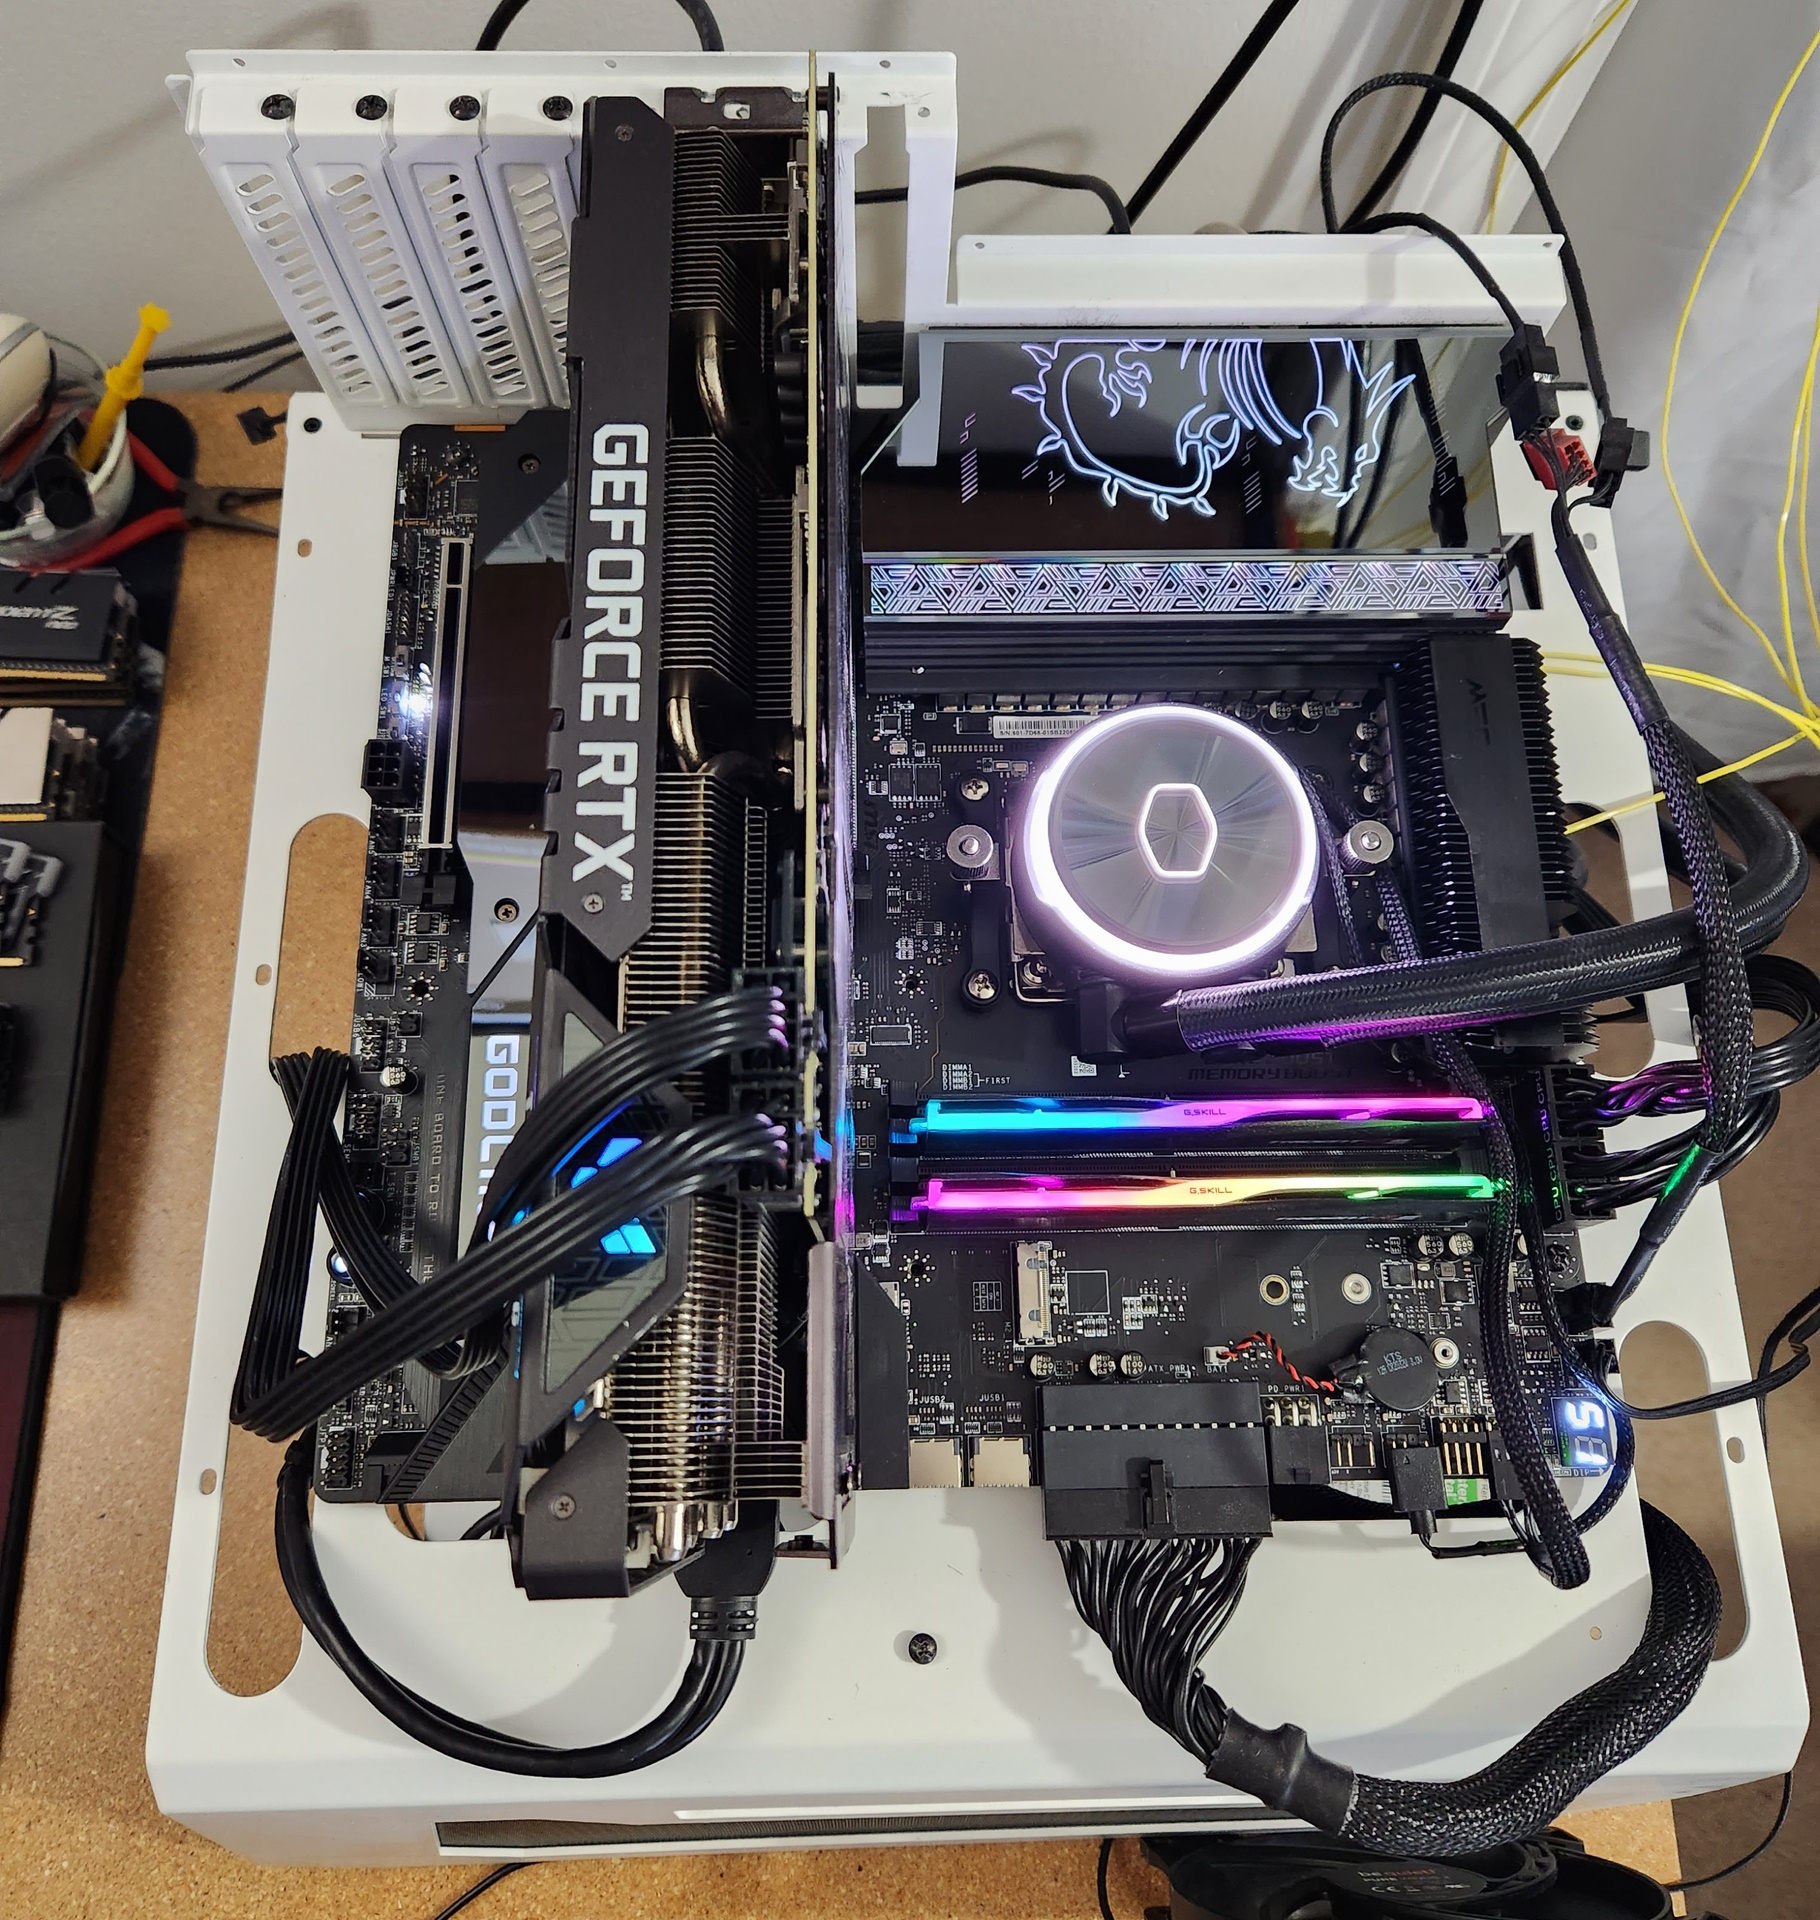
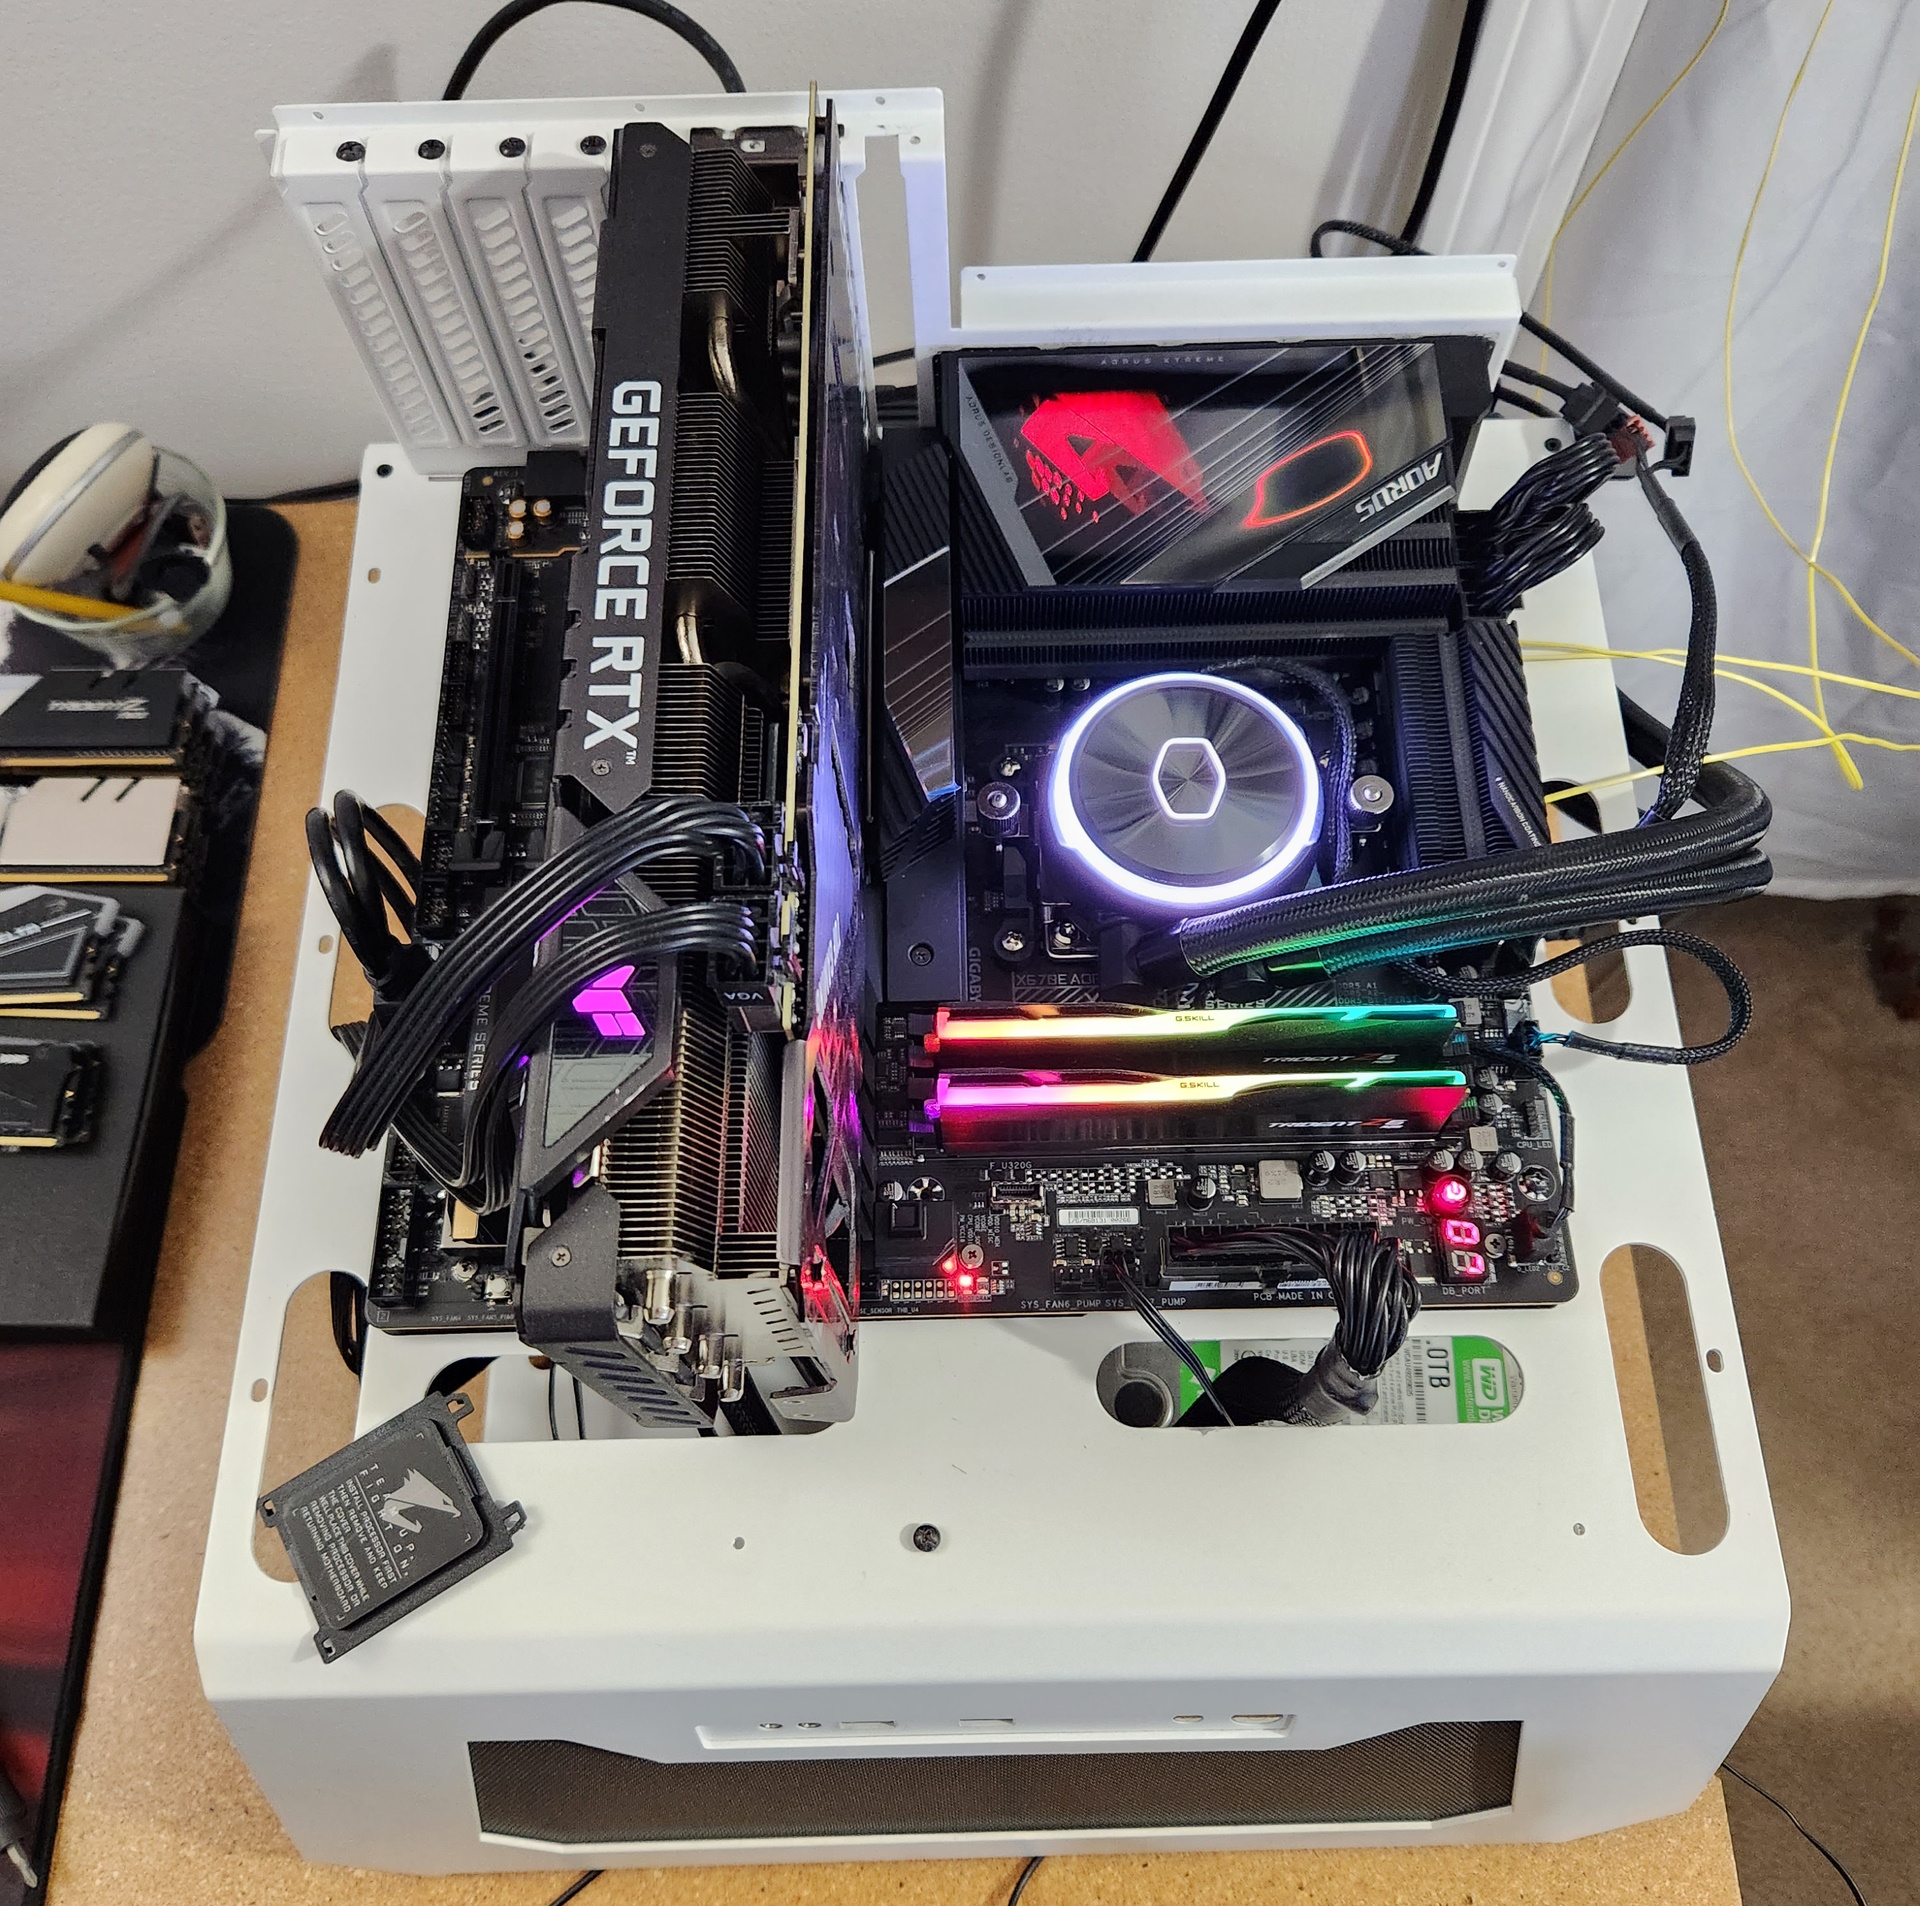
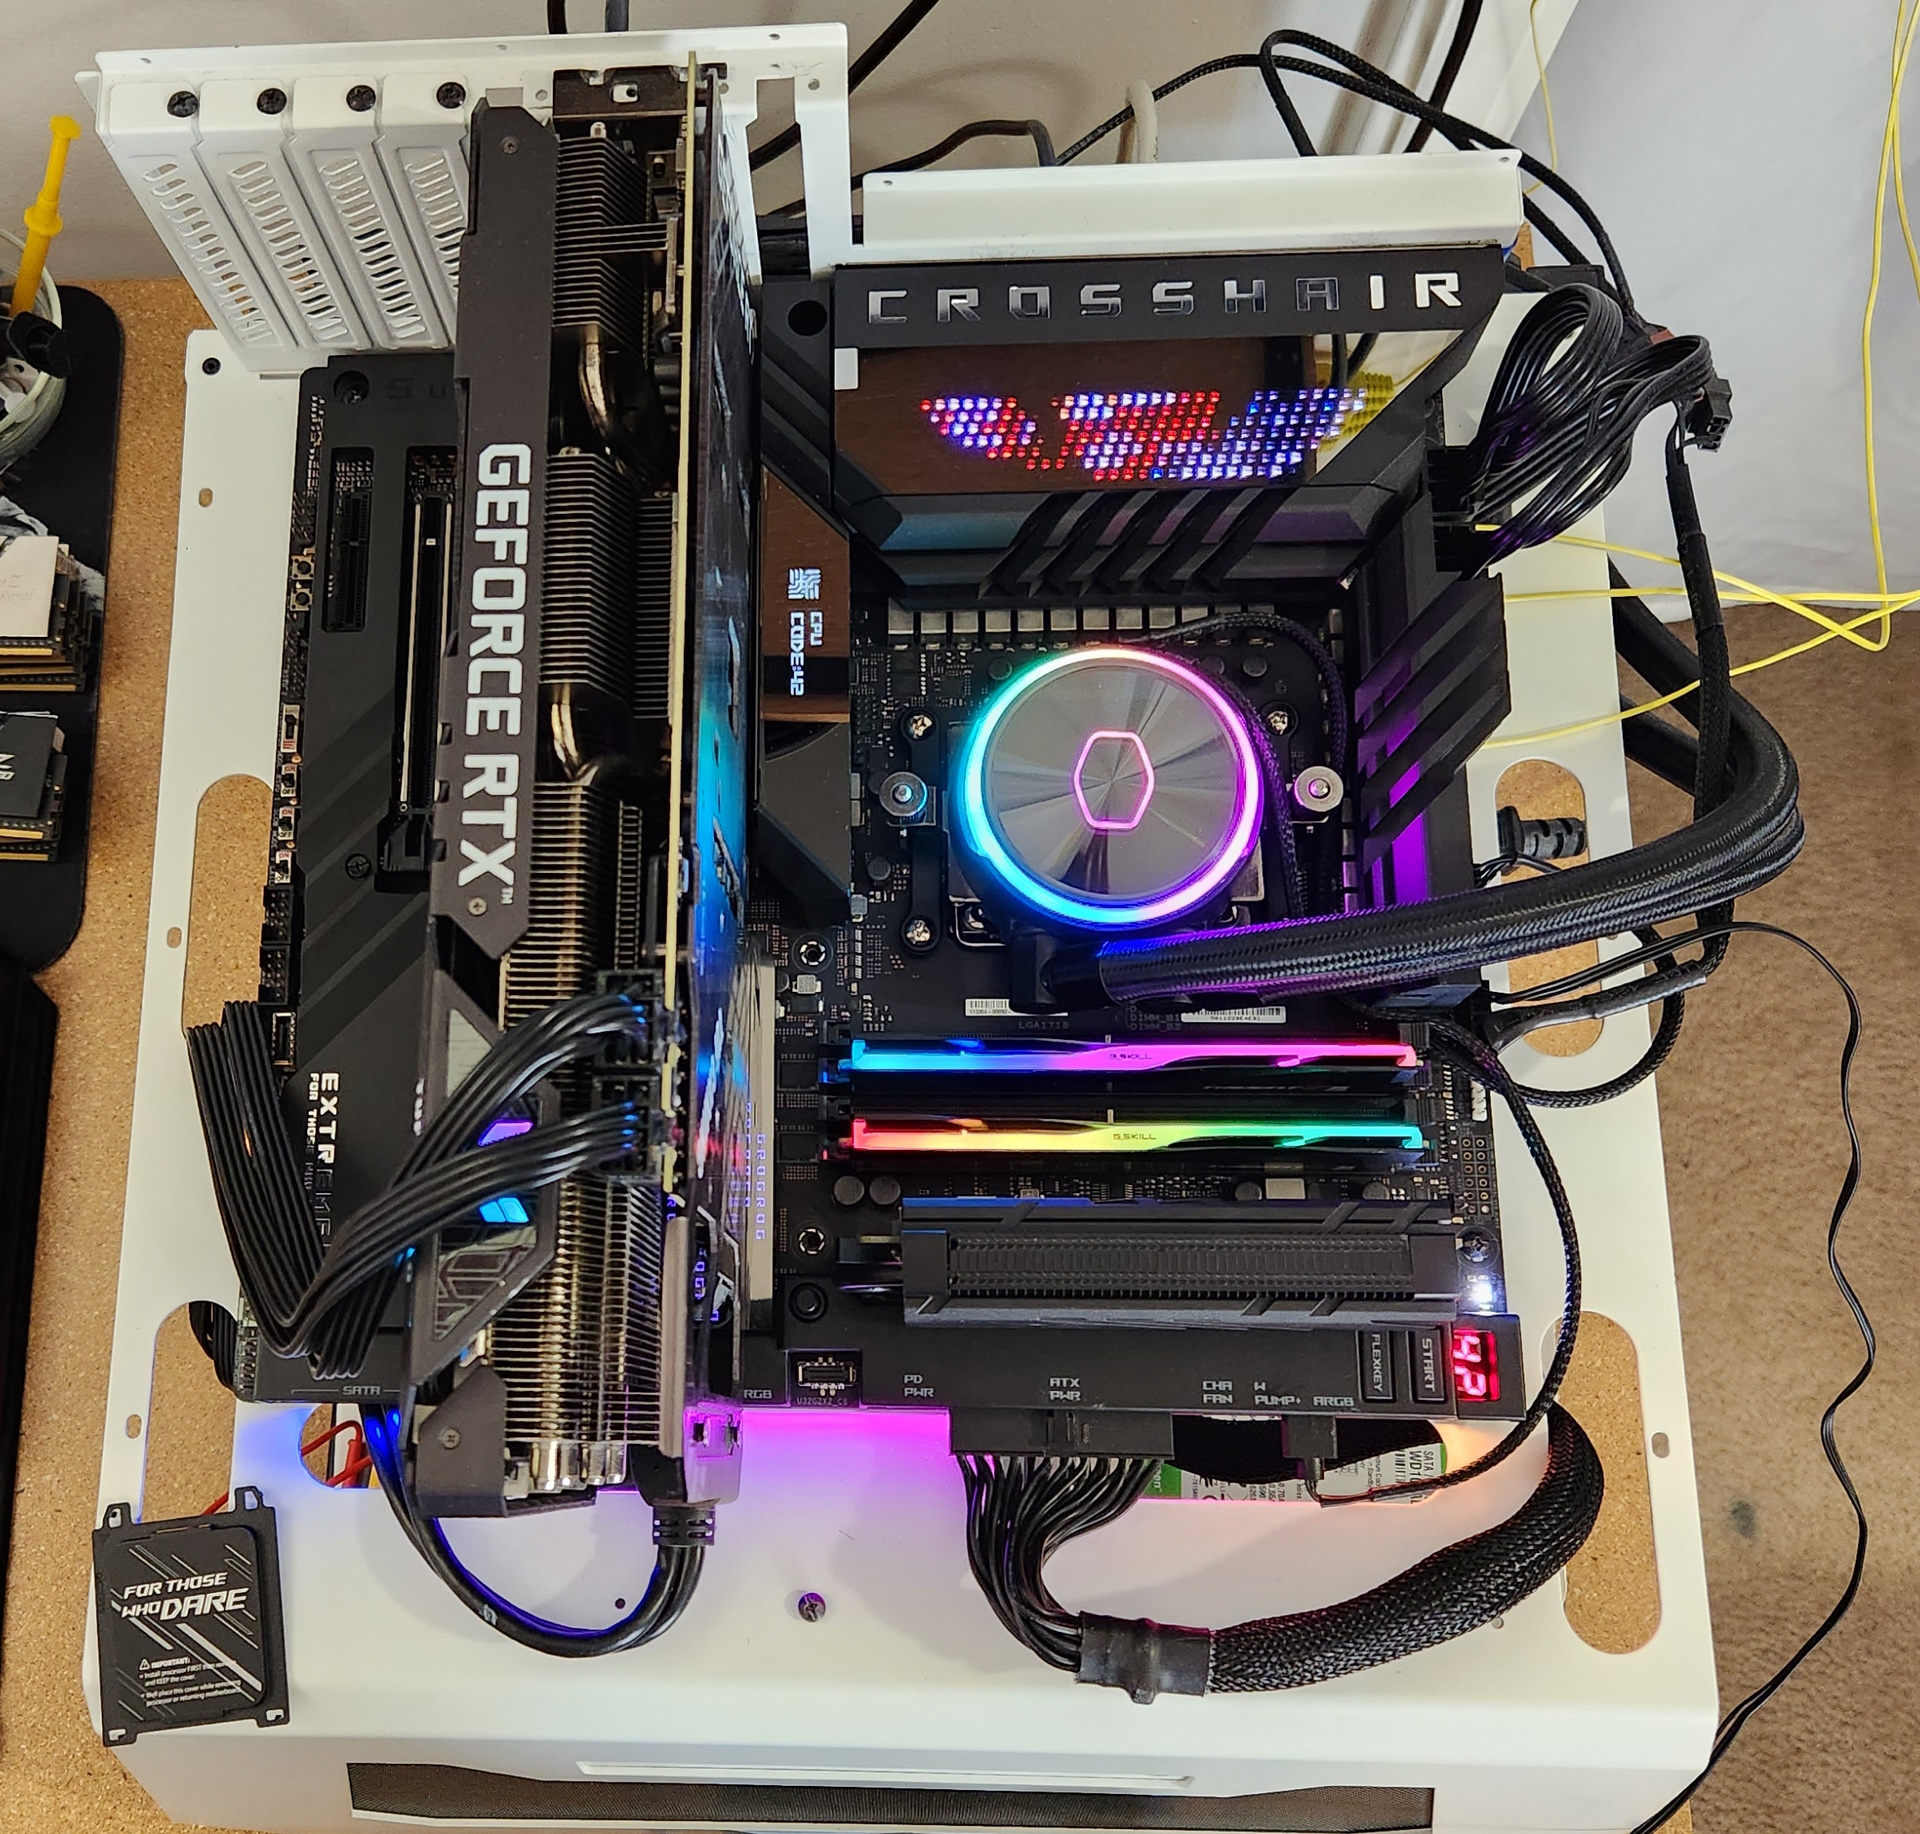
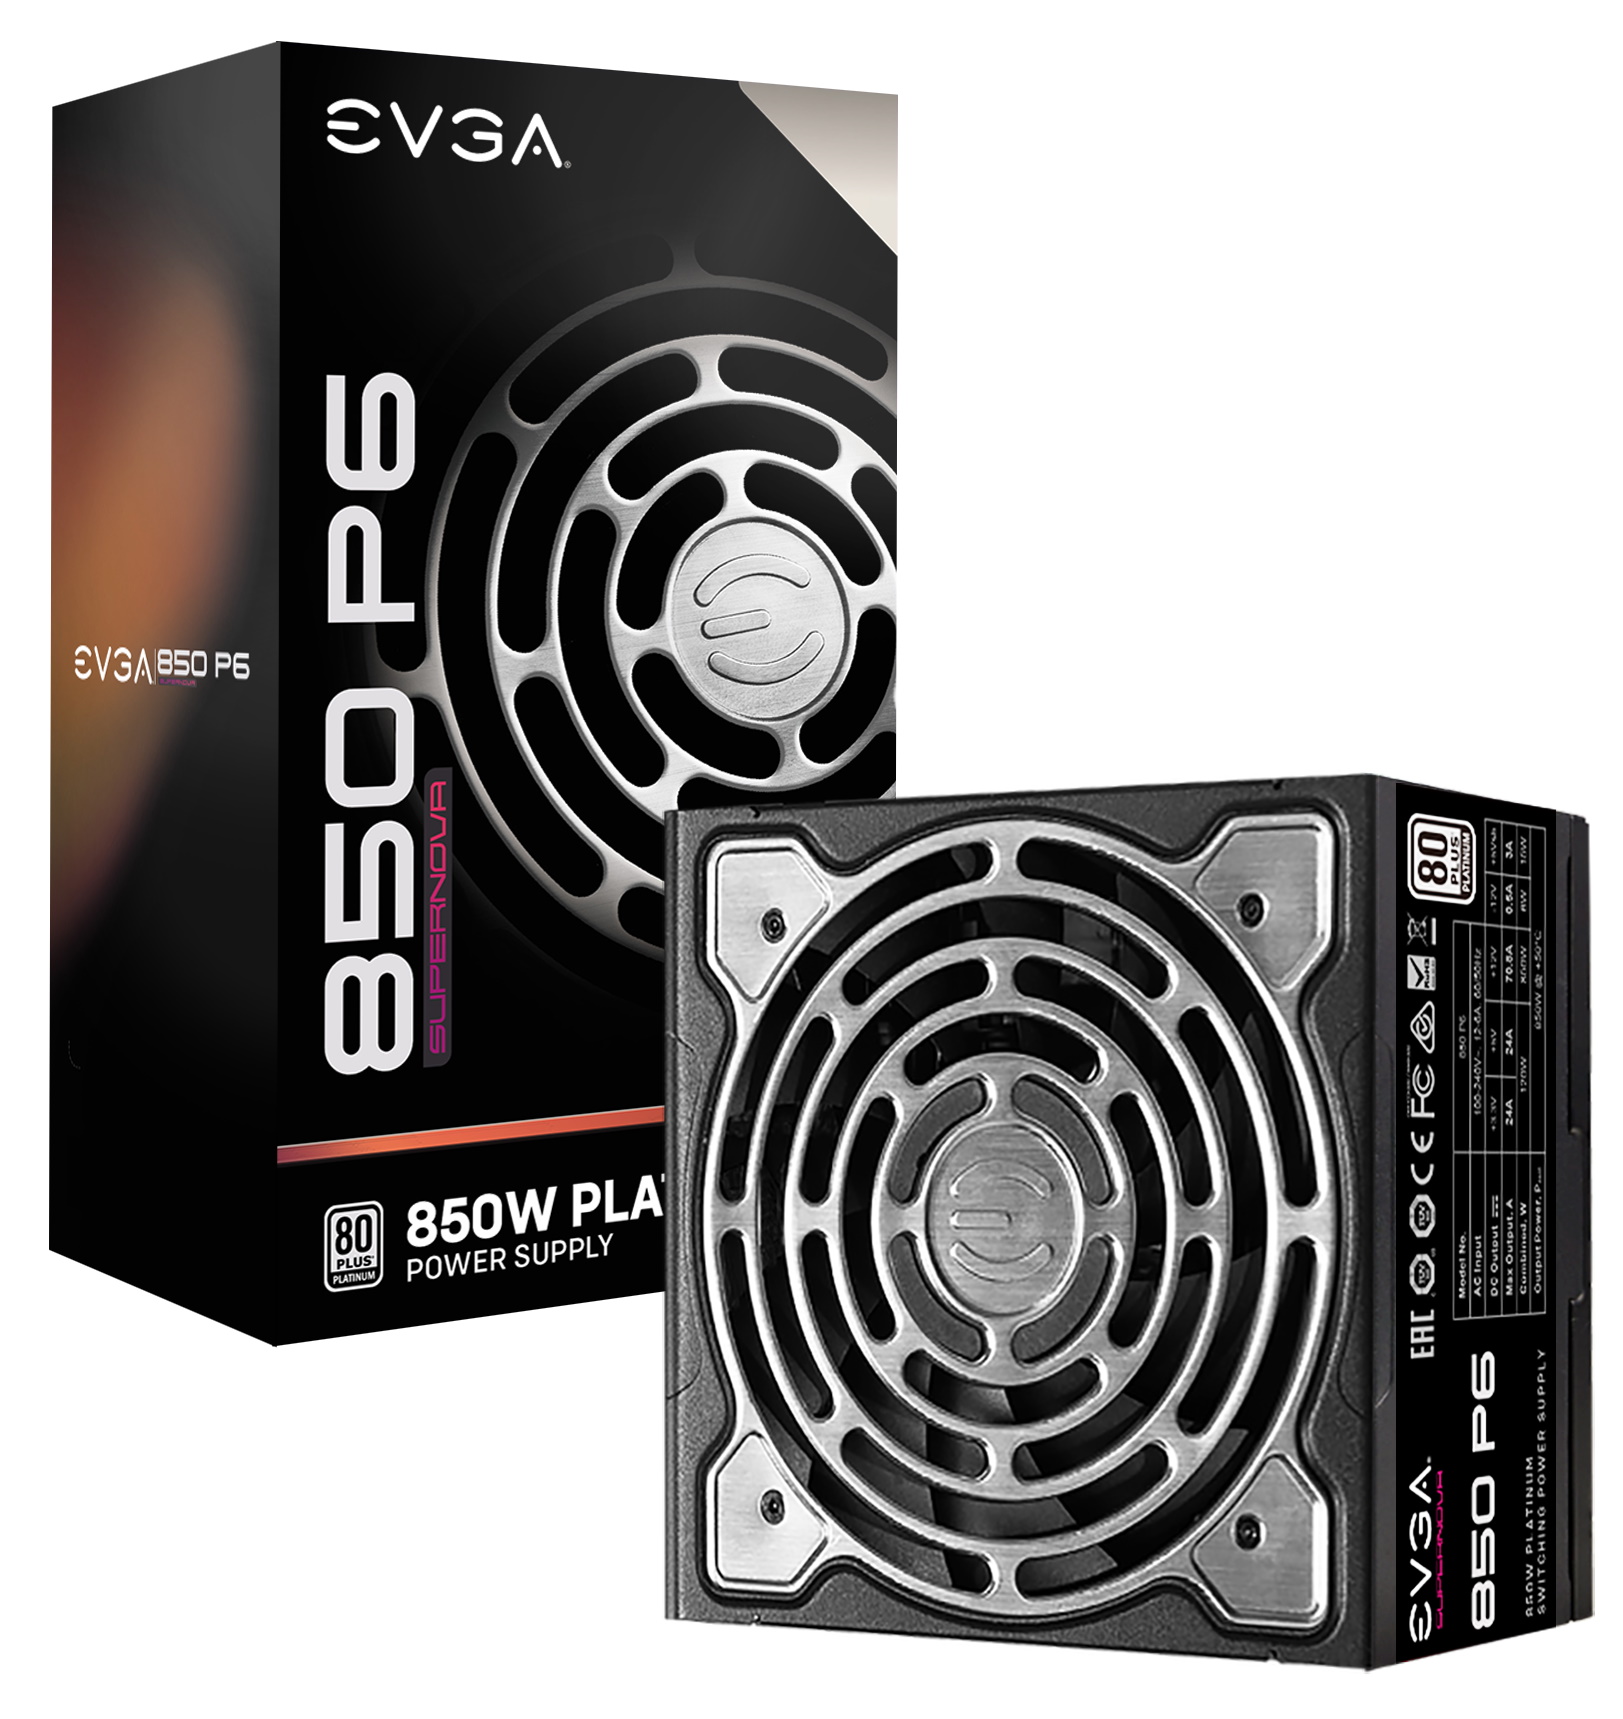
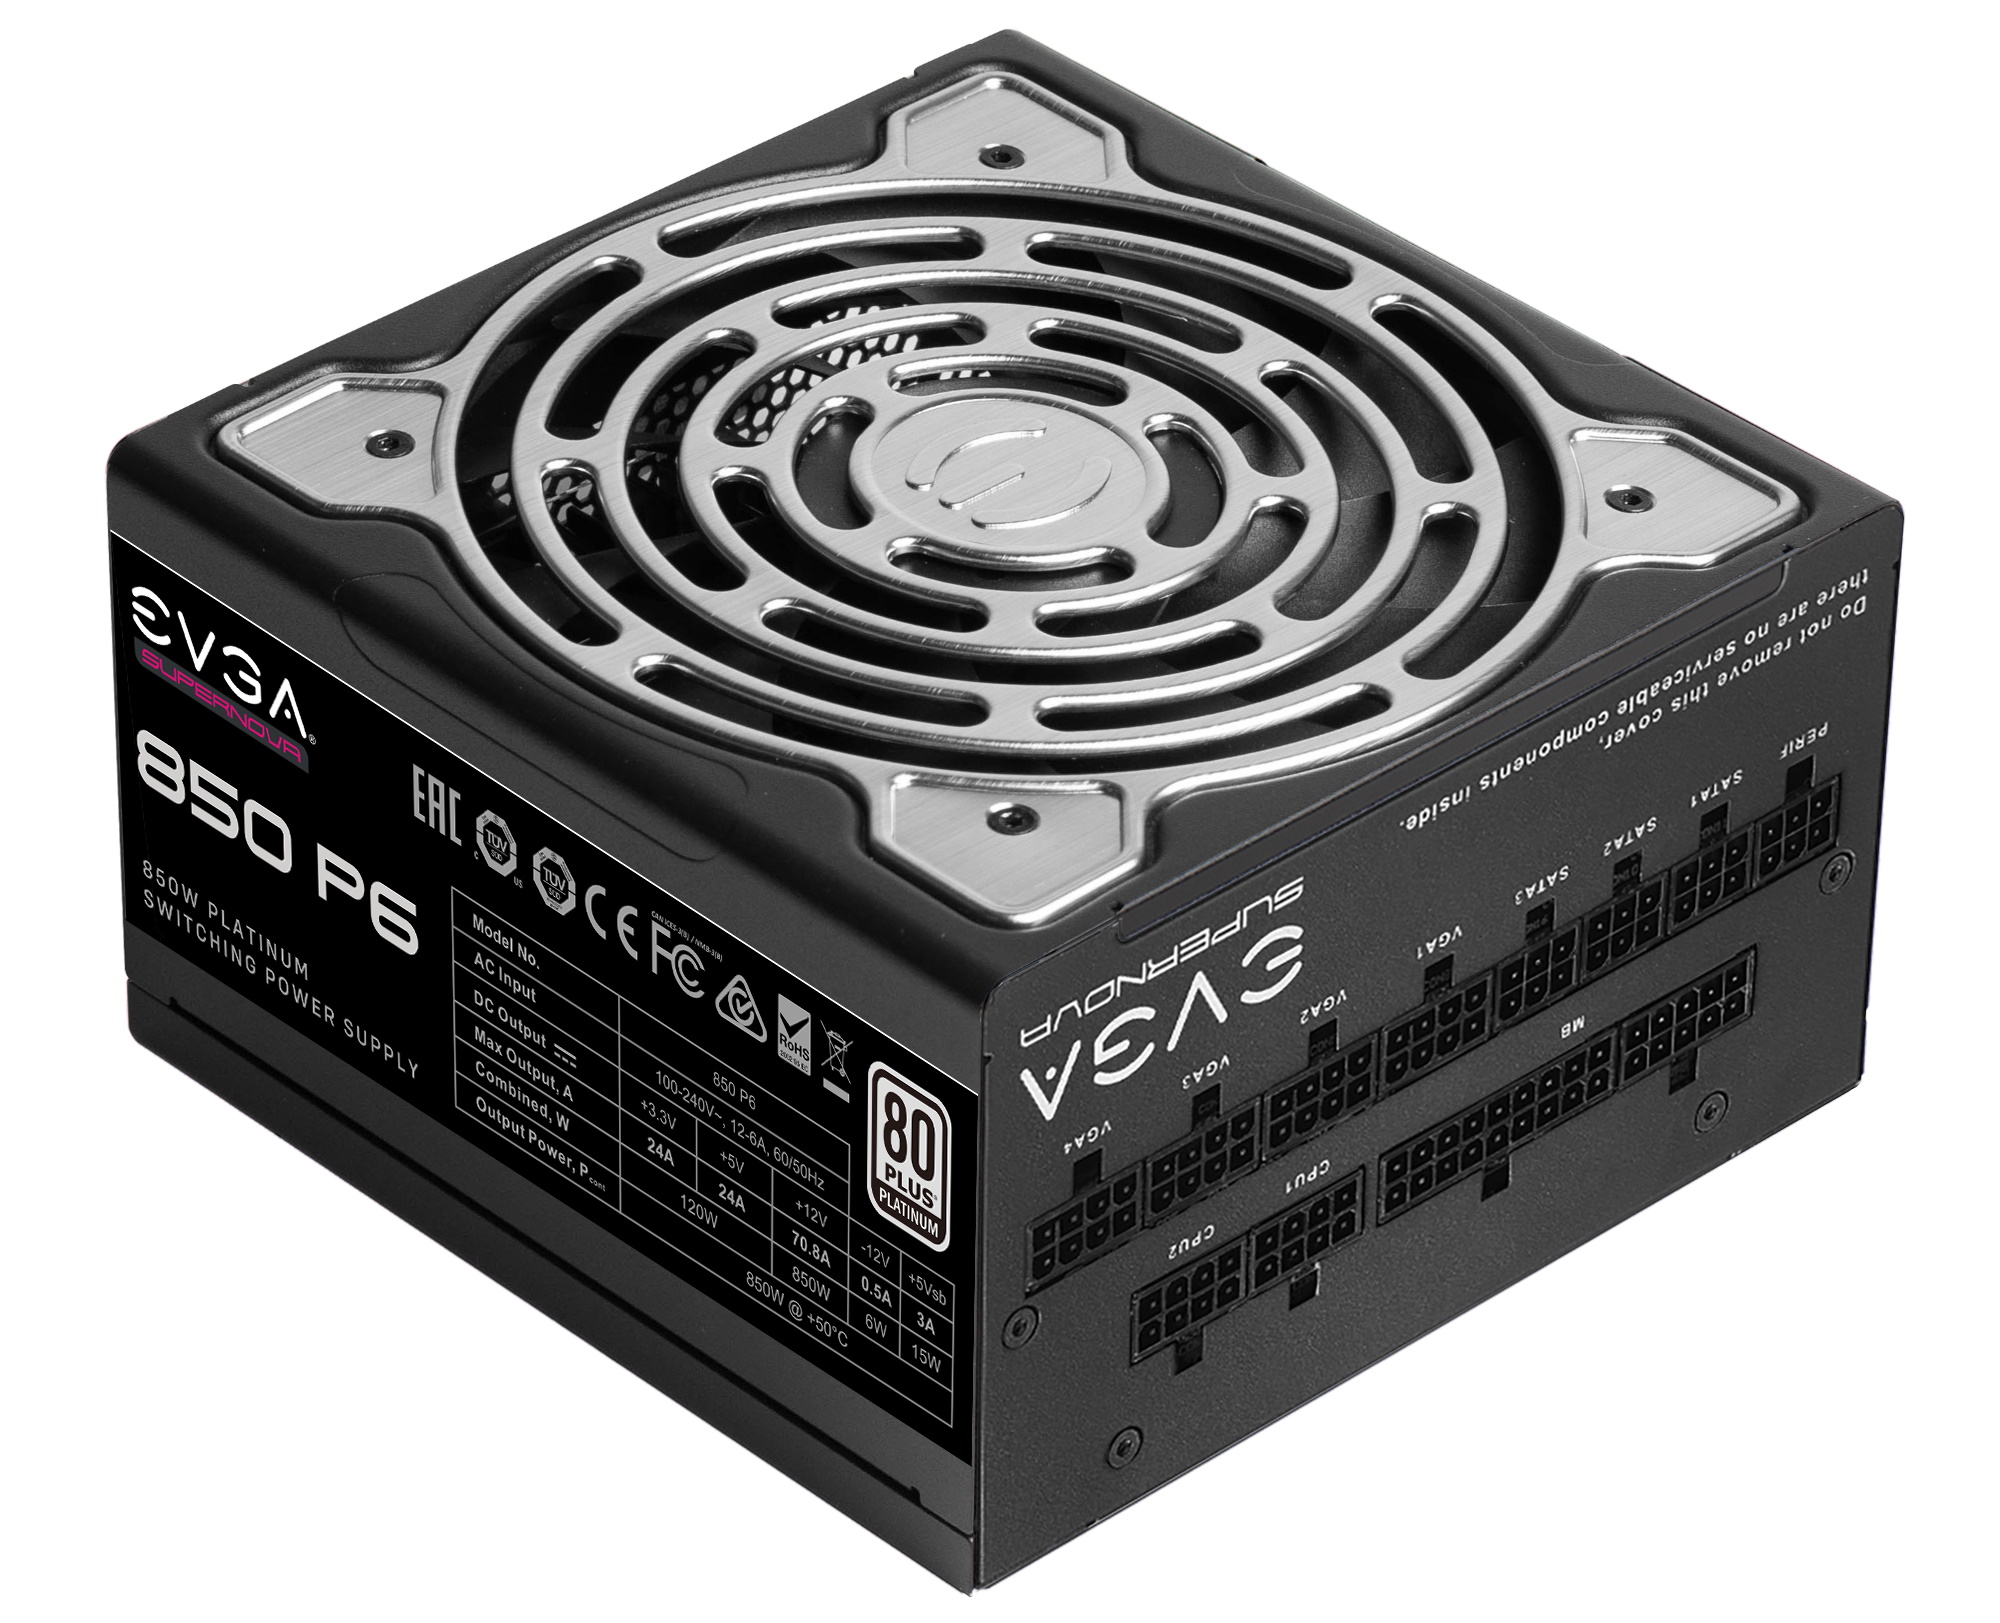
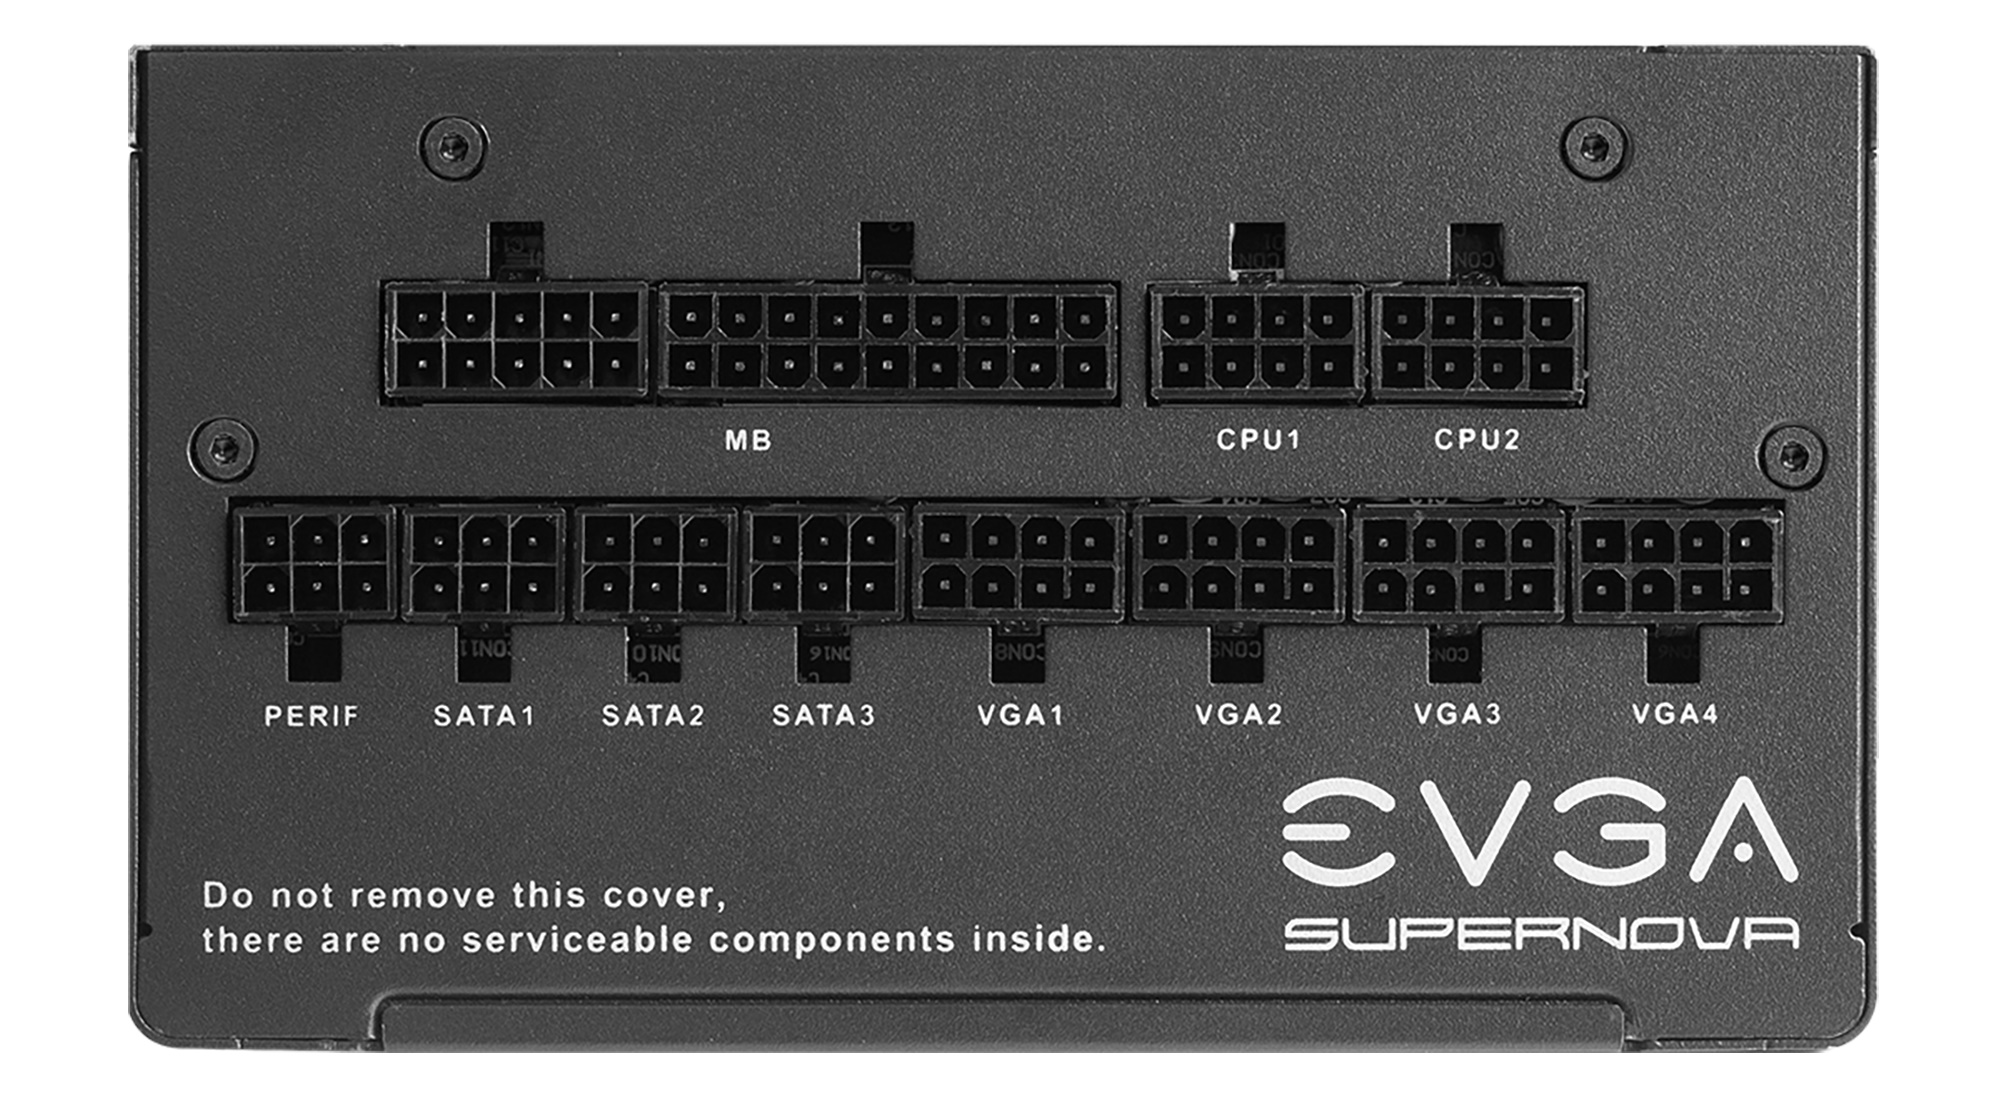
EVGA supplied our Supernova 850W P6 power supply (appropriately sized and more efficient than the 1.2KW monster we used previously) for our test systems, and G.Skill sent us a DDR5-5600 (F5-5600U3636C16GX2-TZ5RK) memory kit for testing.
Benchmark Settings
| Synthetic Benchmarks and Settings | |
| Procyon | Version 2.1.459 64 |
| Office Suite (Office 365), Video Editing (Premiere Pro 22.6.2.2), Photo Editing (Photoshop 23.5.1, Lightroom Classic 11.5) | |
| 3DMark | Version 2.22.7359 64 |
| Firestrike Extreme and Time Spy Default Presets | |
| Cinebench R23 | Version RBBENCHMARK330542 |
| Open GL Benchmark - Single and Multi-threaded | |
| Blender | Version 3.3.0 |
| Full benchmark (all 3 tests) | |
| Application Tests and Settings | |
| LAME MP3 | Version SSE2_2019 |
| Mixed 271MB WAV to mp3: Command: -b 160 --nores (160Kb/s) | |
| HandBrake CLI | Version: 1.2.2 |
| Sintel Open Movie Project: 4.19GB 4K mkv to x264 (light AVX) and x265 (heavy AVX) | |
| Corona 1.4 | Version 1.4 |
| Custom benchmark | |
| 7-Zip | Version 21.03-beta |
| Integrated benchmark (Command Line) | |
| Game Tests and Settings | |
| Far Cry 6 | Ultra Preset - 1920 x 1080, HD Textures ON |
| F1 2022 | Ultra Preset - 1920 x 1080, Ultra High (default) Bahrain (Clear/Dry), FPS Counter ON |
Benchmark Results and Final Analysis
Our standard benchmarks and power tests are performed using the CPU’s stock frequencies (including any default boost/turbo), with all power-saving features enabled. We set optimized defaults in the BIOS and the memory by enabling the XMP profile. For this baseline testing, the Windows power scheme is set to Balanced (default), so the PC idles appropriately.
Synthetic Benchmarks
Synthetics provide a great way to determine how a board runs, as identical settings should produce similar performance results. Turbo boost wattage and advanced memory timings are places where motherboard makers can still optimize for either stability or performance, though, and those settings can impact some testing.
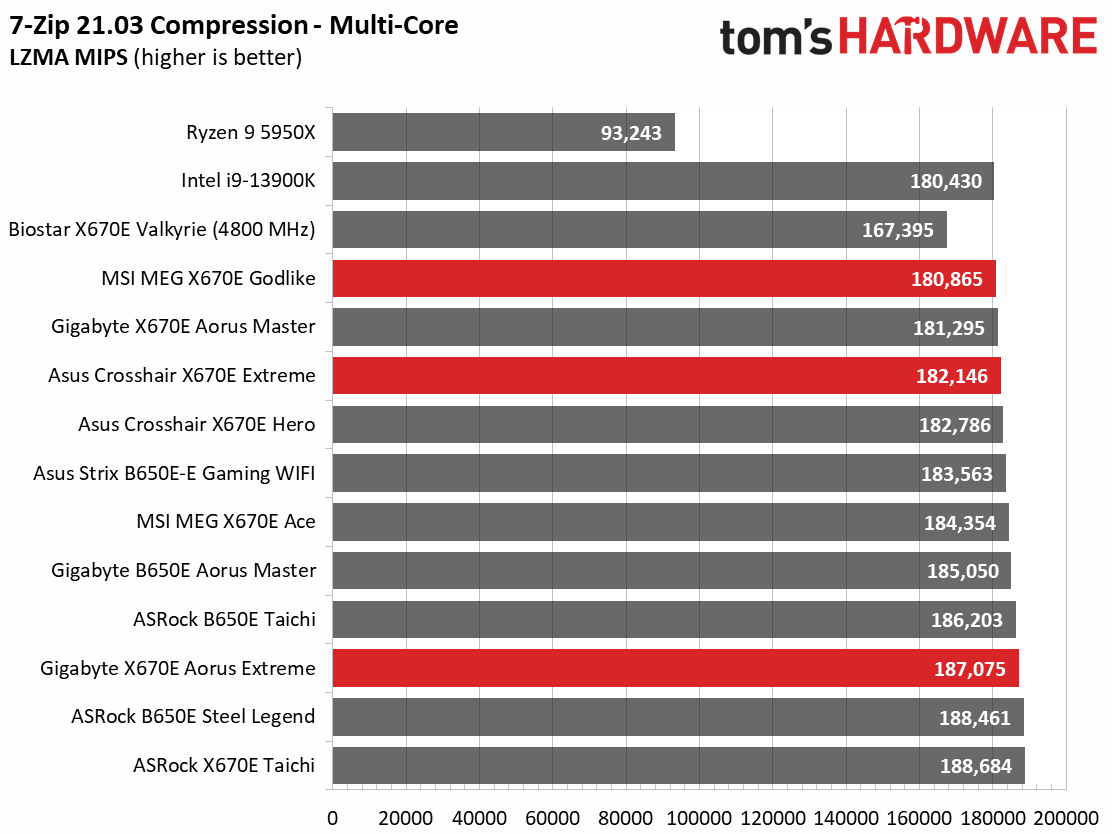
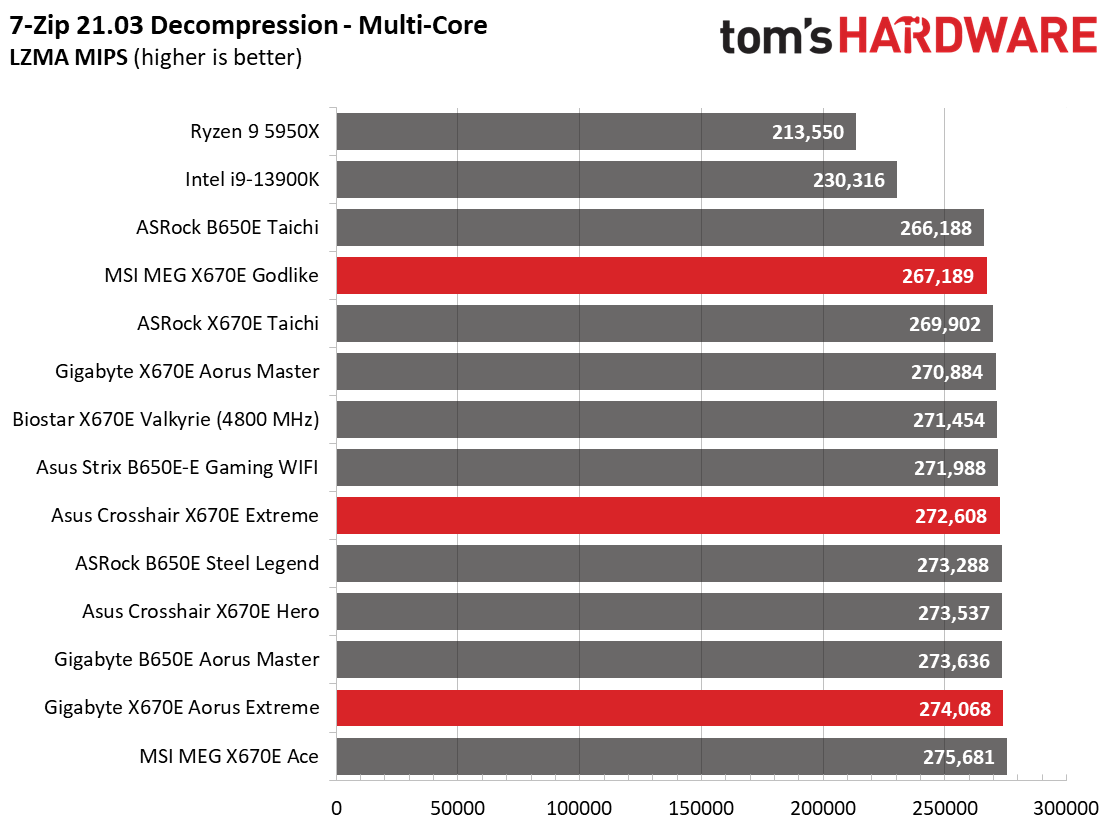
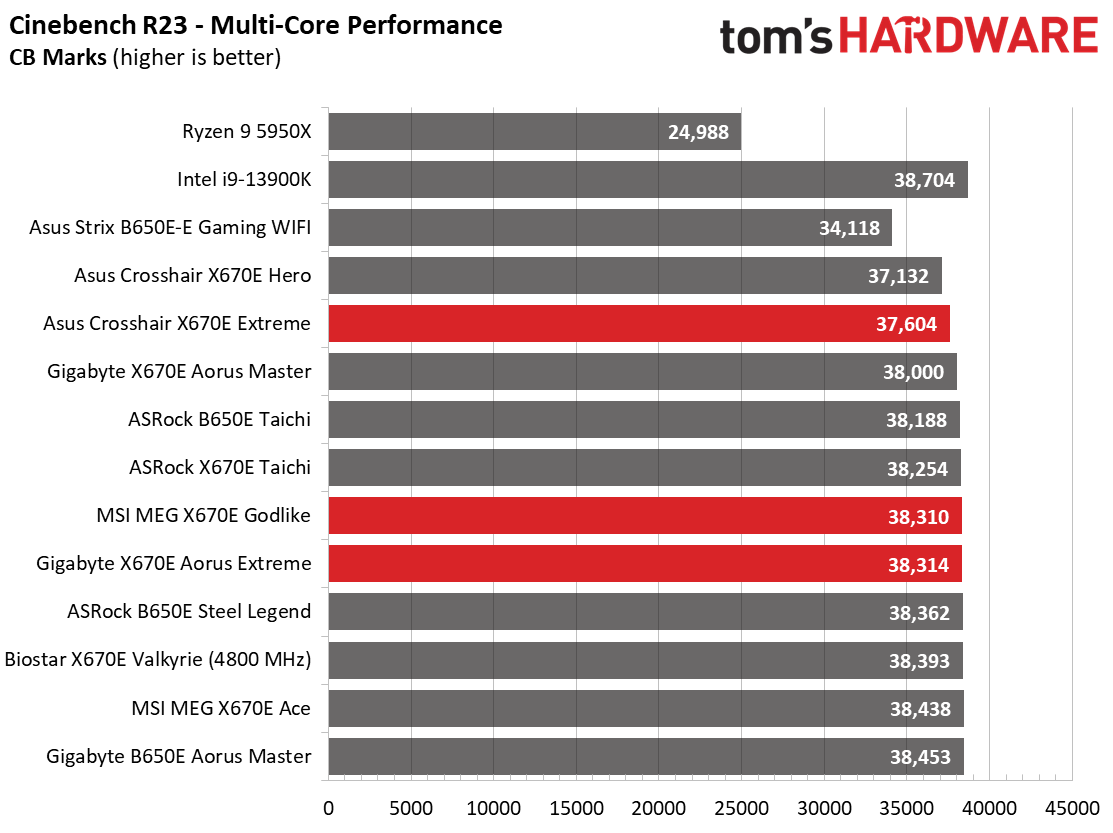
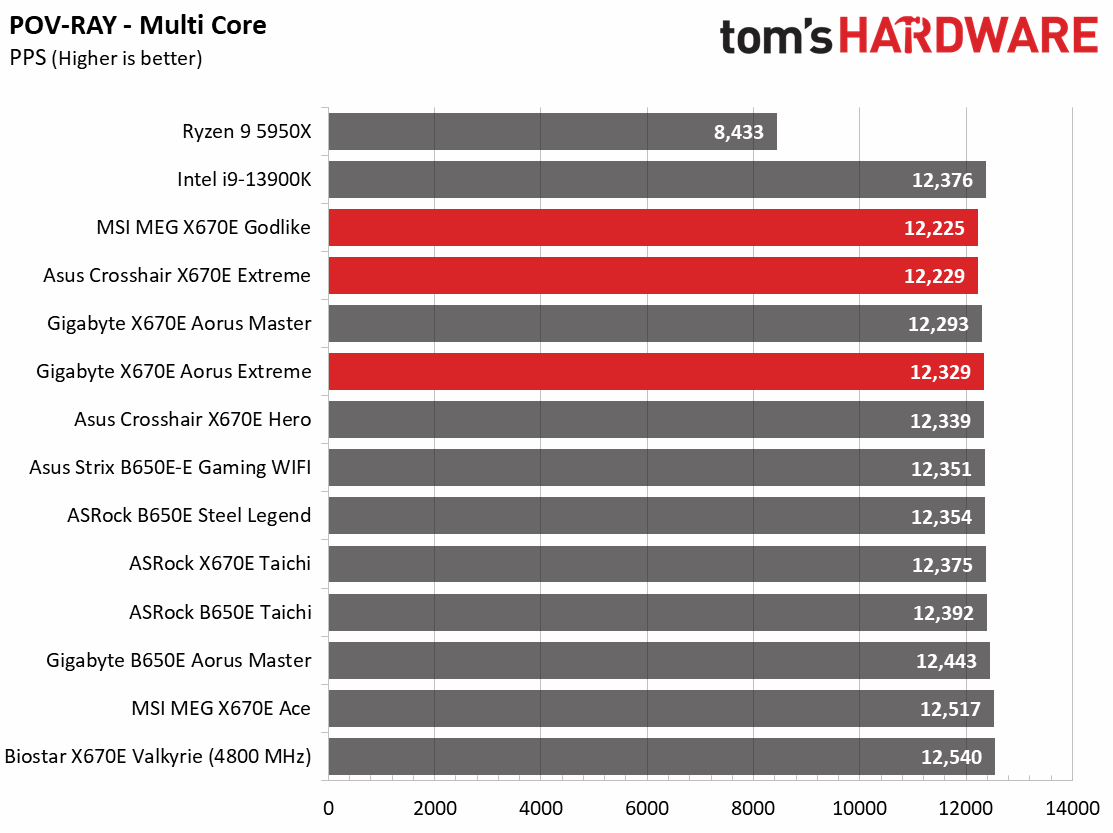
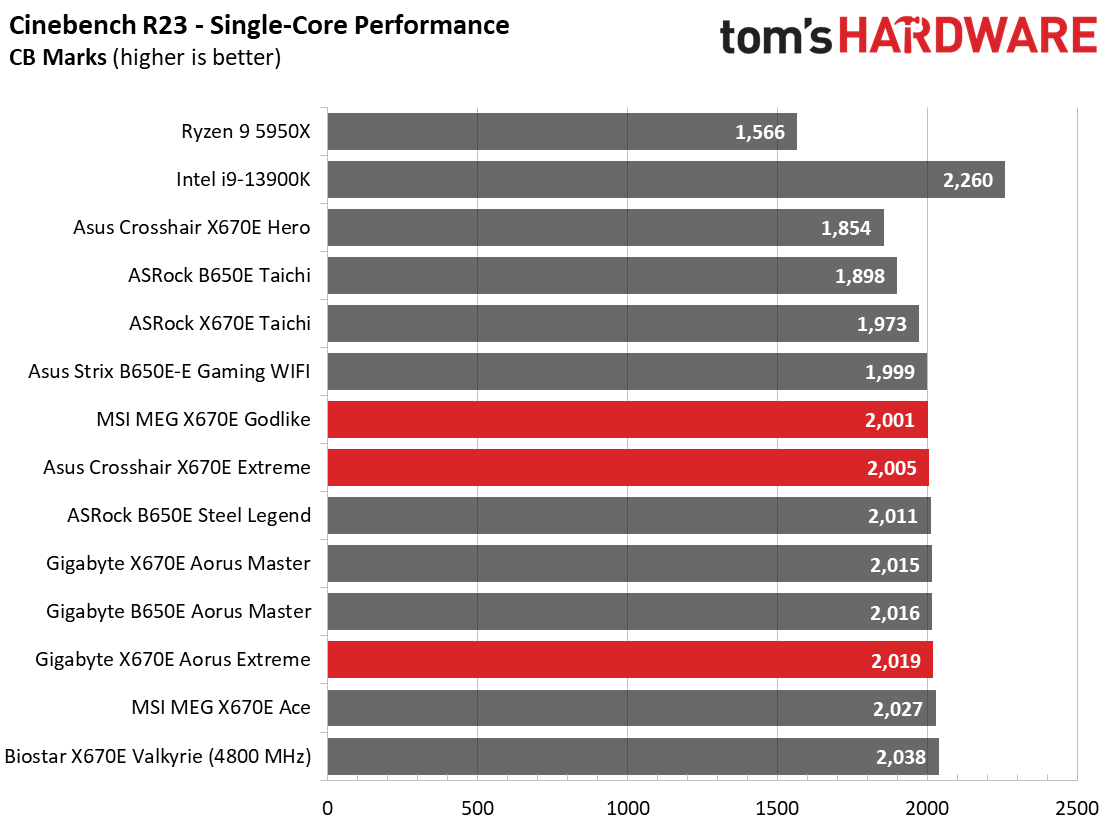
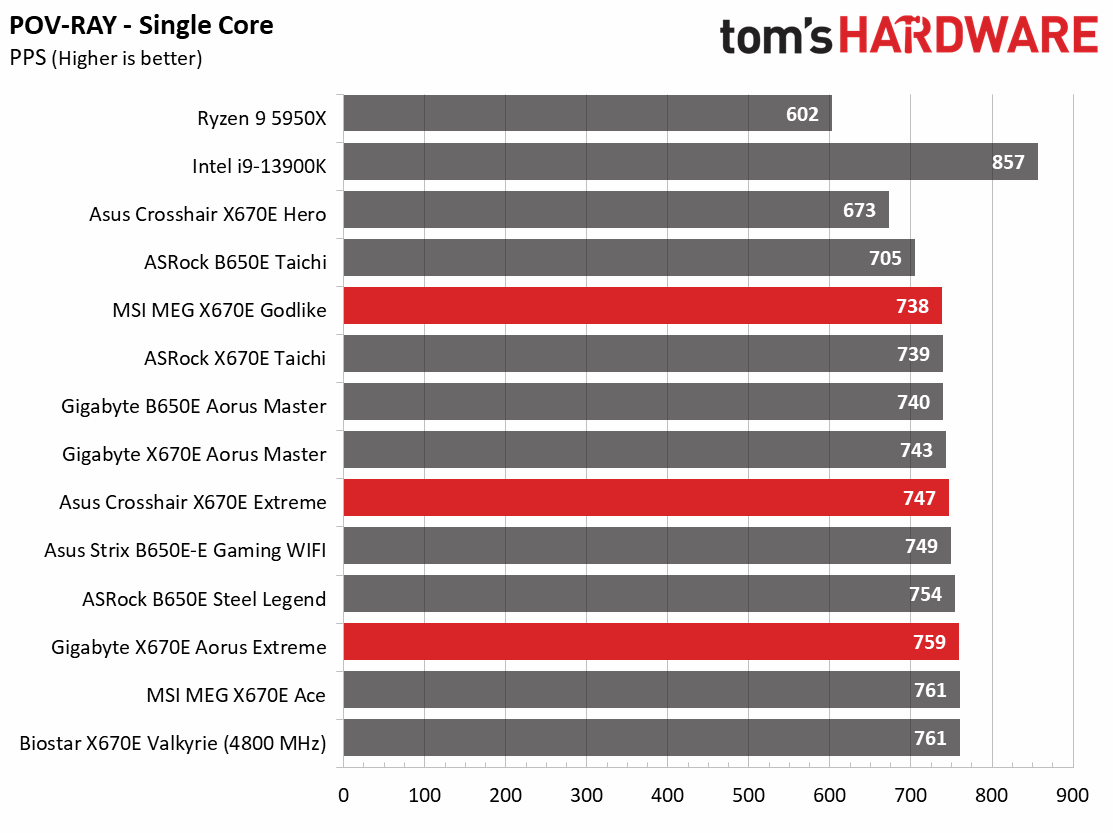
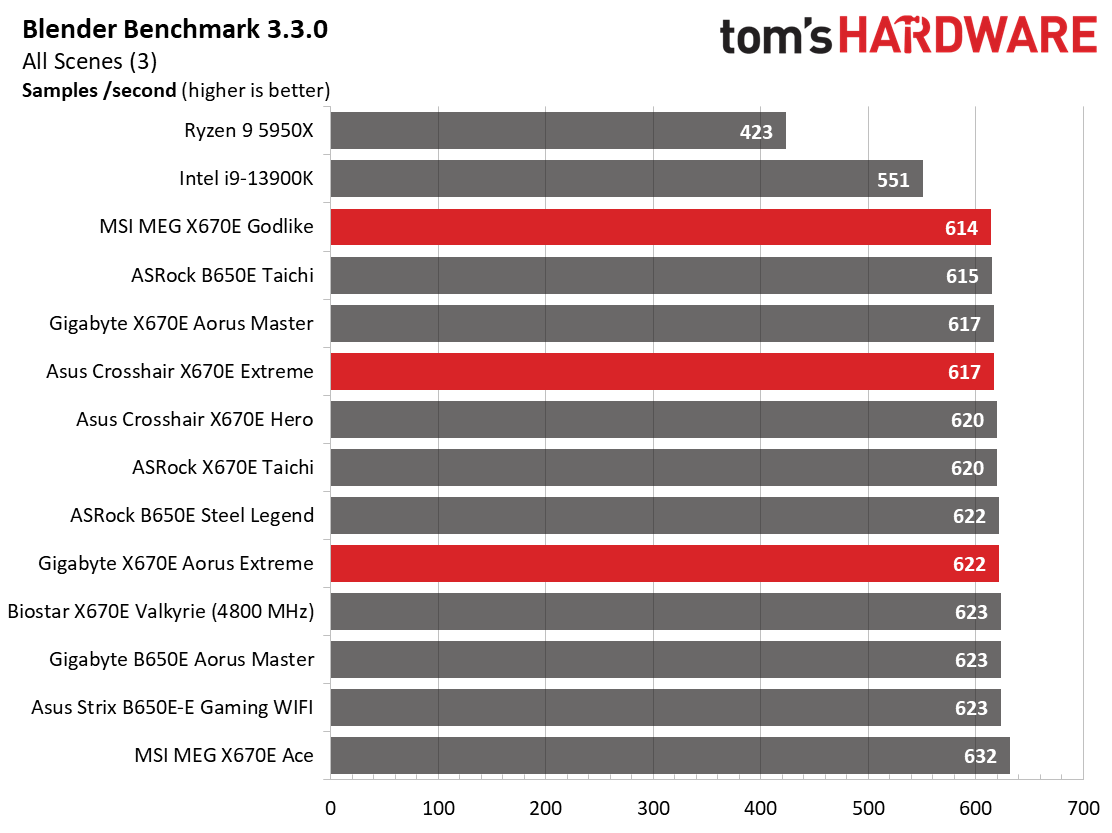
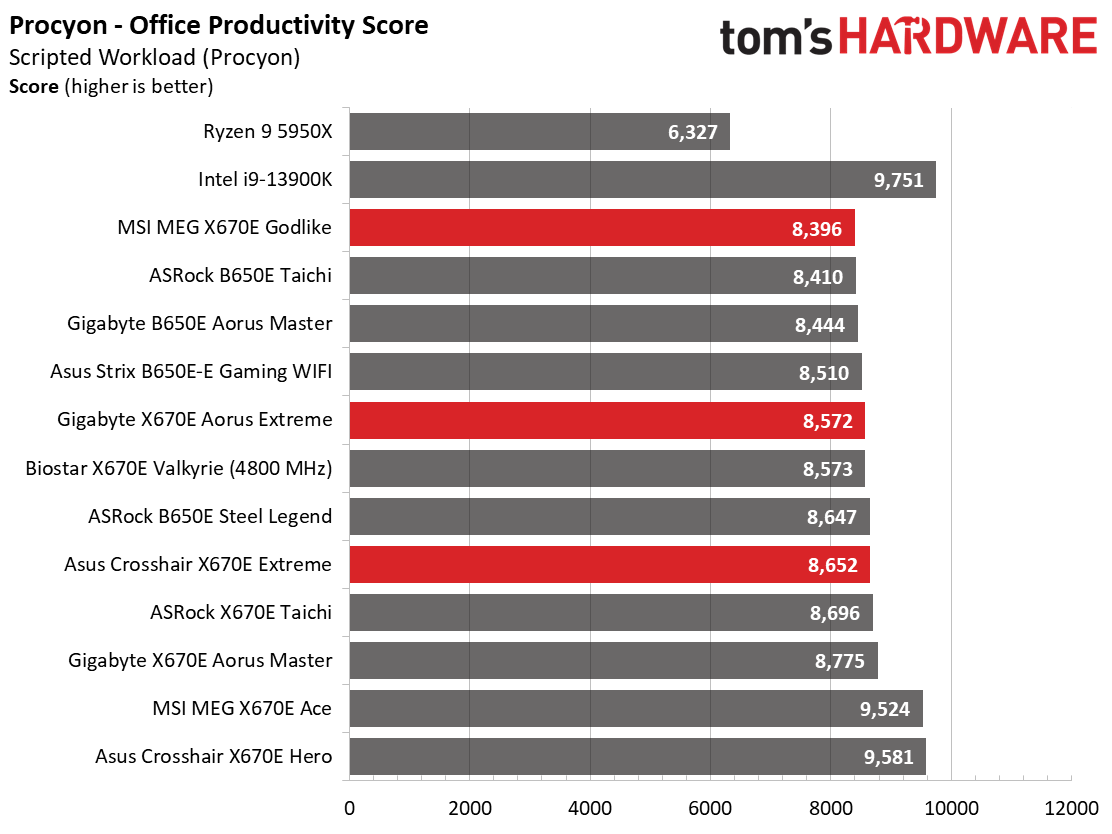
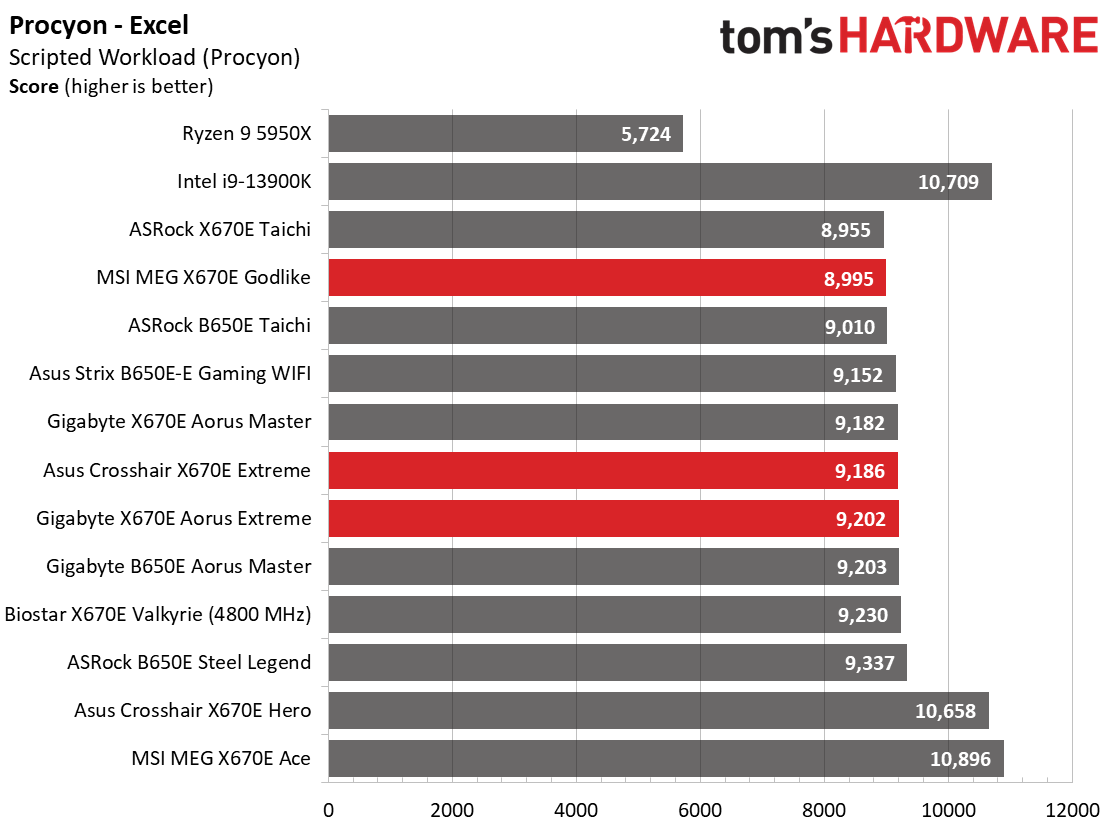
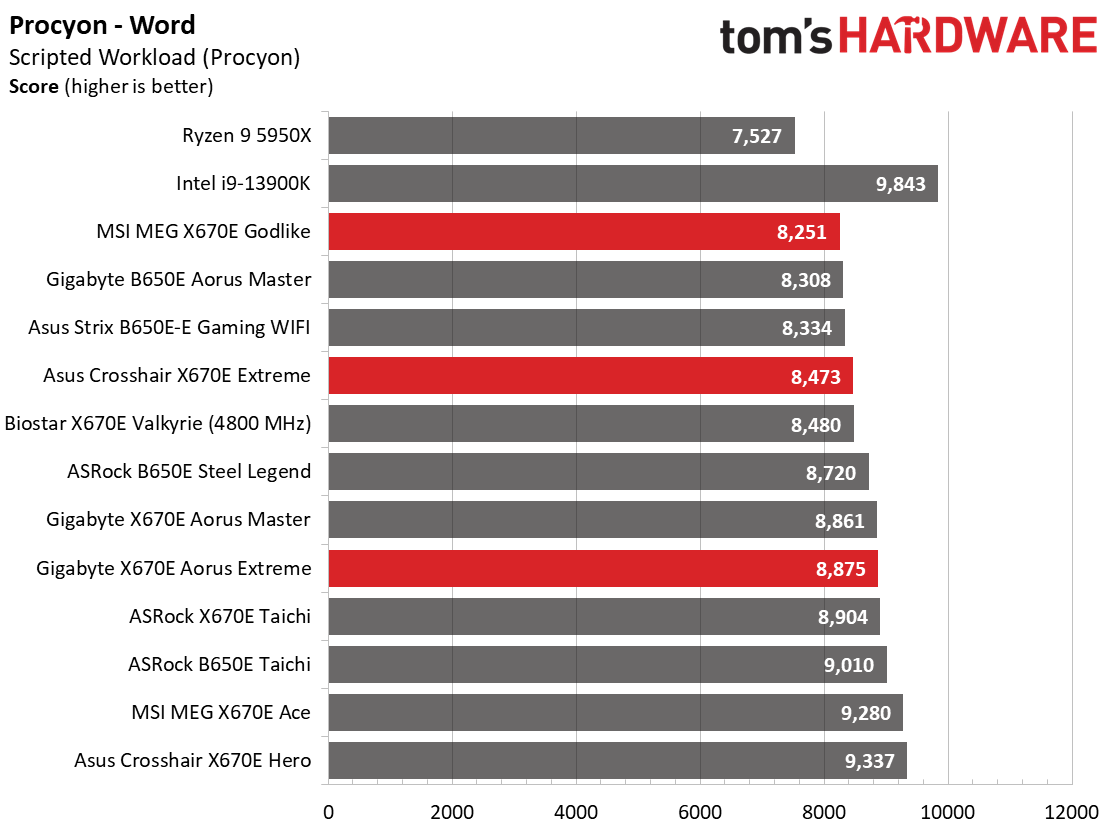
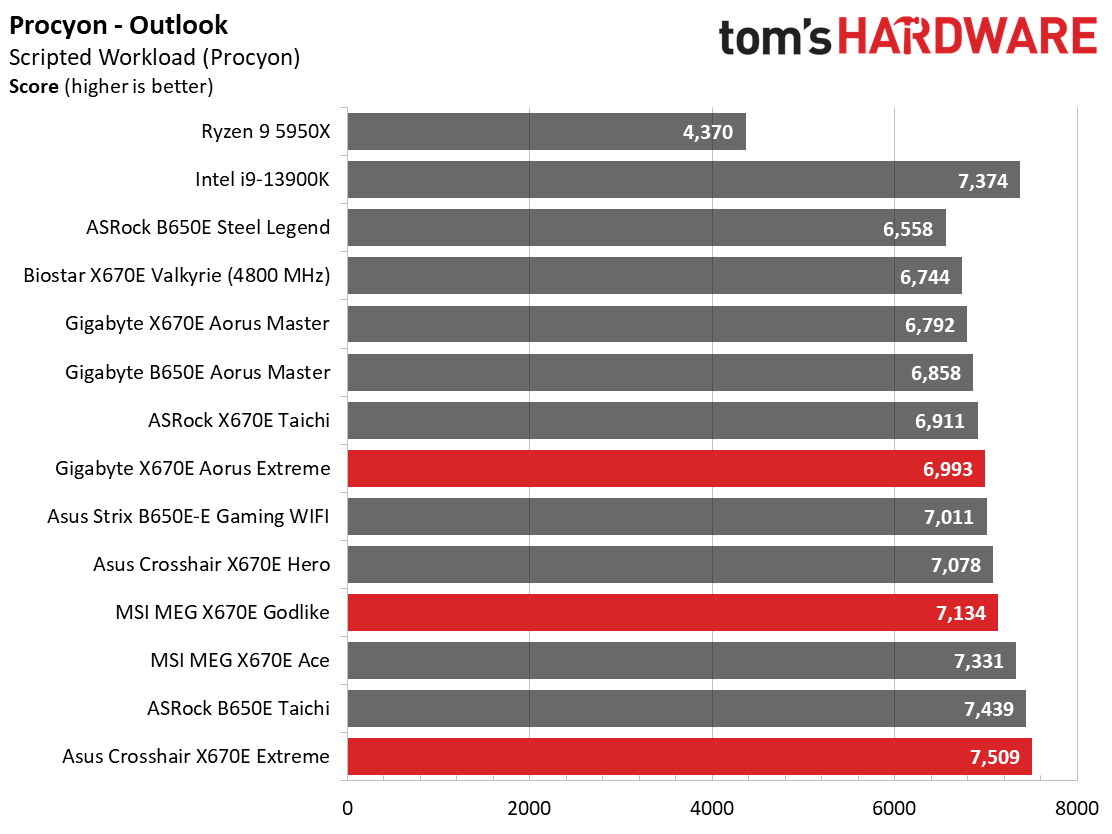
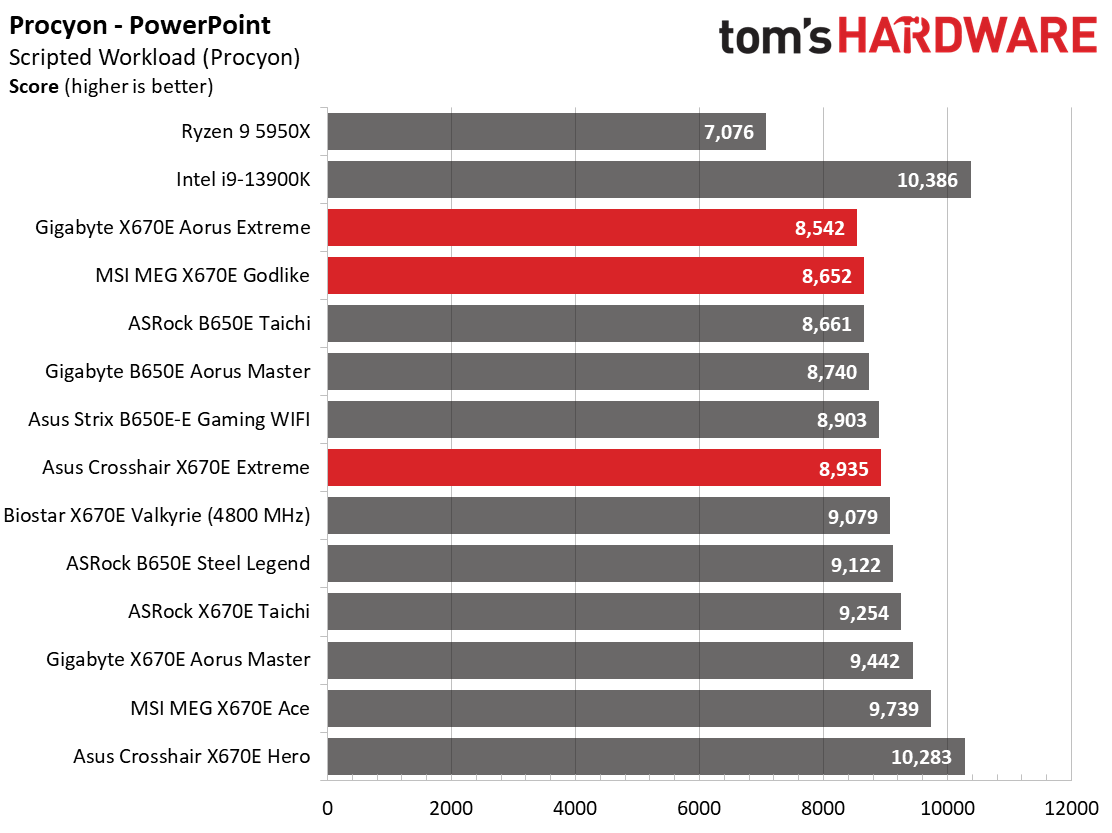
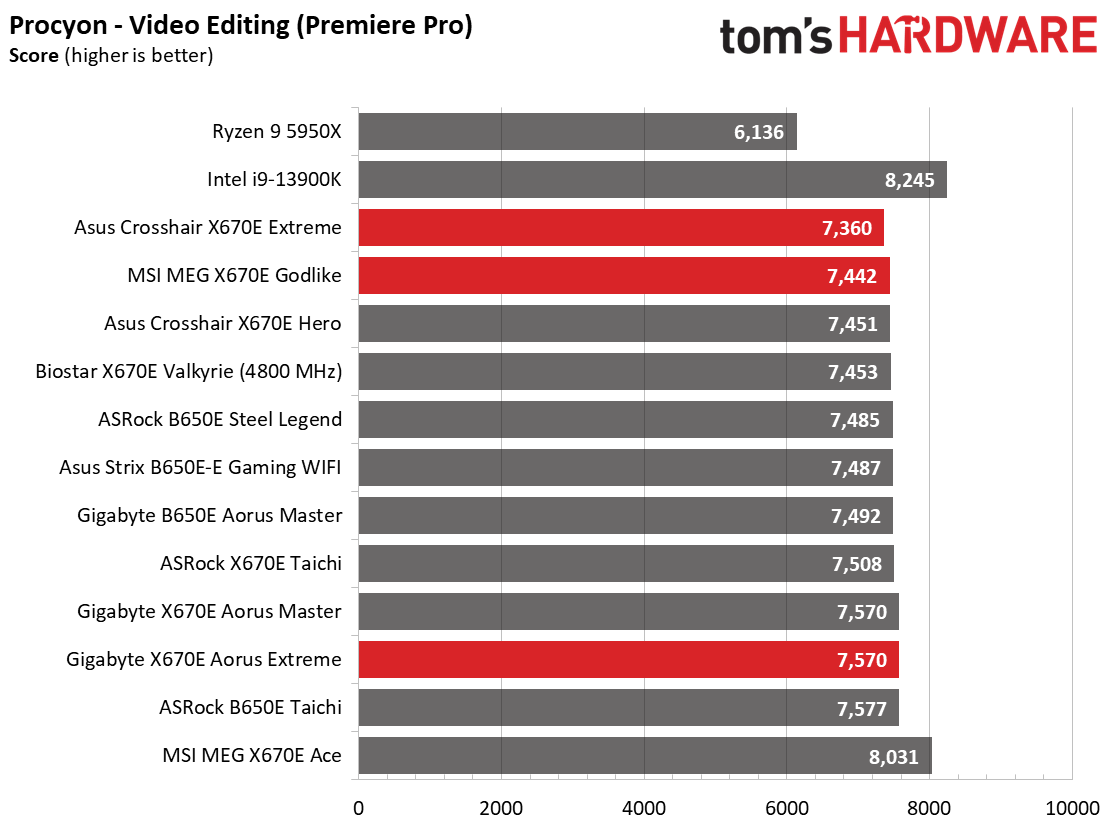
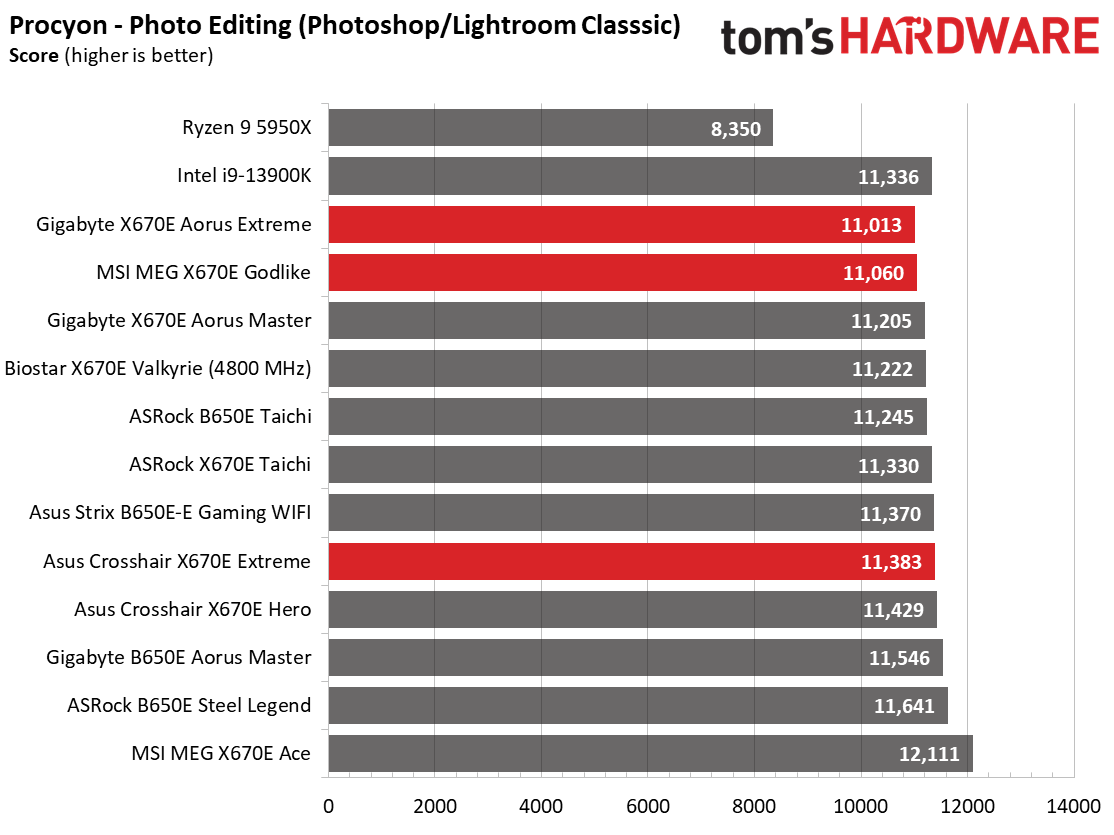
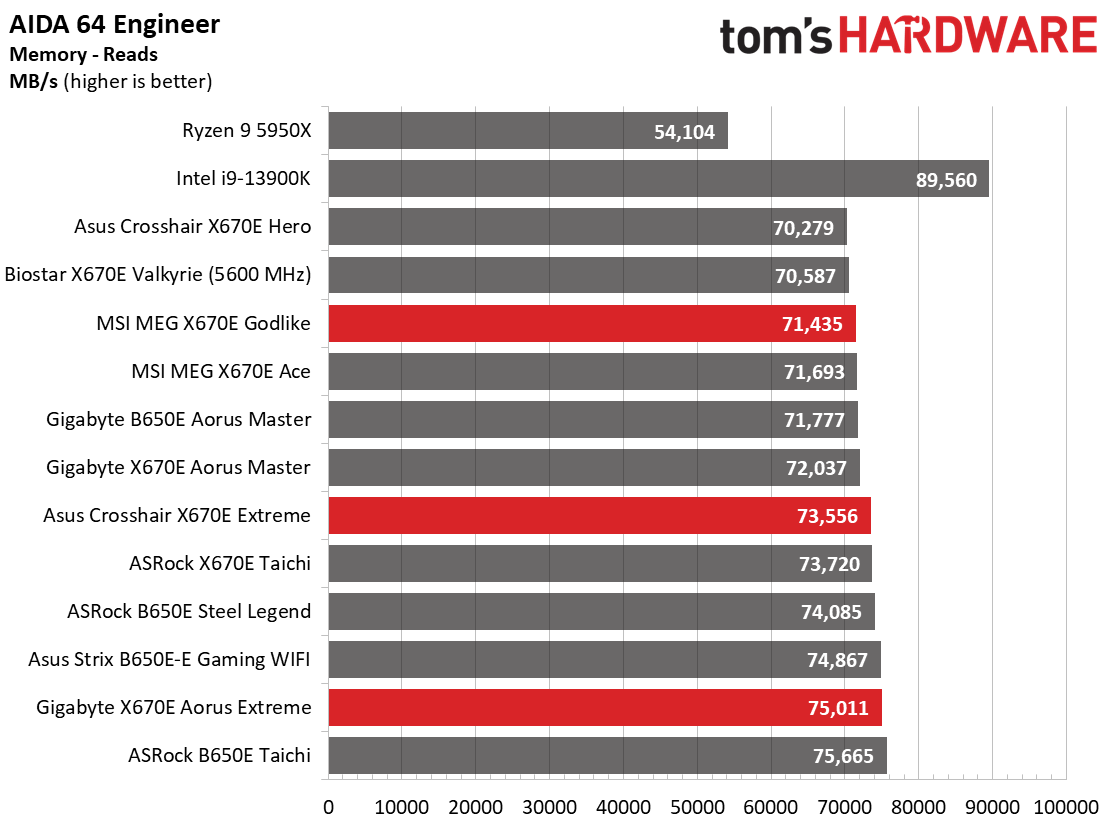
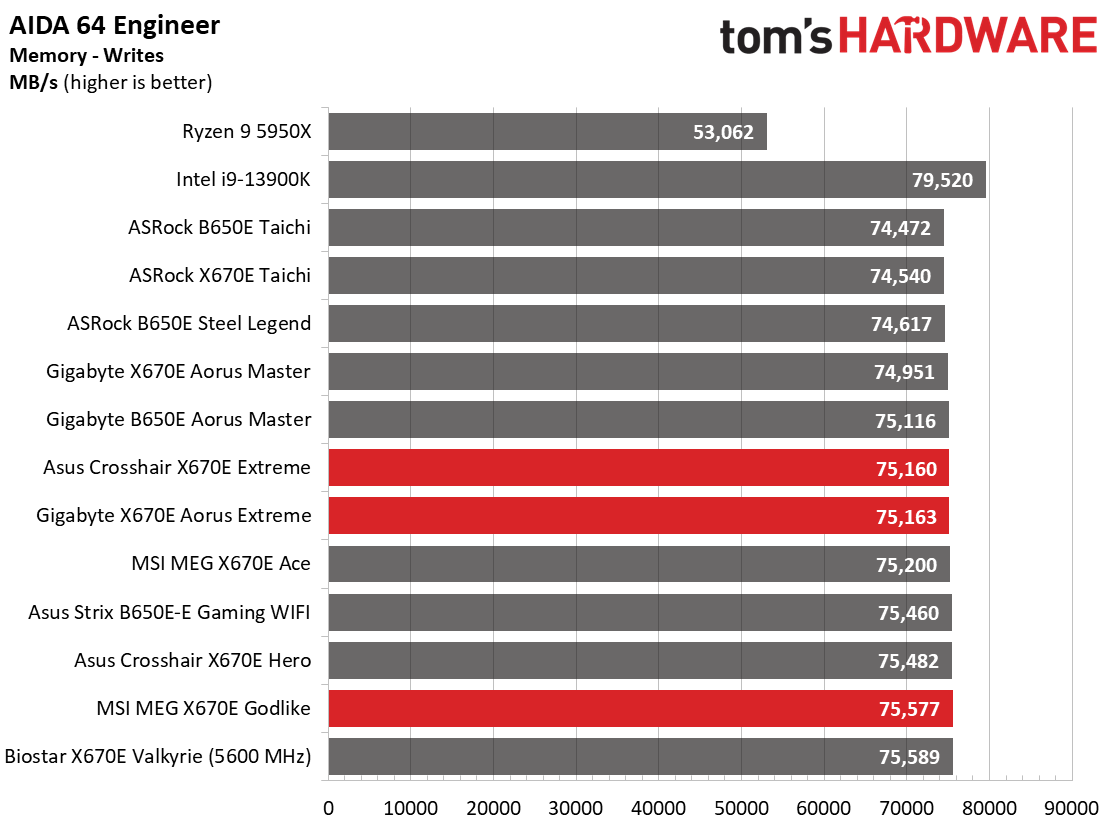
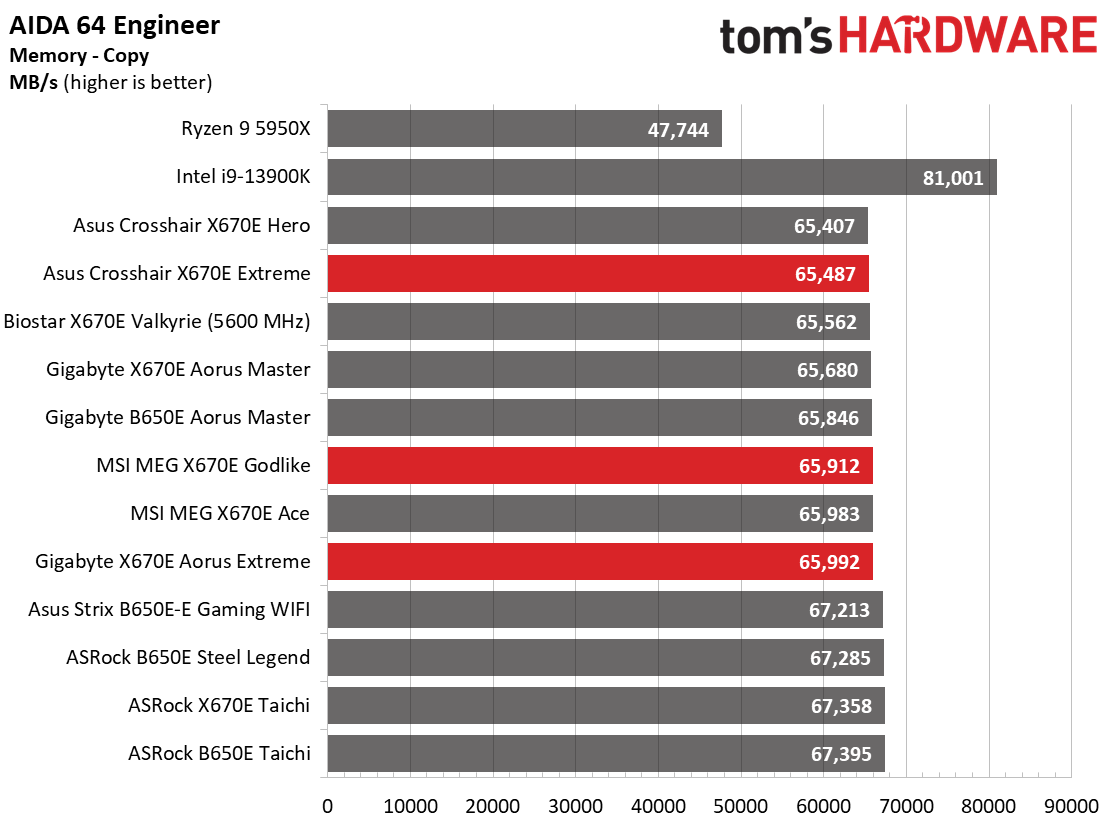
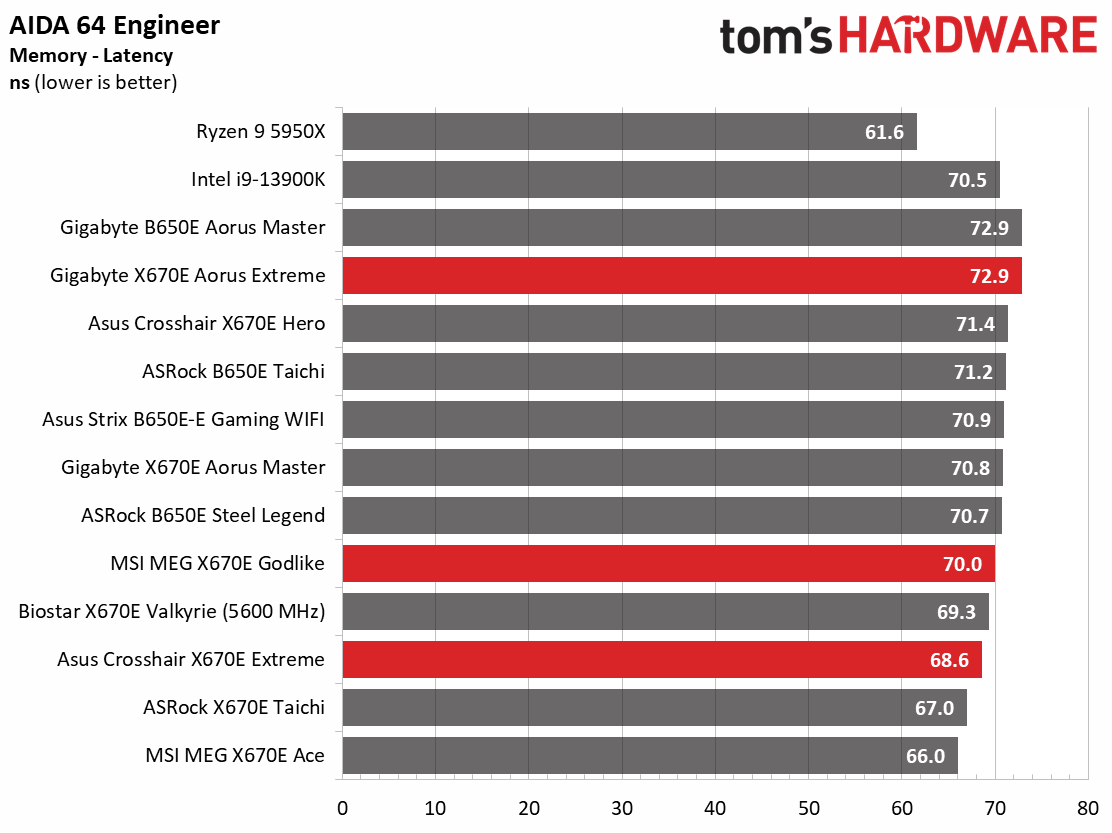
Across our synthetic benchmarks, all these boards performed well, ending up around the average when it’s all said and done. In several instances, the Gigabyte X670E Xtreme was the faster of our group, though again, not by much.
Timed Applications
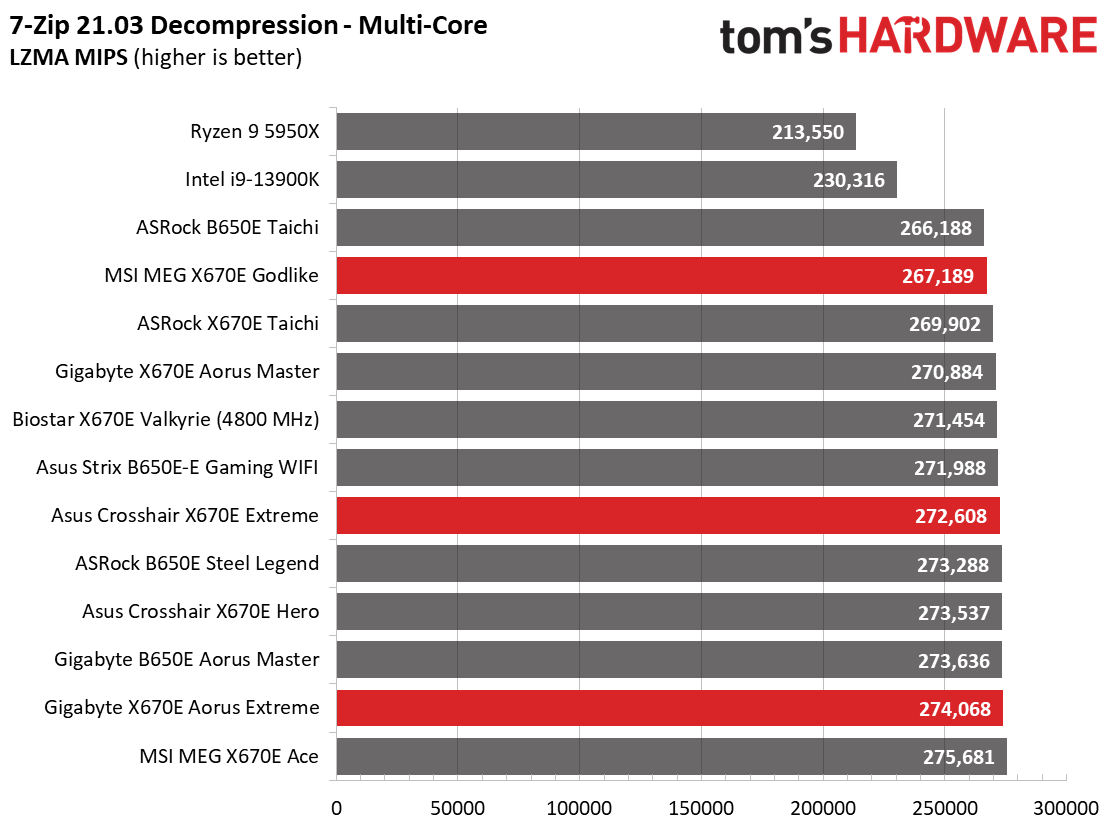
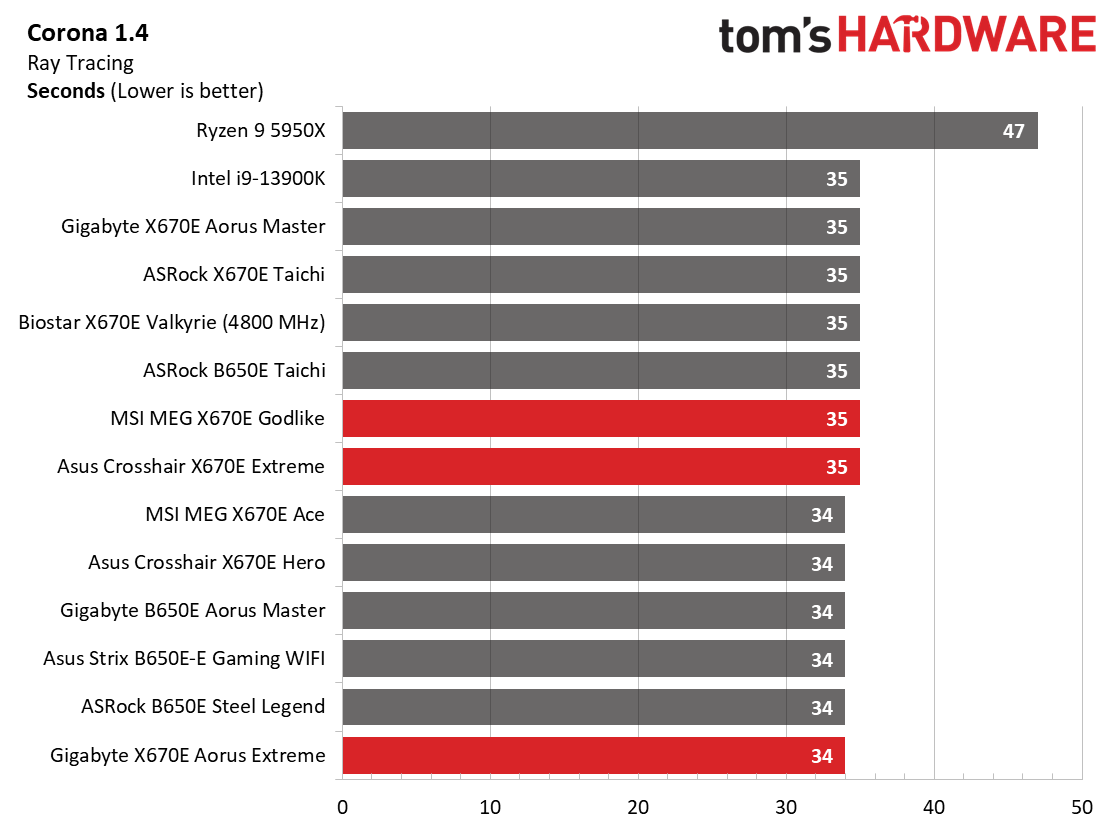
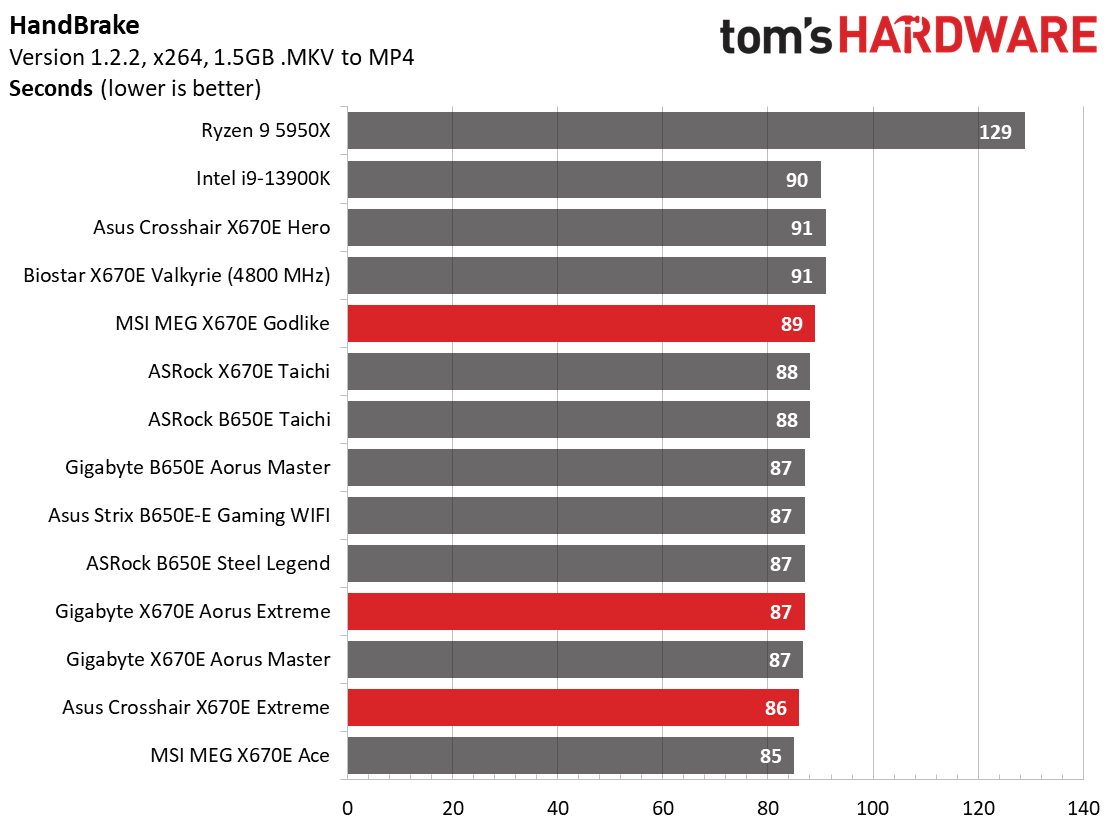
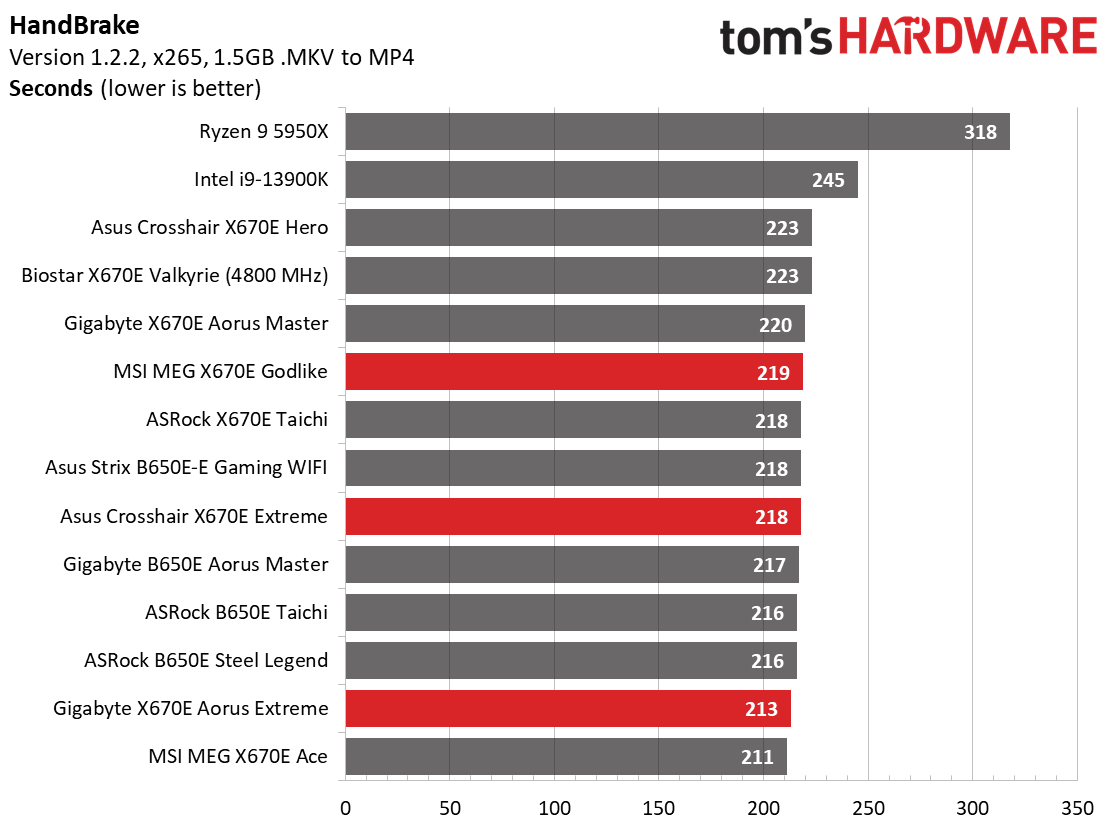
In our timed applications, both of the ‘Extreme’ boards led the MSI Godlike. Although the difference wasn’t big, it was still a trend in these timed applications (and several others below). That said, none of the results, slower or faster, are significantly out of line, and all of the boards were performant in these tests.
3D Games and 3DMark


Starting with the launch of Zen 4, we’ve updated one of our test games, F1 21 to F1 22, while keeping Far Cry 6 in our testing suite. We run the games at 1920x1080 resolution using the Ultra preset (details listed above). As the resolution goes up, the CPU tends to have less impact. The goal with these settings is to determine if there are differences in performance at the most commonly used (and CPU/system bound) resolution with settings most people use or strive for (Ultra). We expect the difference between boards in these tests to be minor, with most falling within the margin of error differences. We’ve also added a minimum FPS value, which can affect your gameplay and immersion experience.
Get Tom's Hardware's best news and in-depth reviews, straight to your inbox.
Looking at the results from our gaming tests, our flagships did well here again, posting average or above-average results in the 3DMark tests and F1 2022, but merely average among all results in Far Cry 6. Like the Z790 flagships, these are competent gaming boards too.
Overclocking
When overclocking, we aim to increase the power and add stress to the VRMs. We do so by increasing the clock speed and voltage until we’re at the thermal threshold for the processor during stress testing. However, where these CPUs are allowed to run with ‘boost’ speeds, those speeds are closer to the limit than ever before.
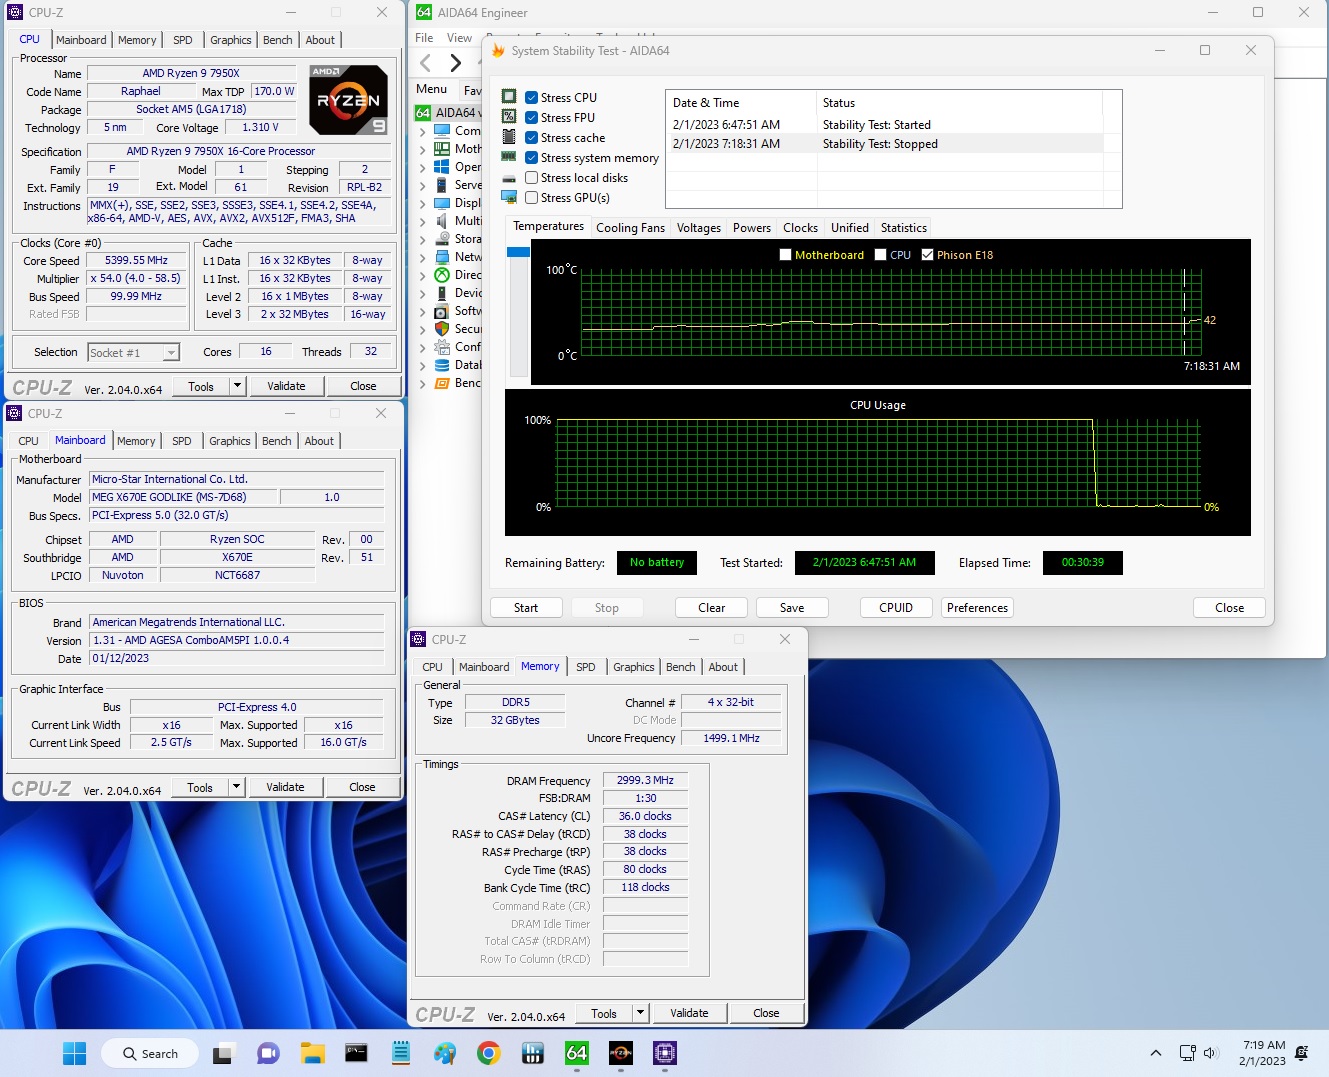
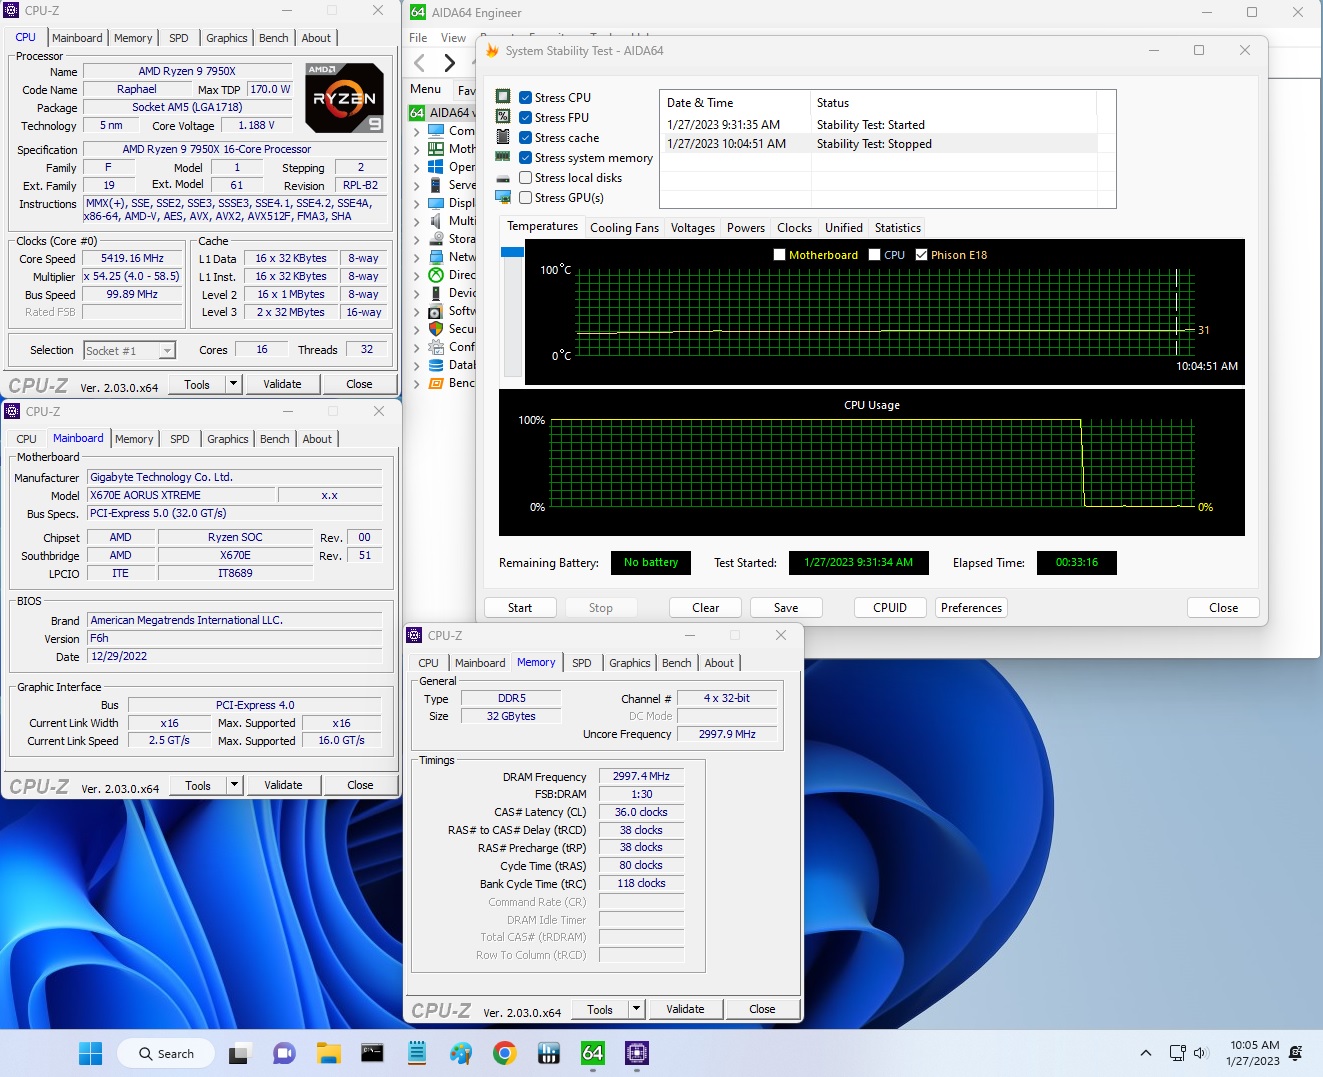
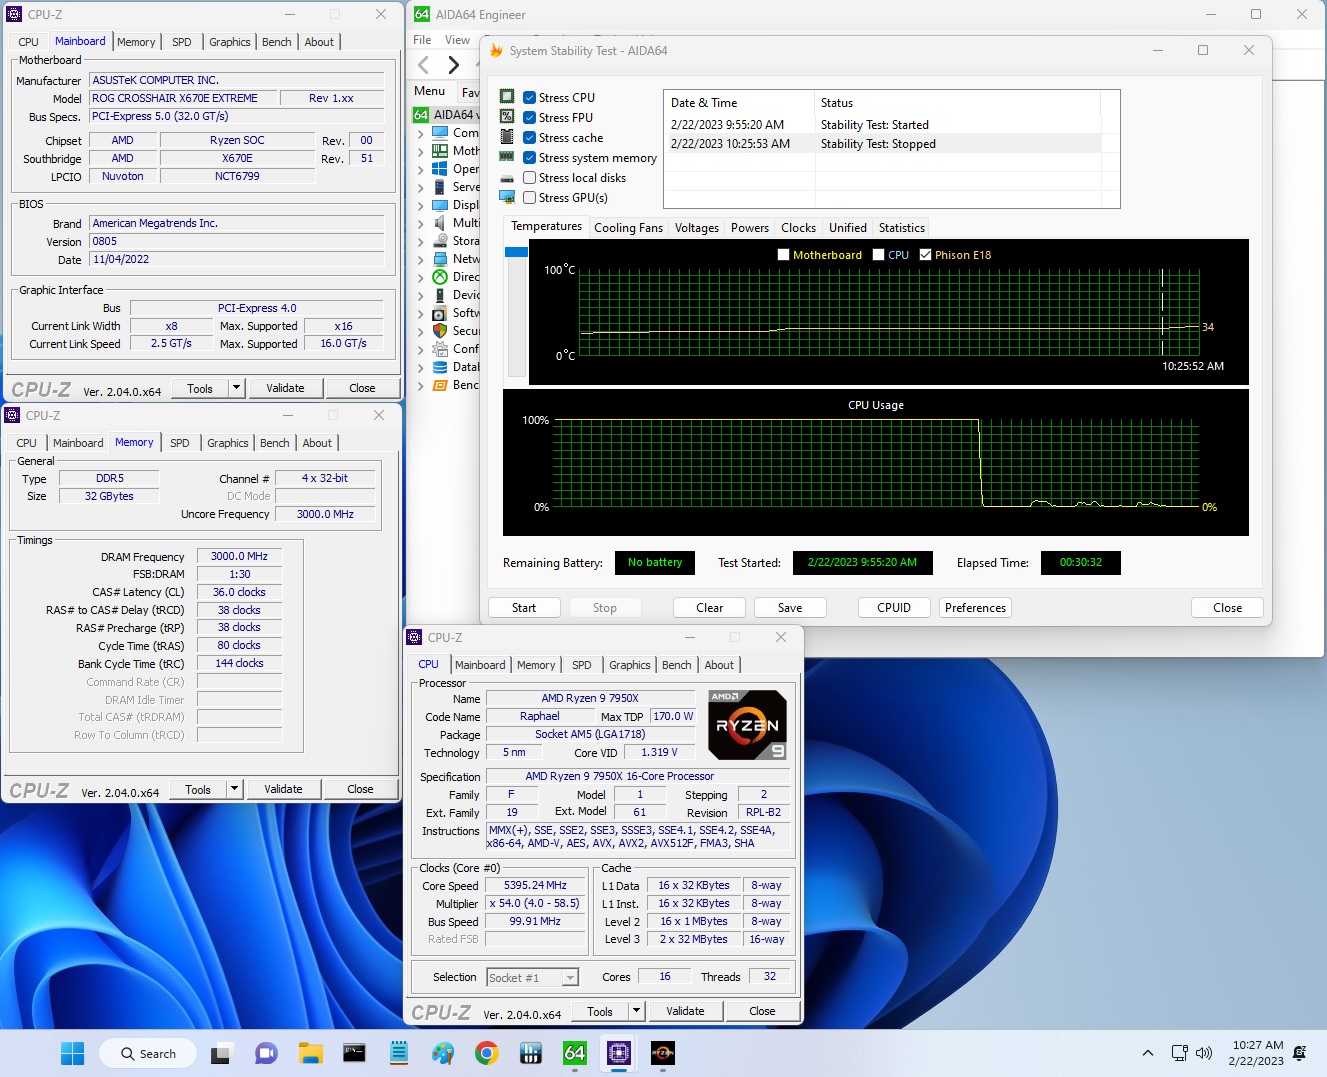
Overclocking with all three boards was simple and easy. We plug in our values, set the voltage to manual, adjusted LLC if needed, and off we went. Once in Windows, we applied the stress test load and successfully finished our short test on all these boards. No fiddling was needed outside of the usual suspects (voltage, multiplier, and LLC adjustments).
On the memory side, we dropped our Kingston Fury Beast DDR5-6000 kit in the systems, enabled XMP, and tested it without issue, as expected. The boards list speeds above this, but your mileage may vary, as reaching speeds past this depends on the memory kit, the quality of the IMC, and the motherboard/BIOS. Quite frankly, most boards top out around DDR5-6400 anyway.
Power Consumption / VRM Temperatures
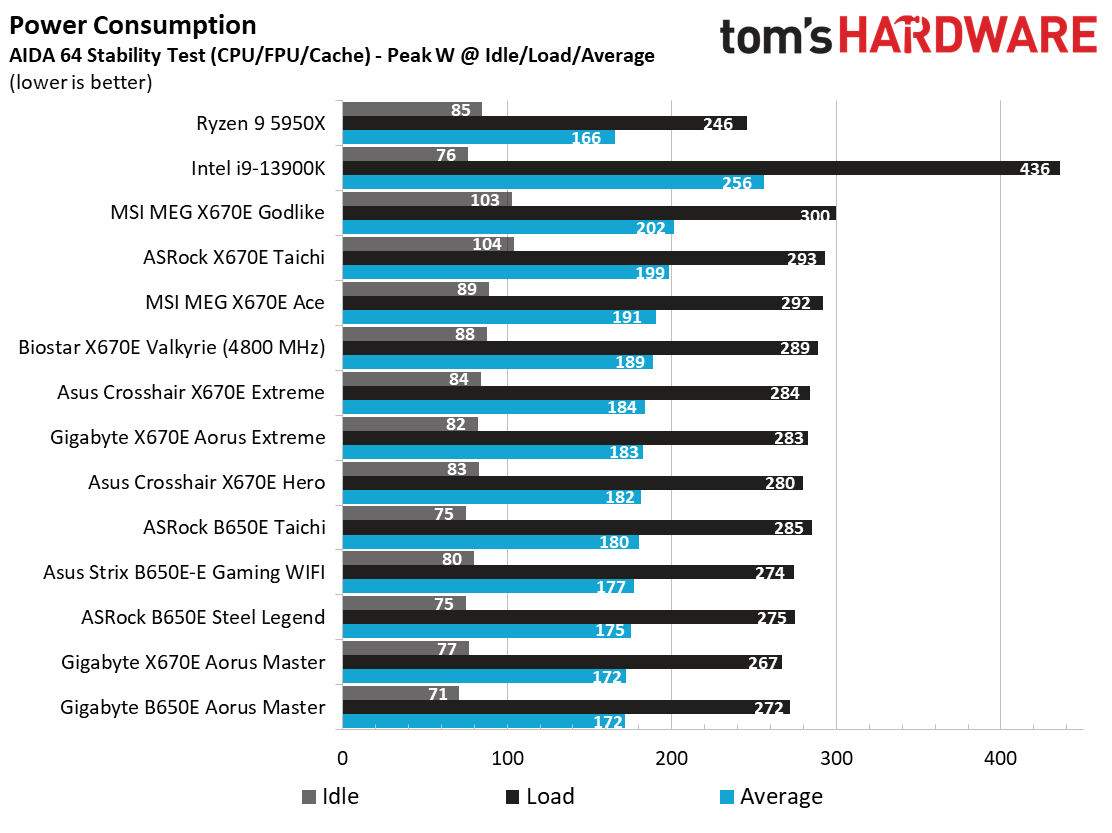
We used AIDA64’s System Stability Test with Stress CPU, FPU, Cache and Memory enabled for power testing, using the peak power consumption value. The wattage reading is from the wall via a Kill-A-Watt meter to capture the entire PC (minus the monitor). The only variable that changes is the motherboard; all other parts remain the same. Please note we moved to use only the stock power use/VRM temperature charts, as this section aims to ensure the power delivery can handle the chip even when overclocked. Since we’re using less power to get more clocks, those datasets are more novel than useful. We’re also temperature limited on the processor, so adding more power isn’t possible without increased throttling.
The power consumption difference between our three review boards was around 10%, with the Godlike becoming our first AM5 board to average over 200W between idle and a stress test load. The Godlike idled higher (103W compared to 84W and 82W) and used slightly more power under load (300W compared to 284W and 283 for the Crosshair Extreme and Aorus Xtreme, respectively) to reach this distinction.
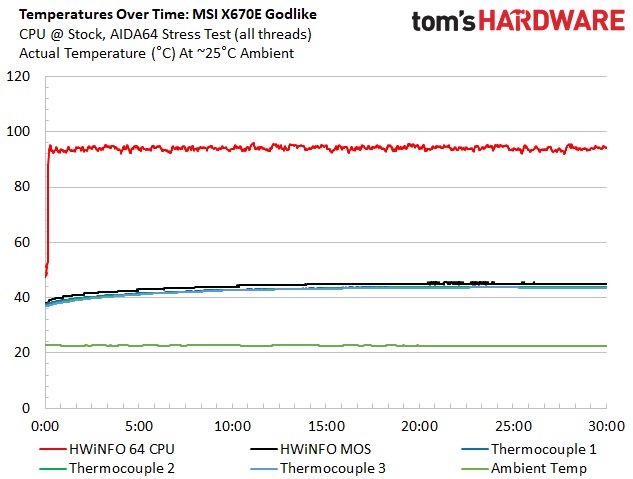
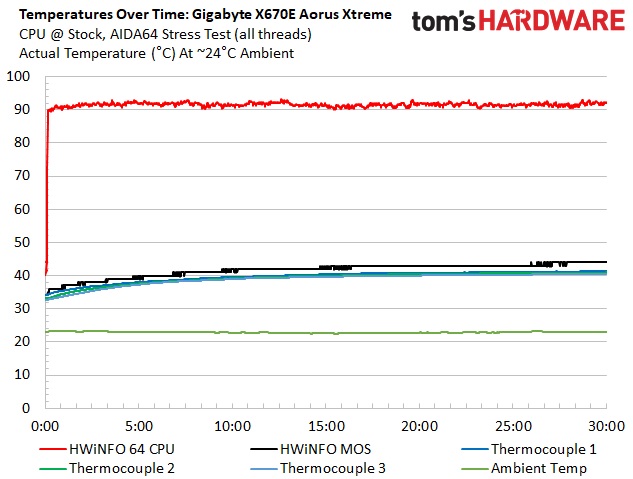
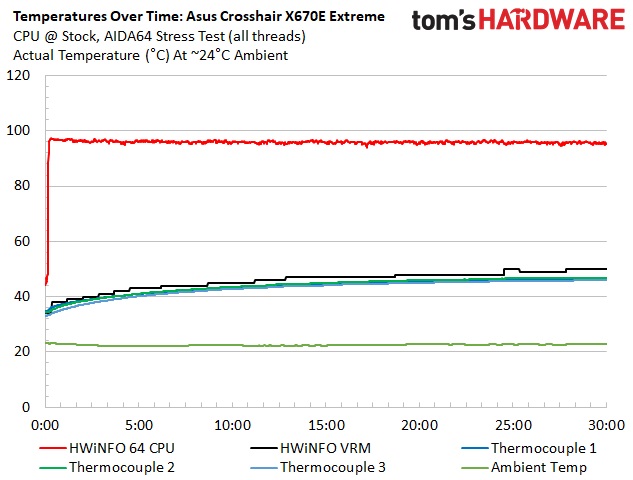
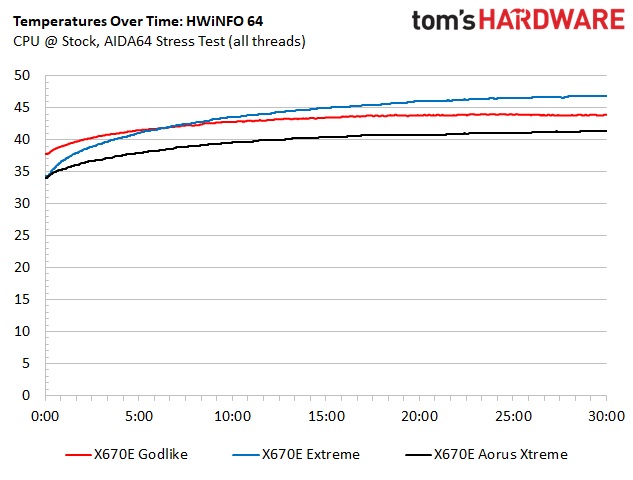
VRM temperatures on the boards were more than acceptable, keeping the overkill power bits underneath running well within specification. In fact, none of the boards broke 50 degrees Celsius in our stress testing, which is quite impressive. These boards won’t have any issue driving AMD’s processors with any cooling option.
Bottom Line
Right out of the gate, all of these flagship boards offer the best of the best for the current AMD platform. Each board includes overkill power delivery, 10 GbE ports and Wi-Fi 6E, PCIe 5.0 slots and M.2 sockets, and a high-end appearance. From there, we find a few differences, with most (but not all) boards implementing flagship-class audio and some using 40 Gbps USB ports. Still, which is better for you is generally going to come down to price and appearance, unless you absolutely need those features.
That out of the way, let’s address the elephant in the room: pricing. At the time of this writing, The MSI X670E Godlike at $1299.99 is, by far, the most expensive AM5 board. Asus’ ROG Crosshair X670E Extreme checks in at $999.99, while the Gigabyte sits at $699.99. A dark horse in the race is ASRock’s flagship, the X670E Taichi, at $479.99. Frankly, the Taichi is arguably the most well-rounded and is, by far, the least expensive option. It has everything the more expensive boards do, including 40 Gbps USB ports, the latest generation audio codec, overkill power delivery, and even the look.
So which flagship board should you choose? That’s a tough one, as each has redeeming qualities. The MSI X670E Godlike and its six total M.2 sockets are on the table if budget isn't a concern, but that price needs to come closer to $1000 as there’s nothing it offers more than the other boards outside of additional M.2 sockets. The Asus is a great option for those looking for all the bells and whistles but unwilling to pay for the MSI. Gigabyte’s Xtreme is a great option as it’s reasonably priced (for a flagship) but does not have 40 Gbps ports or current-gen flagship audio. Chances are that’s not a deal breaker for most users, however. If you’re looking to get the most bang for your buck out of these flagships and don’t require more than four M.2 sockets, ASRock’s X670E would be my weapon of choice in the battle of these behemoths. That’s one of the reasons we’ve already given it a full review and placed it in the number two spot on our best motherboards list.
MORE: Best Motherboards
MORE: How To Choose A Motherboard
MORE: All Motherboard Content
Current page: Test System, Benchmarks and Final Analysis
Prev Page Asus ROG Crosshair X670E Extreme: Specs and Features
Joe Shields is a staff writer at Tom’s Hardware. He reviews motherboards and PC components.
-
evdjj3j I'm surprised MSI uses the name Godlike. I could see that turning off a lot of Christians.Reply -
Avro Arrow They call them "Flagship" motherboards.Reply
I call them "Irrelevant motherboards that people do not buy." :LOL:
Seriously though, these really are irrelevant to most people because no matter who is king at this level, things can be very different at the price points that most people are willing to pay.
Like, if I were in the market for an X670E board, I'd be looking at the ASRock X670E PG Lightning. ASRock isn't even represented here, probably because they don't think that there is a need for anything more expensive than a Taichi. -
Elusive Ruse Can you guys focus on B650 boards as well? All you seem to review is stuff that lands the manufacturers juicy dough.Reply -
simonharris314 Can I just ask how you managed to get an Intel Core i9-13900K running on an AM5 motherboard?Reply
Maybe the test system needs to be looked at?
H -
jxdking Why testing with DDR5-6000 CL36, not CL30 stuff?Reply
Why testing with RTX 3070, not RTX 4090?
Why MSI's uncore frequency is 1500MHz in CPU-Z, while other 2 boards running on 3000MHz?
PS: They are on different AGESA as well. CPU boosts differently on differently AGESA. -
PlaneInTheSky Dude, if I'm going to buy a $1,000 mobo, it better come with a bar of gold attached to it.Reply
Who even buys this, rich kids from Saudi Arabia or something. -
jdalso When I look at the Asus manual for the reviewed motherboard, the only sharing is between the 2 PCIe slots which will run at x8,x8 when both are used. It has multiple m.2 v5 slots that run without sharing with the PCIe slots.Reply -
MKBL Is this typo? Intel CPU on X670E?Reply
Test System ComponentsCPUIntel Core i9-13900KMemoryKingston Fury Beast DDR5-6000 CL36 (KF560C36BBEAK2-32) GSkill Trident Z DDR5-5600 CL36 (F5-5600U3636C16GX2-TZ5RK) -
waltc3 Nice write up! One thing I would have enjoyed seeing pictured is the back of the motherboards. I've never understood why some reviews don't bother with shots of the back of the reviewed boards. My x570 Master comes standard with a backplate on the back of the board, which not only lends it weight, but most importantly keeps the board from any sort of warp so that the dimensions are always the same (fits the stand-offs perfectly, etc.) Sometimes a pic of the board back can offer some insight into board construction.Reply
All of these mboards disappoint. I'm not going to go Intel, so I'll only compare and look for AMD mboards. MSI/Asus--far too expensive. Just ridiculous, frankly. You're right, the best board buy seems to be the Asroc you've mentioned. The GB board features almost the identical sound hardware that is featured on my x570 Master! They couldn't have improved it? Sad. $360 for my x570 was a great buy, considering the features it offers. The x670e Aorus Master costs $140 more than my x570 Master, but lacks several of the must-have features that made the Master so popular are not present in the x670e Master--including, incredibly, no backplate Clear CMOS button! And last, these are all E-ATX, which is going to require a new case purchase, on top of the rest of it. The 5800X3D is looking better all the time.
