Are We Losing Interest in Computers?
Google usually does not reveal too much detail of its search traffic, but when it does, there may be some interesting implications of user behavior.
As part of its financial website, Google allows users to compare search traffic of aggregated industries against the developing price of stock. The search traffic is normalized to the value of 1.0 and the search volume that occurred on January 1, 2004. Don't expect any dramatic revelations or search numbers or even a search volume pertaining to a single company. However, the selection of 27 industries and related search terms may cause some speculation of a changing way how we acquire information.
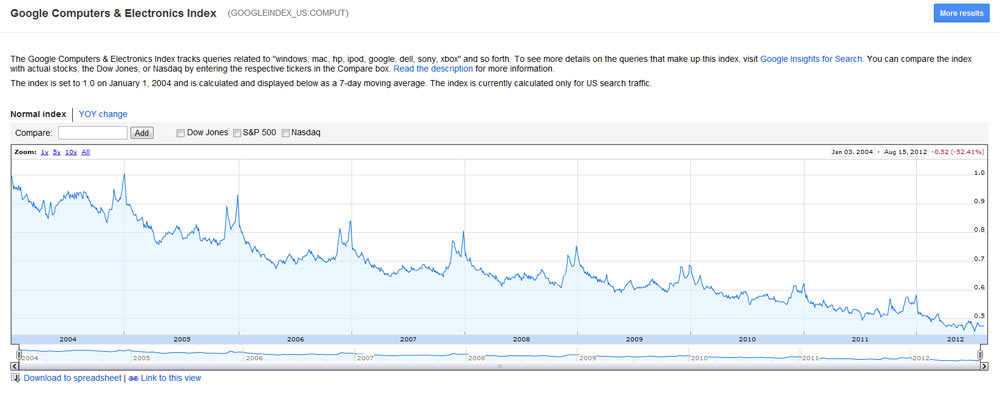
For example, the data suggests that the search volume of traffic that targets computing topics has decreased by 52 percent since 2004. Of course, without knowing the details on how Google selects this traffic, it is rather adventurous and even silly to suggest that we do not search computing topics as much as we did eight years ago. Interests could be shifting and Google may not be able to capture the changes right away. Also, some of the graphs are somewhat misleading considering the nature of periodic seasonal search spikes.
Yet it is startling that there has been a persistent decline in this segment. Though, most other segments seem to be suffering as well; advertising is down, as are business and industrial, commercial lending, construction, durable goods, finance and investing, and furniture. The search areas that gained are especially credit cards, mobile devices, mortgage and rental. Google says that its search index can reflect consumer behavior and if we are looking at our economic environment, they may have a case here. We surely live in times that may encourage interest in credit cards, mobile devices, mortgages and rentals.
Nevertheless, the decrease in the computers and electronics segment may be surprising.
Get Tom's Hardware's best news and in-depth reviews, straight to your inbox.

Wolfgang Gruener is an experienced professional in digital strategy and content, specializing in web strategy, content architecture, user experience, and applying AI in content operations within the insurtech industry. His previous roles include Director, Digital Strategy and Content Experience at American Eagle, Managing Editor at TG Daily, and contributing to publications like Tom's Guide and Tom's Hardware.
-
camel82 Maybe there are more non-technical related sources of information on the web now than 10 years ago?Reply
Blogs, social networks, newspapers, kittens, memes, 9gag jokes... -
rantoc All this could be due to any number of things.Reply
Some examples.
People have learned to search more efficient resulting in fewer queries.
People have more pref sites they visit and rarely search for new as long as their favourites are adequate.
ect ect ect.
-
greghome or....instead of not having anything to do, most people on the internet these days just stay on Facebook and/or tweeterReply -
TheBigTroll if computers are powerful enough for most peoples usage, they probably dont need to research about computer parts since they dont need to upgrade. could be wrongReply -
Or more simply, if you don't have the money to spend on computer/technology etc etc you are less likely to look at something you can't afford at this very moment.Reply
-
idroid rantocPeople have learned to search more efficient resulting in fewer queries.Reply
people don't learn. -
egilbe More people were n00bs back in 2004 and now more people are growing up with computers in their daily lives. People learn and they don't need to keep going back to research the same topics.Reply -
saturnus It a quite natural development that as the internet matures the focus is shifted from being focused technological aspects to social aspects.Reply
Computers have also shifted from being something people built to something people buy. 10 years ago the Apple slogan "It just works" made perfect sense that for most people PCs just didn't work. They needed help putting a decent system together, install the needed drivers and so forth. Most of the shelf solutions back then were underpowered and/or half finished products. Today, practically any off the shelf computer system will do exactly what the constumer wants and hence our specialist section that follows the tech news to get the best of the newest for our system is a dying breed.
Now I can't really see if the graph shows percentages or total amount of searches but percentages should naturally be down as the user mass increases because of the above reason. If it's total number of searches that are down, that's worrying news for sites like this that depend on traffic on which the commercials revenue is based upon.
